12 Best TeamGantt Alternatives in 2025
Have you tried TeamGantt and found it isn’t quite what you need? Or maybe you’re about to try TeamGantt for the first time and want to see the best alternatives.
The list I’ve created here will give you all the know-how you need, whether you’re finally giving up on TeamGantt and need a better tool fast or just researching what else is available.
Most of the alternative apps on my list have a strong Gantt chart maker built in – many of them have been featured on our list of the best Gantt chart software – but they all have different strengths, including other view types, integrations, and project management features so that you can select the right fit for you.
Visor enables you to create crystal clear visualizations of your projects and portfolios. Visor Gantt charts are well known for their ease of use and stunning clarity.
You can also use Visor to get a portfolio-level view of all your projects and to create visualizations using data from apps like Jira, Salesforce, and Asana using its sophisticated two-way integrations. You can try Visor completely free now, or read on to see other alternatives to TeamGantt.
TeamGantt – Why You Might Want An Alternative
TeamGantt is popular because it enables people to easily create Gantt charts that incorporate simple workload and team tracking functionality.
The reasons why people want an alternative to TeamGantt vary from person to person, but here are the key reasons that I’ve encountered:
- Limited support for other visualization types (such as Kanban boards)
- Basic reporting that is difficult to customize
- Lack of automation and time-saving features (such as auto-scheduling)
- A need for more advanced project management features (such as resource management)
- Dissatisfaction with the sharing options available
- Difficulties with the UI and navigation
- Lack of customization options and color coding options – more on why this is important below.
Being able to color code your Gantt chart precisely the way you want might seem superficial, and people often overlook this aspect when choosing a Gantt chart tool.
However, assessments of color theory in project management have shown that the right use of color can have a big impact on how your projects are perceived by others and on your ability to communicate key information visually and, therefore, more quickly.
As you read the overviews of my favorite alternatives to TeamGantt below, consider what you want from your project management tool and which fits best with what you really need.
The 12 Best TeamGantt Alternatives You Should Try in 2025
Visor
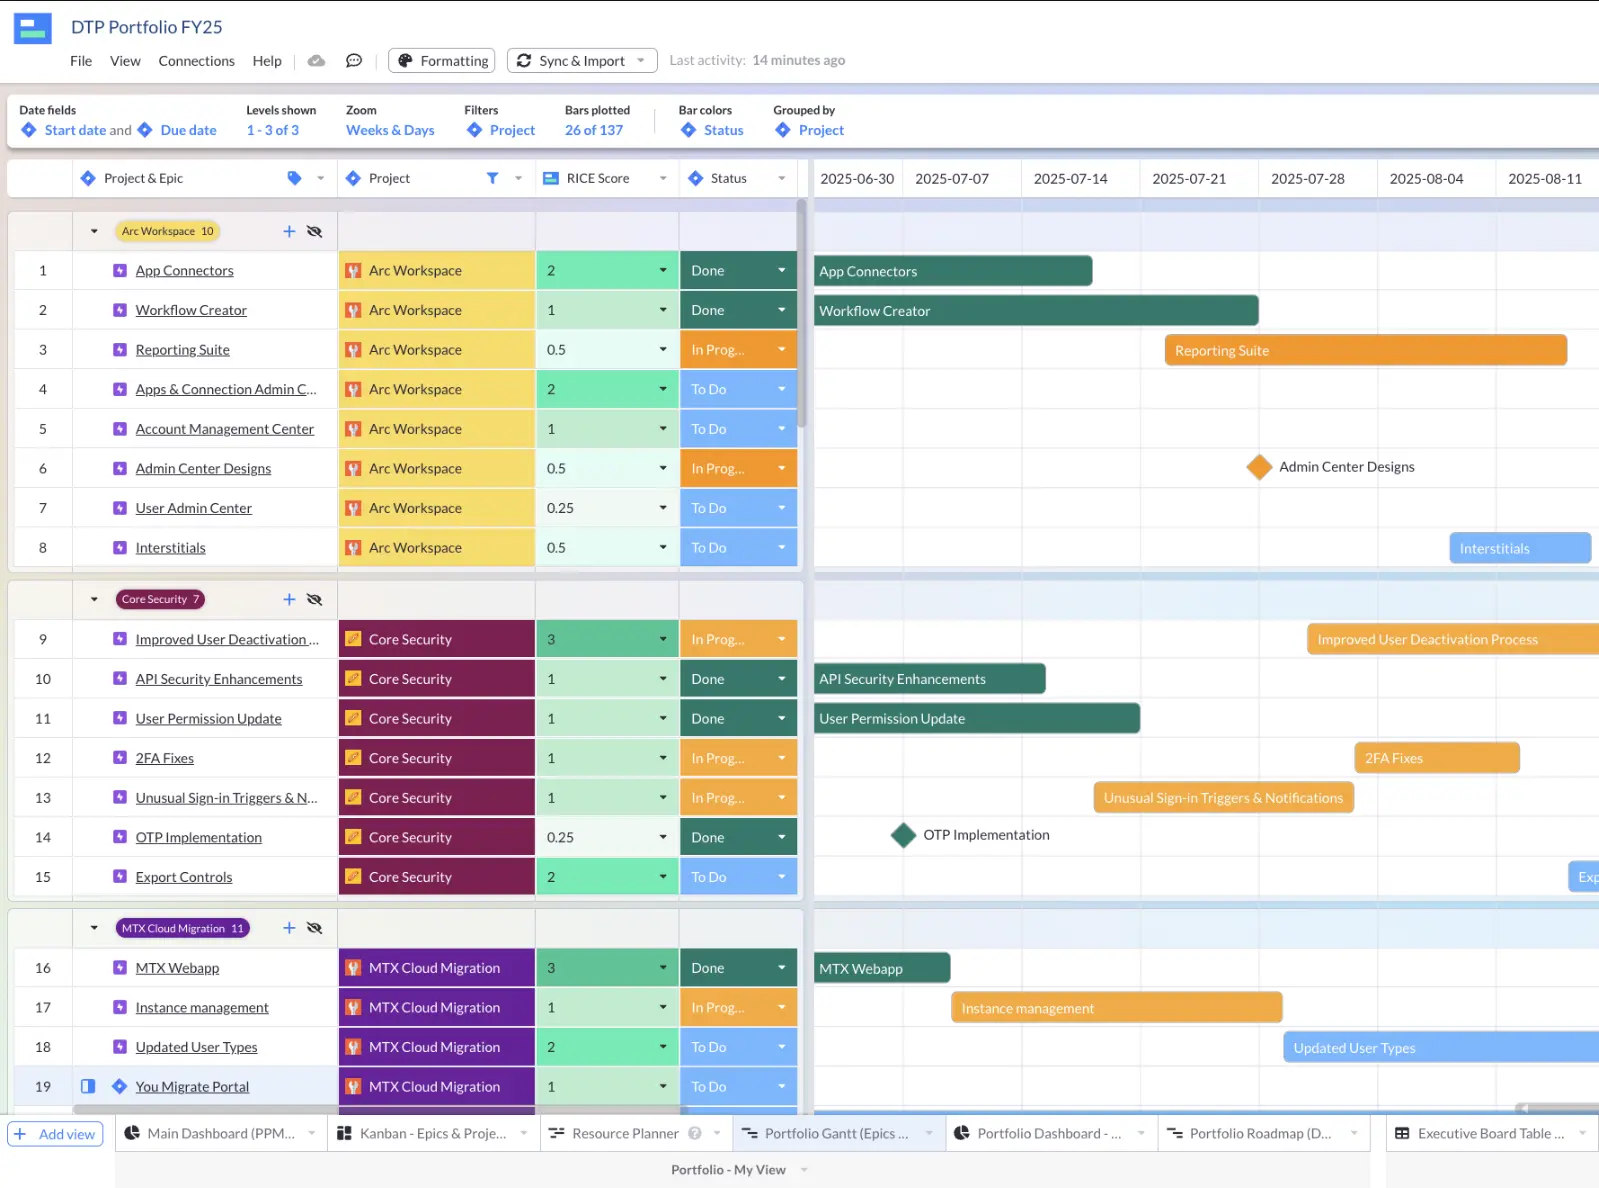
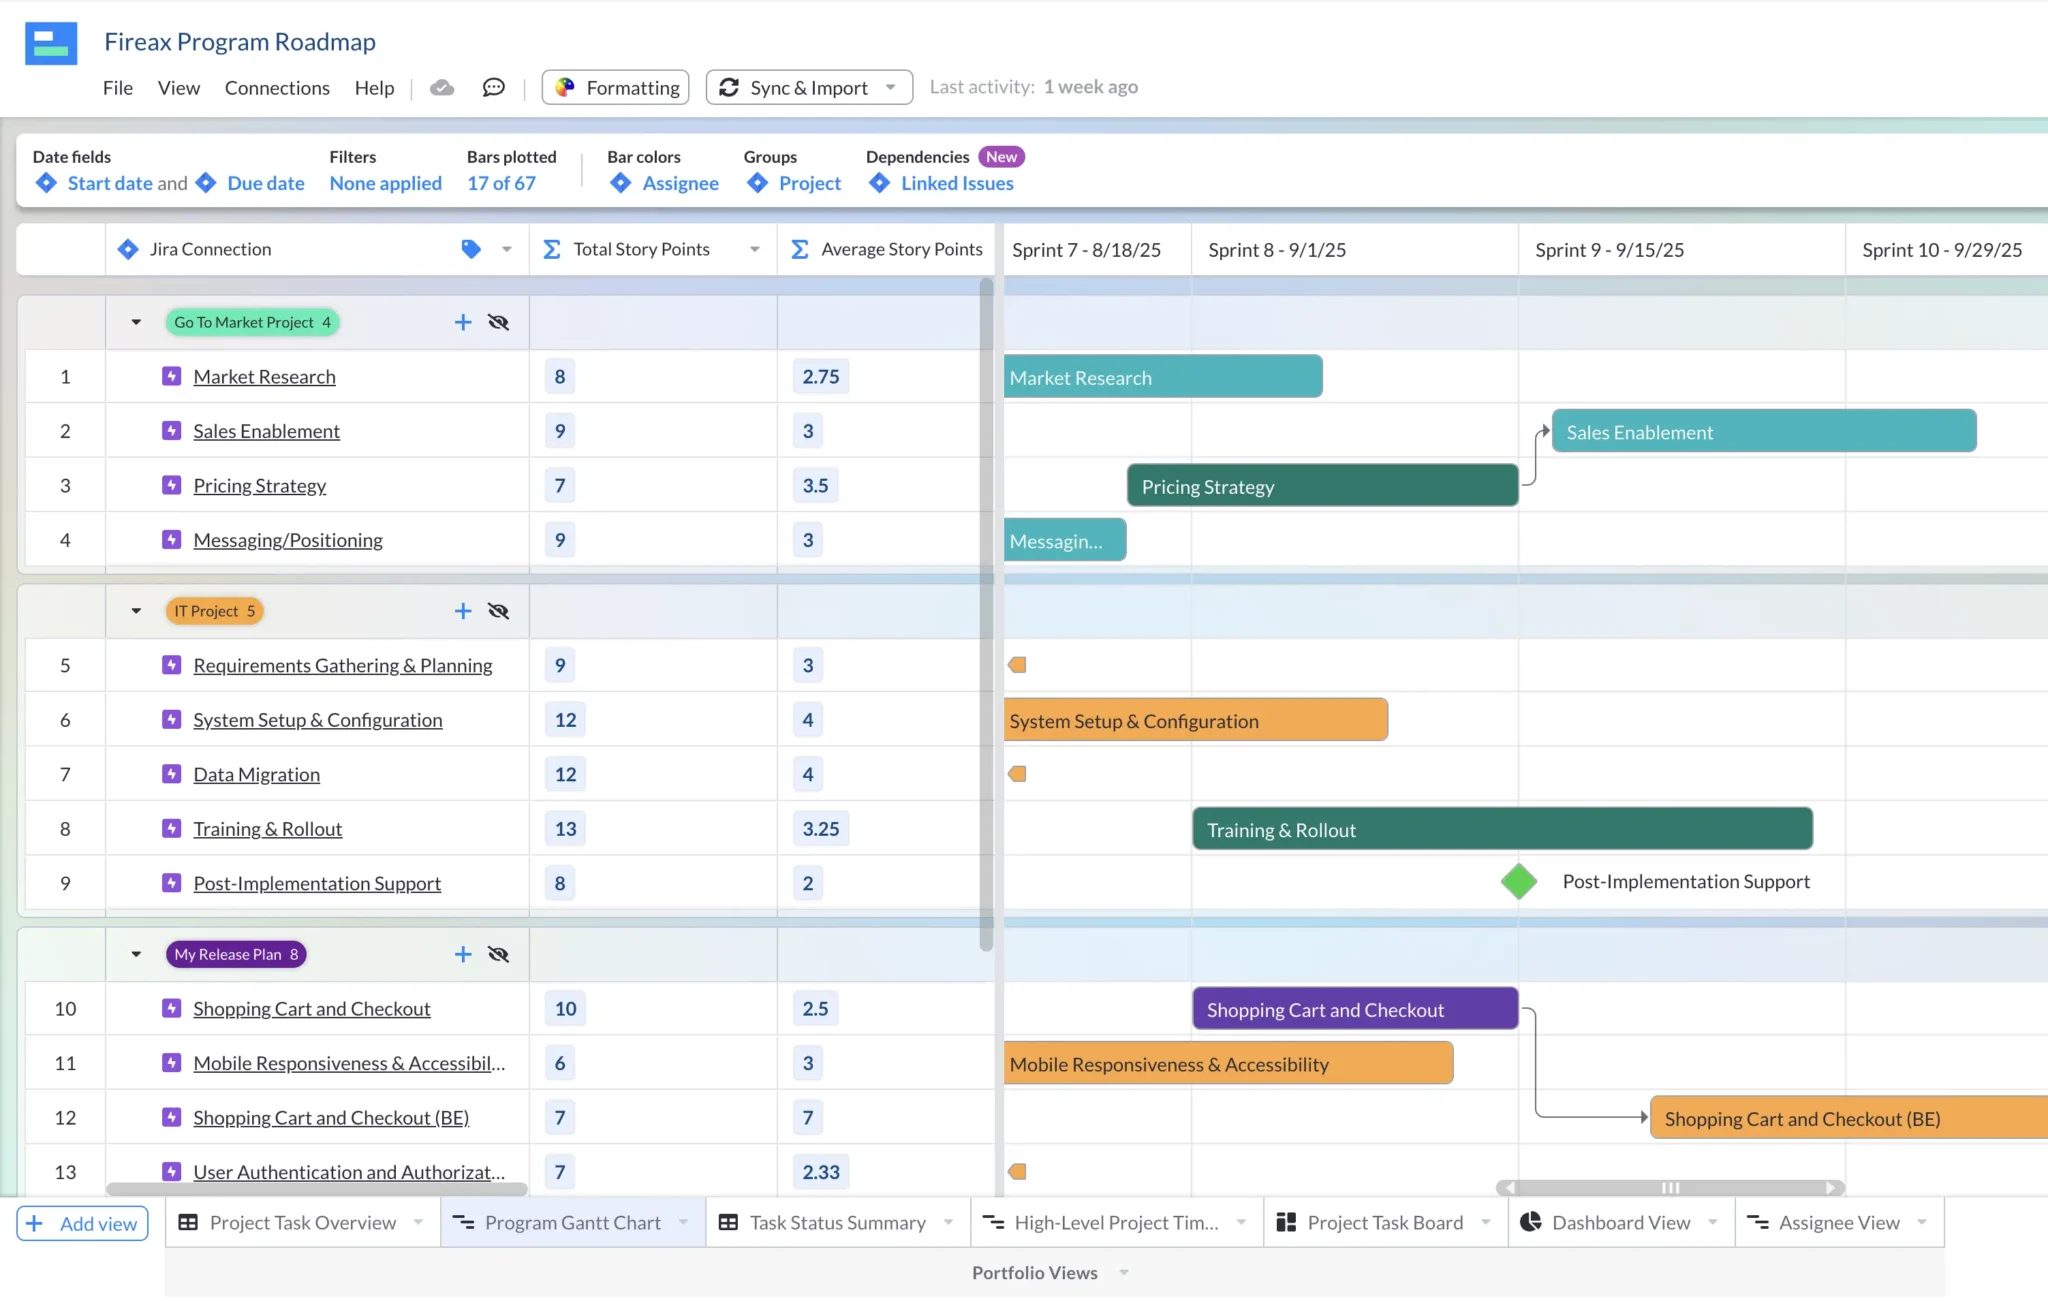
A multi-project Gantt chart in Visor, with Jira epics grouped by project
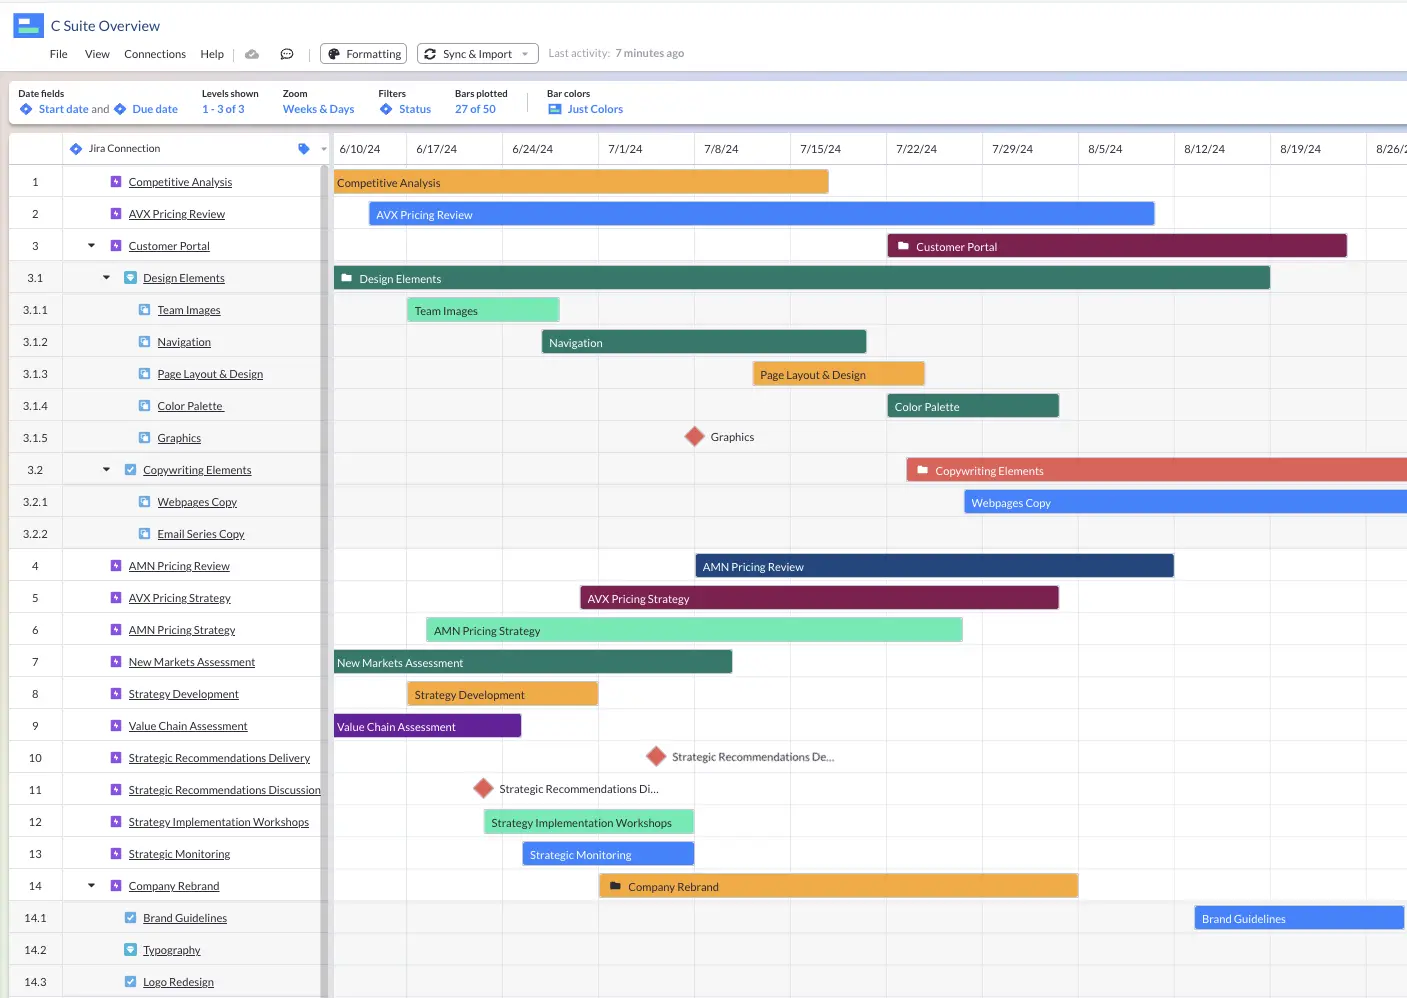
Visor is a versatile and easy to use project and portfolio management tool. You can use Visor to create crystal clear, easy to share Gantt charts (using the Gantt chart view), and a wide range of other visualizations too, including dashboards, Kanban boards, timelines, and table views.
Unlike TeamGantt, Visor has two-way integrations with popular apps like Jira, Asana, and Salesforce. This means you can create Gantt charts and other view types using live data from one or more of these apps.
You can also use Visor to create Gantt charts that combine multiple projects, giving you the ability to do project portfolio management and gain valuable insights into overarching project performance. Visor also offers a ton of templates using our Gantt view, such as a project milestone Gantt template and templates for agile release plans.
Compared to TeamGantt, Visor is also much more affordable for teams that require a mix of multiple editors or managers and collaborators. Visor’s Gantt charts are also considerably more customizable than TeamGantt’s.
Visor Pros
- Gantt charts and other visualization types look beautiful, professional, and modern
- Visor Gantts are much more customizable than TeamGantt, with the ability to fully customize:
- Gantt chart columns and fields
- Gantt chart color coding (including Gantt milestones)
- Dashboards and other view types
- Combine multiple projects into portfolio Gantt charts and other portfolio view types (including dashboards, Kanban boards, Table views)
- Gantt charts are fast and easy to build, customize, and share with anyone
- Create different views of the same project for different stakeholders or teams
- Two-way integrations with apps like Jira, Asana, and Salesforce
- Wide range of rollup calculations can be added (example below) to summarize parent task and project data
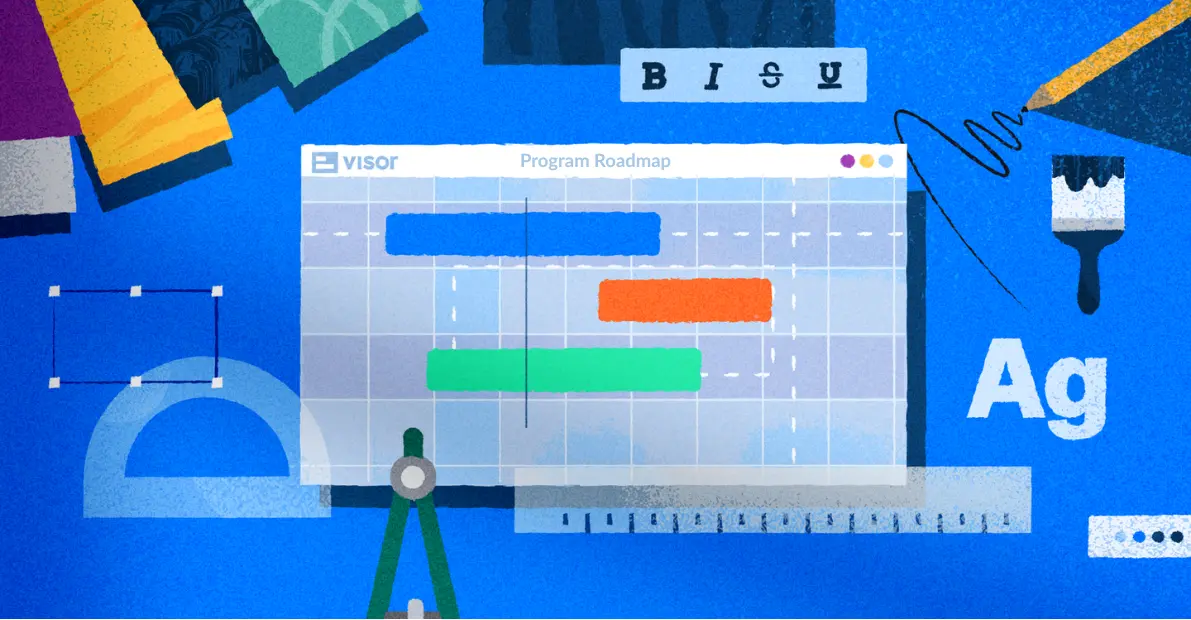
A program roadmap I created in a Visor Gantt chart:
Visor Cons
- Lacks automation features for task management
- Integrations are very powerful, but few in number
- Limited complete resource/finance management features
Visor Pricing
- Free: $0
- Starter: $18 per user per month
- Team: $24 per user per month*
- Business: $525 per month (flat rate for up to 100 users)
*You can get started now with a free trial of Visor Team
Visor Ratings and Reviews
- G2: 5 out of 5
- Capterra: 4.5 out of 5
GanttProject
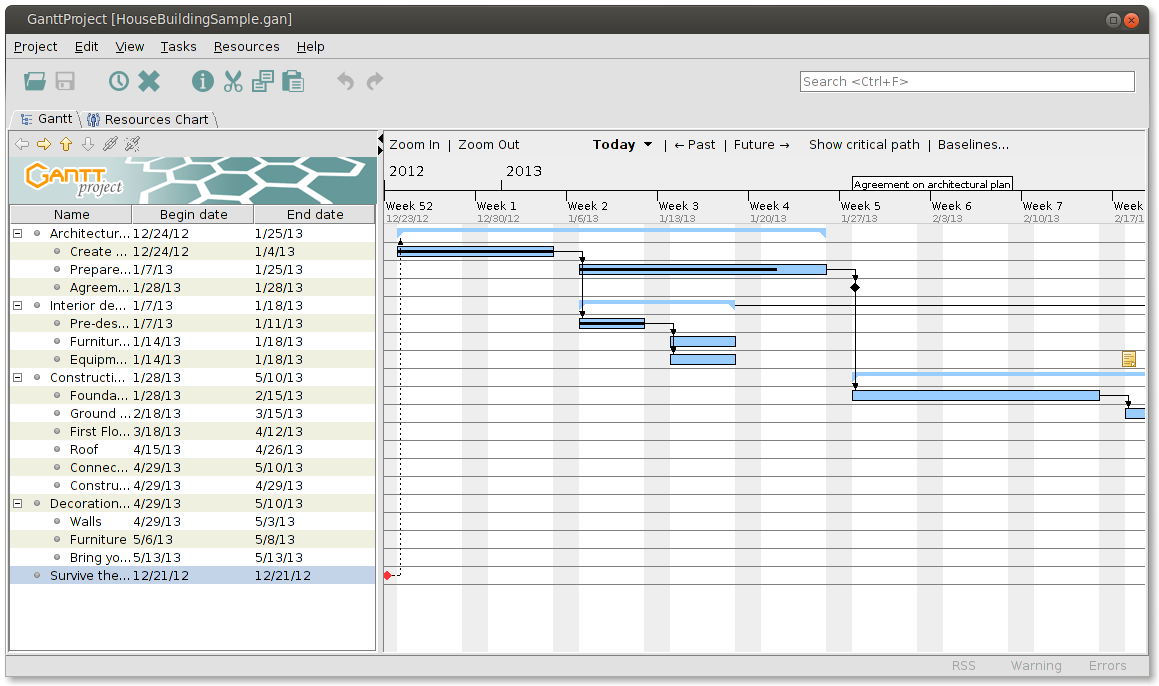
GanttProject is an open-source Gantt chart tool that you can use completely free, which is the main reason it’s number two on my list.
GanttProject is a desktop app, meaning you install it rather than access it via a browser. This has pros and cons and is a different experience from most other Gantt chart software.
GanttProject has cornerstone features you would expect with a dedicated Gantt chart tool, including:
- Task dependencies
- Milestones
- Resource allocation
- Critical path analysis
It also includes useful features for managing resource-intensive projects, such as SQL calculated columns. These enable you to create Gantt charts with calculated task cost and duration.
GanttProject can feel a little basic and outdated, and the Gantt charts you create with it are unlikely to set the world alight, but it is a free and reliable tool that is well worth a try as an alternative to TeamGantt.
GanttProject Pros
- Free and open-source, with an active user community
- The basic interface that is relatively easy to learn
- Robust core Gantt chart features
- You can create and reuse project templates
GanttProject Cons
- Collaboration and sharing options are limited to PDF, image, CSV, and MPP exports
- The software, navigation, and Gantt charts look and feel very outdated
- Dumb dependencies – when you adjust the connected tasks, they don’t automatically adjust too, so you have to manually reconcile them
- Lack of Cloud or mobile access, meaning project management on the go is difficult
- It can become laggy when projects get big, and its basic attributes can be limiting when projects are complex
GanttProject Pricing
- Free
GanttProject Ratings and Reviews
- G2: 4.3 out of 5
- Capterra: 4.2 out of 5
Smartsheet
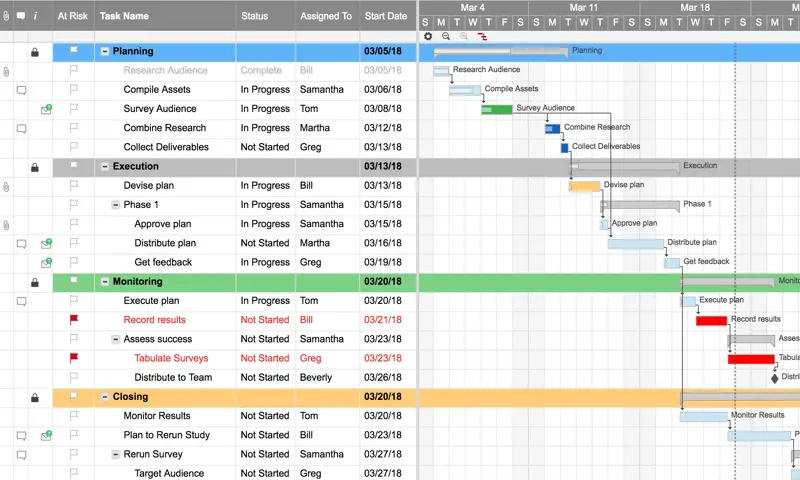
Smartsheet is a spreadsheet-oriented project management app that you can use to create comprehensive and detailed Gantt charts.
Smartsheet enables you to create Gantt charts that appear relatively simple on the surface, but have powerful, advanced background features, including workflow automation, resource management, and critical path analysis.
Although Smartsheet does have integrations with popular apps like Jira, these only come in the form of very expensive add ons. Viewing Gantt charts in Smartsheet also requires editor level access, which could constrain your ability to share your plans with stakeholders.
The acquisition of Smartsheet has led many to speculate that the app and its pricing will be tailored toward larger enterprise customers, making it inaccessible or unsuitable for SMEs. Something to research further if you’re considering Smartsheet as an alternative to TeamGantt.
Smartsheet Pros
- Wide range of automation, resource management, and task management functionality
- Highly customizable Gantt charts
- Includes advanced Gantt chart features like critical path analysis
- Highly scalable and able to handle large, complex projects
Smartsheet Cons
- At the top of the project management tool price range, especially if integrating with apps like Jira
- Very basic dependency management: Manual set up of dependency links, and manual adjustment of dependencies when tasks move on the timeline
- Constraints around sharing with stakeholders
- Very steep learning curve
- Accomplishing basic tasks can be more time-consuming compared to apps with more pre-configured setups
Smartsheet Pricing
- Pro: $12 per Member per month
- Business: $24 per Member per month
- Enterprise: Custom Pricing
Like what you see with Smartsheet but want to see what else is available? Then read up on the best alternatives to Smartsheet.
Smartsheet Ratings and Reviews
- G2: 4.4 out of 5
- Capterra: 4.5 out of 5
Instagantt
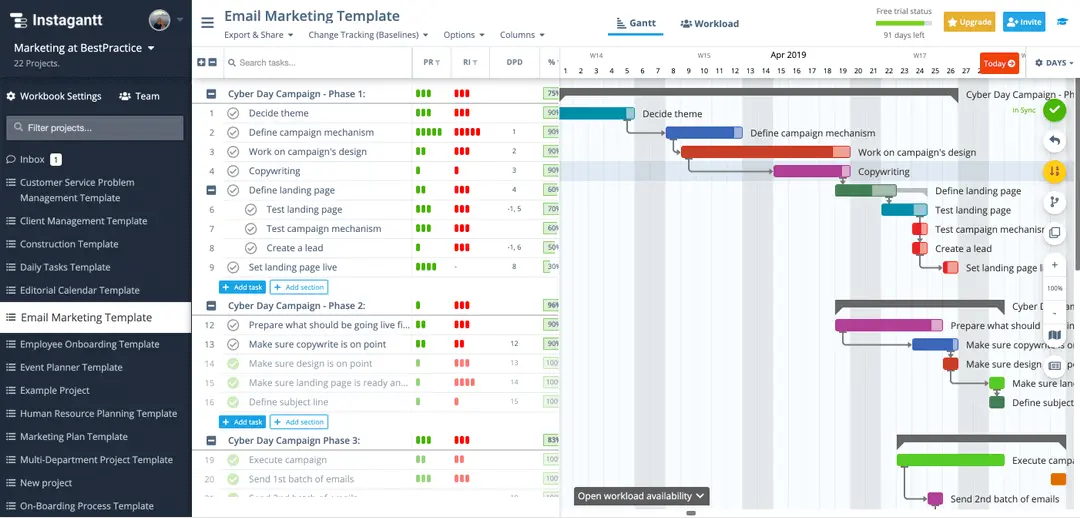
Instagantt is a simple and easy to use Gantt chart tool. You can use it to create Gantt charts using a simple drag and drop interface. Instagantt and Asana are frequently used together, in order to improve on some of the shortcoming’s of Asana’s native Gantt chart functionality.
Instagantt has fairly advanced dependency management functionality, with the ability to:
- Create dependencies between tasks, subtasks, and parent tasks
- Add “lag” and “slack” gaps between dependent tasks
- Define critical tasks and view a critical path
A range of time-saving features are interwoven into Instagantt’s Gantt chart functionality, including:
- Automated task scheduling
- Total hours estimations
- Project templates
- A Workload View and alerts for team overloads to prevent team burnout
Some features (such as Workload Management) are only available on the Team Plan ($24 per month).
In addition to the Gantt chart view, Instagantt has a board view, table view, and Workload View, but these are much more basic than its Gantt chart view.
Instagantt is a well-developed, easy-to-use Gantt chart tool that allows you to create Gantt charts quickly and easily. It is particularly good at helping managers balance workloads and map project dependencies.
Instagantt pros
- Easy to use
- Attractive looking Gantt charts
- Handy features like workload overload alerts and total hours estimation, to improve project management
- Strong dependency management featureset
Instagantt cons
- Rescheduling and dependency automation can be confusing for some users and result in unexpected and unwanted adjustments to projects
- Dependency management cannot be used on integrated projects (e.g. projects from Asana or Jira)
- Limited number of integrations
- Lacks automation features you might expect from project management tools
- Limited task management capabilities
Instagantt pricing
- Individual: $12 per month
- Team: $24 per month
Instagantt Ratings and Reviews
- G2: 4.3 out of 5
- Capterra: 4.3 out of 5
GanttPRO
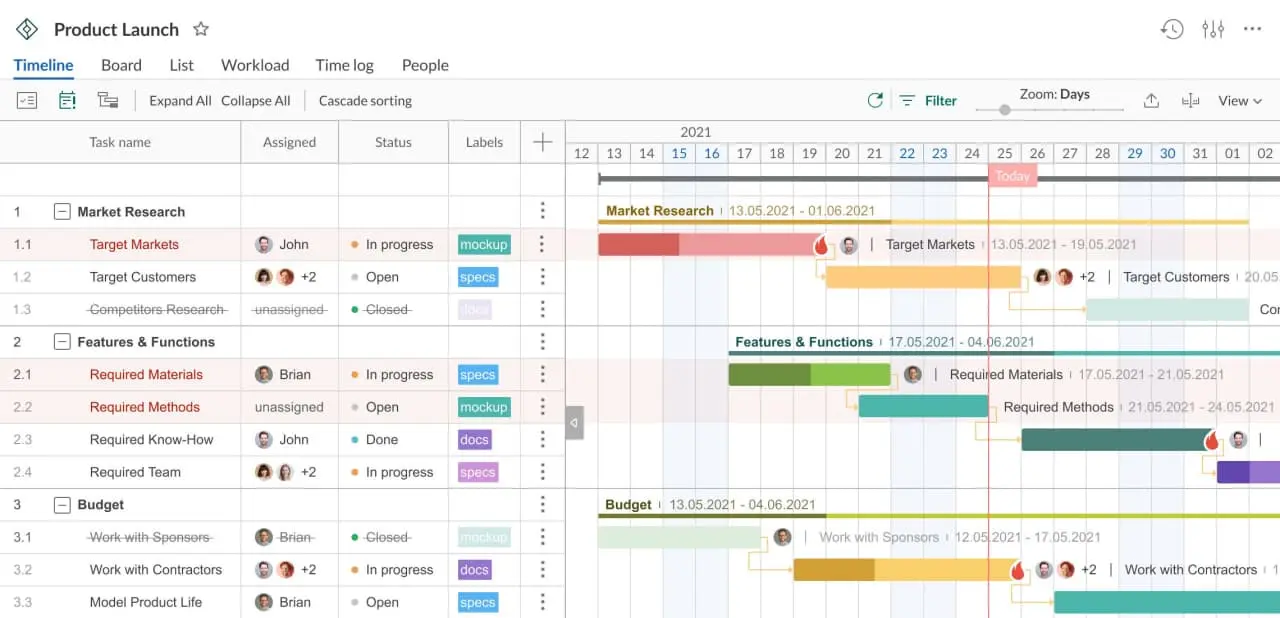
GanttPRO is a high-end Gantt chart tool that includes a wider range of project management features than more basic competitors in the Gantt chart field.
For example, GanttPRO includes features for:
- Time tracking
- Budget and resource management
- Baseline comparisons
GanttPRO can be especially useful for agencies and consultancies who need precise details around capacity, output, and time or budget spent on projects and tasks. That said, GanttPRO lacks some important integrations with invoicing and billing software (such as Xero), which is a real flaw for users who are delivering projects for clients.
Overall, GanttPRO makes it easy to create Gantt charts that provide corresponding reports into budget and resources. However, it does miss some features that could be critical to you, such as the aforementioned integrations with billing software and a lack of robust reporting.
GanttPRO Pros
- Strong resource management functionality
- Good time and task tracking features
- Robust collaboration features (such as task commenting and notifications)
- Wide range of templates to get started with
GanttPRO Cons
- Can feel complex and will be a steep learning curve for most users
- Limited number of reports and dashboard (and no custom reports or dashboards)
- Lacks integrations with billing and invoicing software
GanttPRO Pricing
- Basic: $7.99/month per user
- Pro: $12.99/month per user
- Business: $19.99/month per user
- Enterprise: Contact for pricing
GanttPRO Ratings and Reviews
- G2: 4.3 out of 5
- Capterra: 4.2 out of 5
Wrike
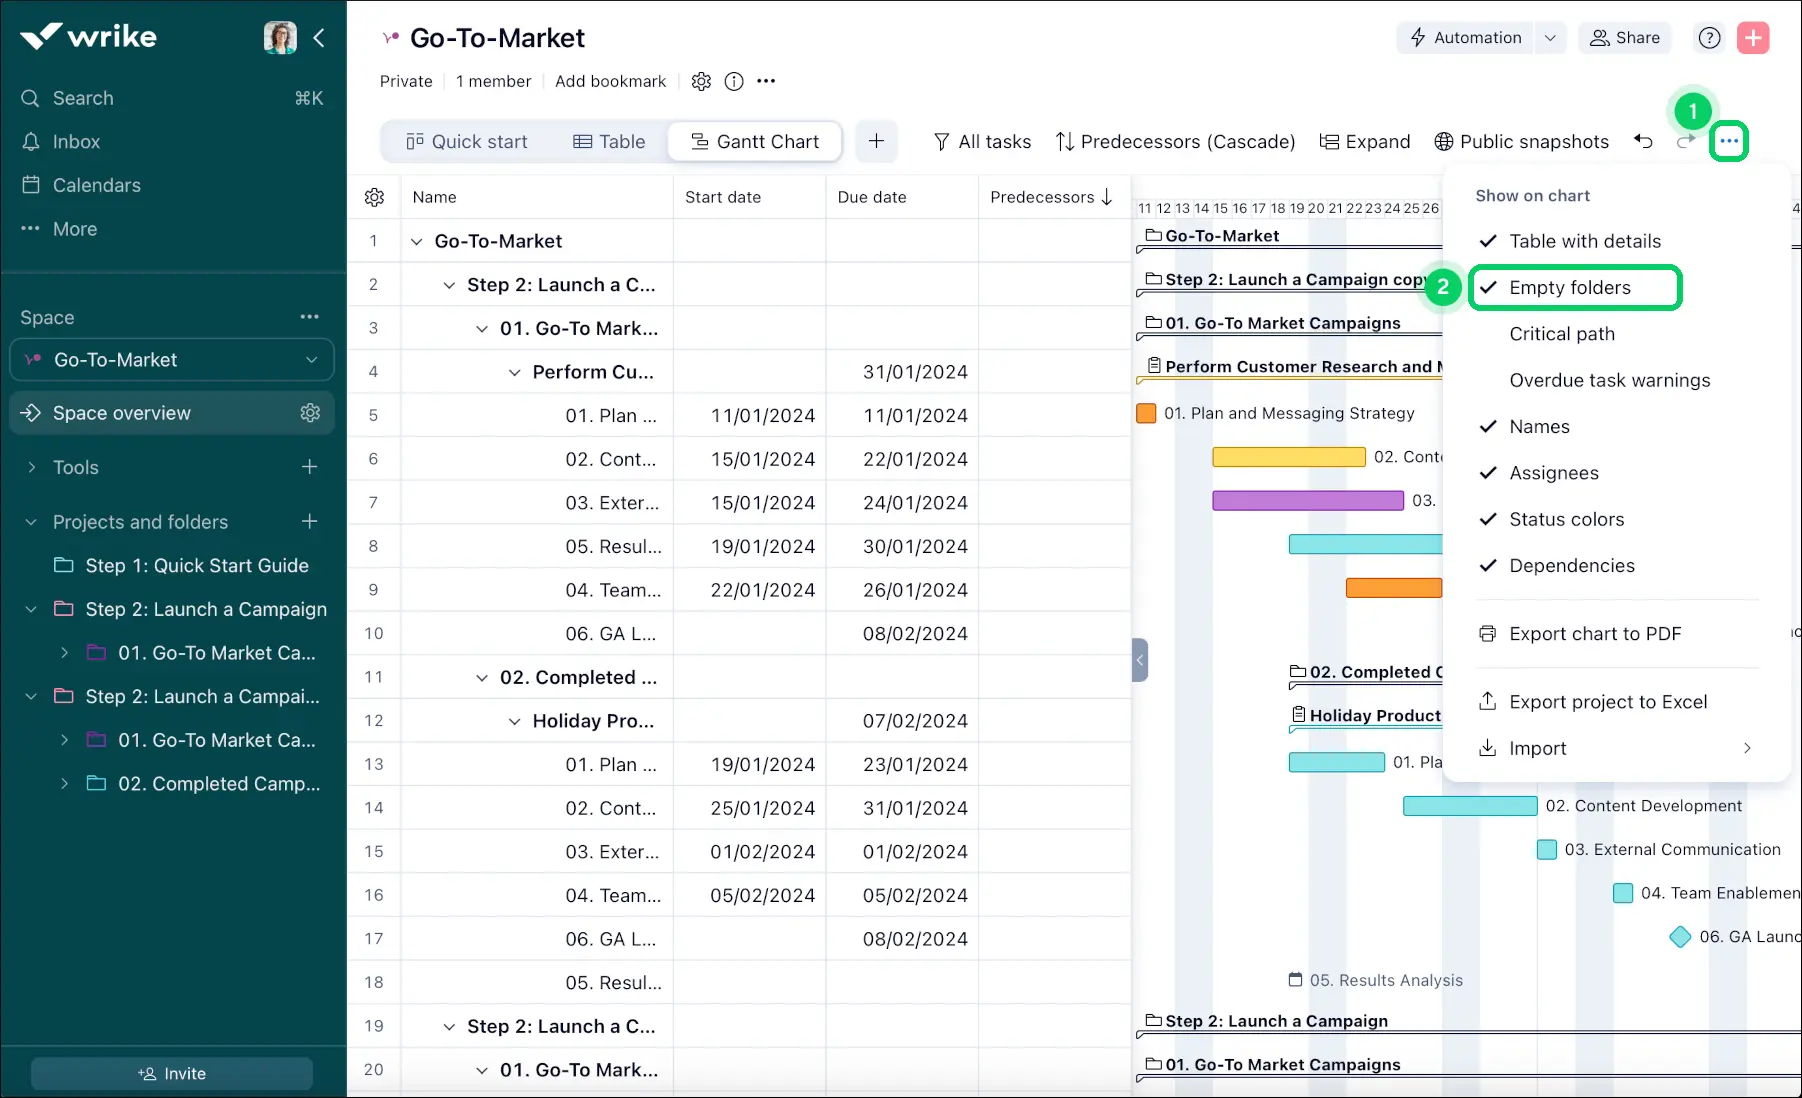
Wrike is a powerful project management platform that offers a high degree of flexibility and customization and some advanced capabilities in:
- Project risk modelling
- Project workflow management
- AI task prioritization
- AI-assisted resource allocation
Wrike’s Gantt charts look very attractive, and give you a neat way of visualizing your projects, with the dependencies and milestones you would expect to find in any robust Gantt chart software.
Although Gantt charts are not Wrike’s star attraction, and lack some of the functionality you’ll find in a more specialized Gantt chart solution, they do benefit from Wrike’s general project management time savers and intelligence features.
So if you’re looking for a more advanced project management tool than TeamGantt, while retaining attractive and easily customizable Gantt charts, then Wrike is well worth a try.
Wrike Pros
- Advanced project management functionality
- Wide range of view types and reports
- Pre-built workflows for stakeholder approval and client management processes
- Visualize multiple projects on a single Gantt chart
Wrike Cons
- Gantt charts lack the depth of specialized Gantt chart software
- Expensive, especially for smaller teams
- Resource and capacity planning is only available in the Business plan ($24.80 per user per month)
Wrike Pricing
- Team: $10 per user per month
- Business: $24.80 per user per month
- Enterprise: Custom pricing
Wrike Ratings and Reviews
- G2: 4.4 out of 5
- Capterra: 4.5 out of 5
Gantter
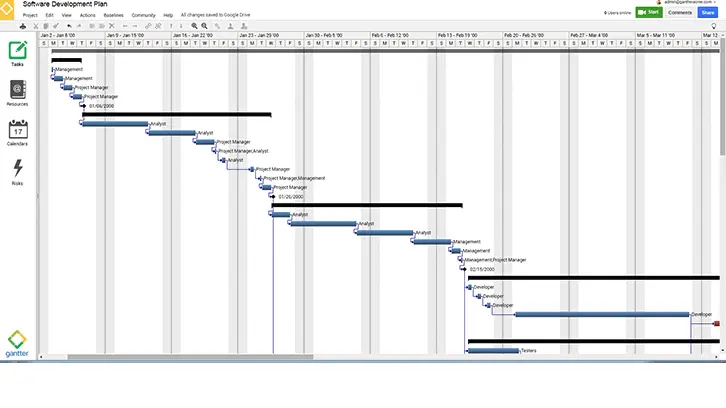
Gantter is a robust, if a little outdated project management tool, which as the name suggests is as focused on Gantt charts as TeamGantt is.
Gantter’s ability to seamlessly open Microsoft Project files has made it a popular choice for project managers who are seeking to transition away from MS Project.
To many project managers Gantter can feel like a little simpler version of MS Project, that retains much of the functionality without some of the more advanced features that most PMs won’t use regularly.
Gantter includes all the key components of a dedicated Gantt chart tool, like robust hierarchization of tasks, baselines, milestones, and simple reports into resources and time tracking.
The Gantt charts do look dated, and Gantter lacks some of the more advanced features you’ll find in other tools. But at $5 a month, that’s understandable.
Gantter Name pros
- Compatibility with MS Project files and GSuite integration
- Low cost
- Auto-generated work breakdowns
- Useful tools for baseline comparisons and cost tracking
Gantter Name cons
- Gantt charts look dated and basic
- Limited integrations (outside of GSuite)
- Very limited customization options (even as far as custom color coding)
- Lacks other view types to compliment Gantt charts
Gantter Pricing
- Gantter Cloud: $5 per user per month
- Gantter for Google Drive: $5 per user per month
- Gantter for Google Workspace: $5 per user per month
Gantter ratings and reviews
- G2: 4.5 out of 5
- Capterra: 4.1 out of 5
OpenProject
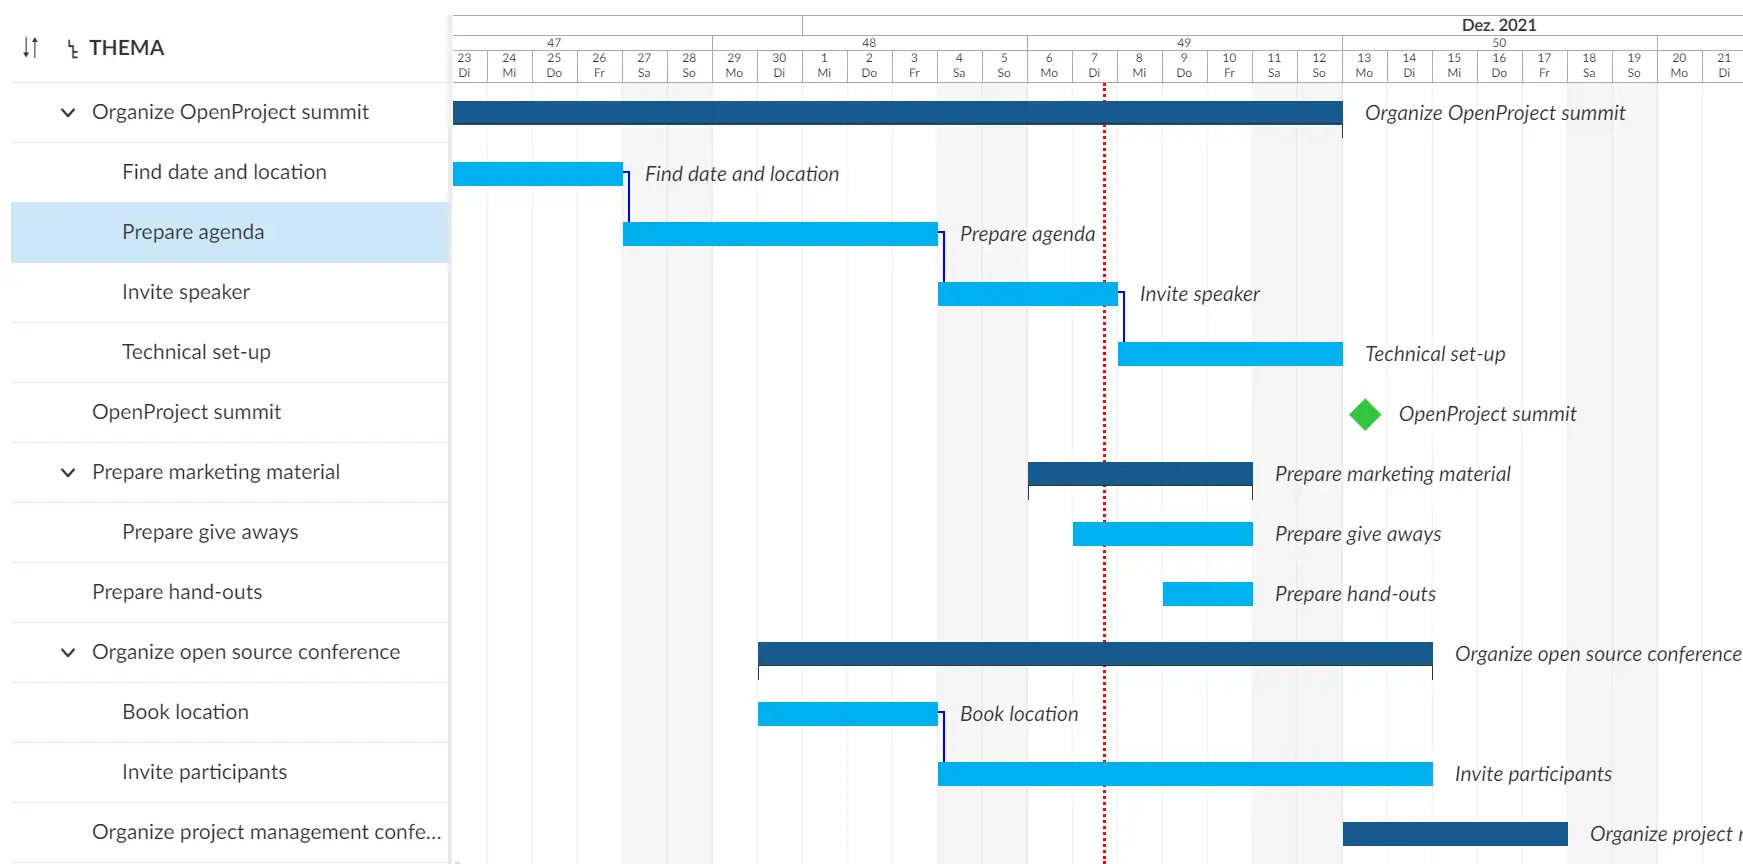
OpenProject is another open-source project management tool with a range of view types (including Gantt charts) that are suitable for different teams, whether using Agile, Waterfall, or other methodologies.
Gantt charts in OpenProject were overhauled in February 2024, opening up more opportunities for users to customize them, apply more complex filters, and share their Gantt charts with stakeholders.
Dependencies in Gantt charts and other relationships like milestones are managed in a very systematic way. This ensures consistency across projects but can feel constraining for teams that need more flexibility.
OpenProject has a staunch base of advocates who find it perfectly fits their preferred working styles. It is an acquired taste, and acquiring that taste may take some users a while. It has a fairly steep learning curve, with lots of terms and concepts you’ll need to understand before being able to use it effectively.
OpenProject Pros
- Low cost, with all “Enterprise add-ons” included in their Basic plan
- Robust handling of dependencies and other relationships in Gantt charts
- Supports basic portfolio management (PPM)
- Handy scheduling tools to help identify capacity and avoid scheduling conflicts or resource shortages on projects
OpenProject Cons
- Gantt charts look outdated
- Lack of integrations
- Steep learning curve and the older style UI can feel unintuitive
OpenProject Pricing
- Free Forever
- Basic: $7.25 per user per month
- Professional: $13.50 per user per month
- Premium: $19.50 per user per month
- Corporate: Contact for pricing
OpenProject ratings and reviews
- G2: 3.7 out of 5
- Capterra: 4.5 out of 5
Microsoft Project
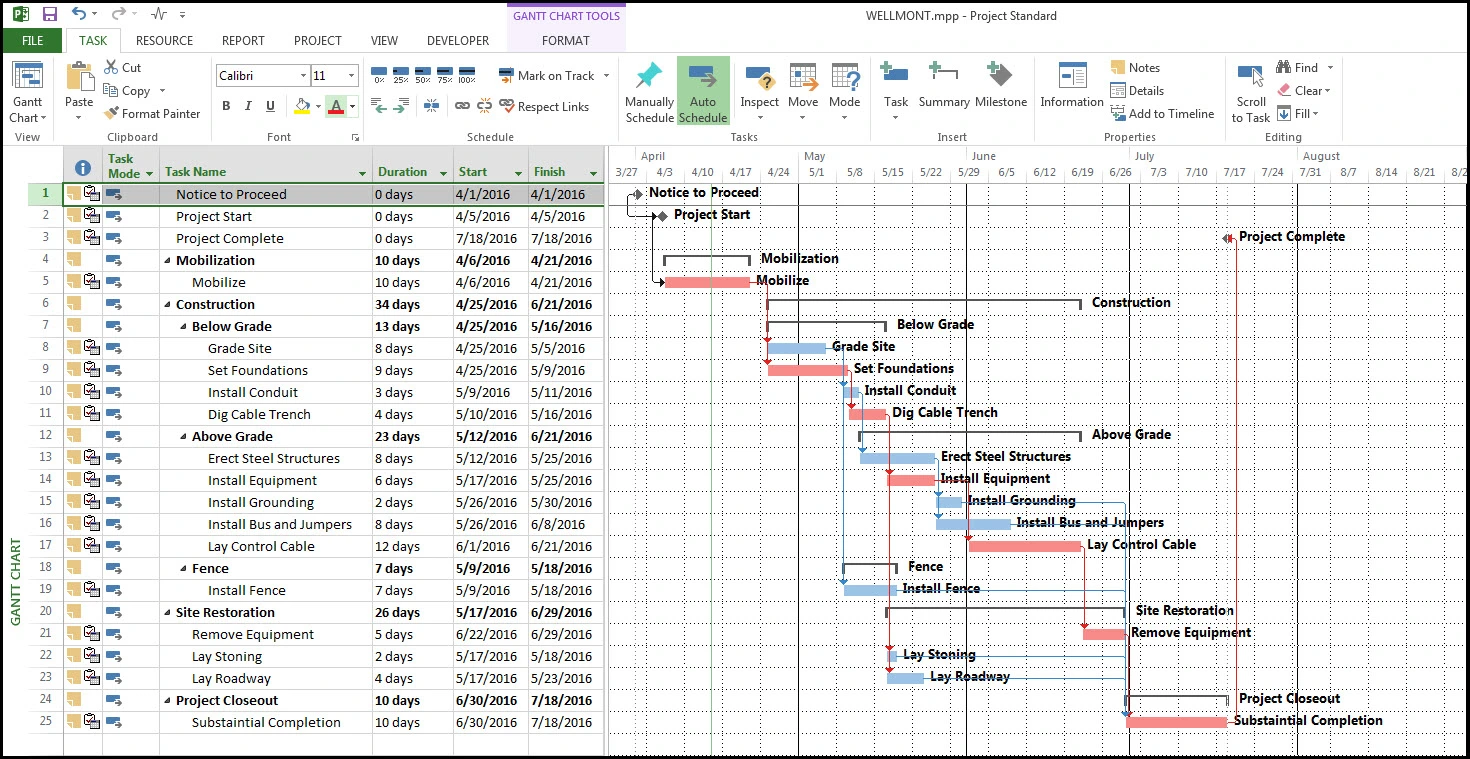
Microsoft Project is one of the most comprehensive project management systems available.
Microsoft Project is favored by project managers who need a tool capable of handling the most complex projects. It is less loved by those who need something quick to learn, easy to use, and flexible enough to adapt to their fluid ways of working.
MS Project has a huge and advanced feature set, including:
- Resource allocation and resource pooling (management of resources across multiple projects)
- Project risk modeling and assessment
- Dynamic scheduling
- Project portfolio road mapping
- Wide set of pre-built reports and dashboards
MS Project has a wealth of tools that are best suited to larger organizations, especially those with a sophisticated approach to project portfolio management (PPM).
Small to mid-size organizations will probably find MS Project overly complex, and a drag on performance, and would get better results with a more flexible PPM tool like Visor.
MS Project is a powerful tool with an array of advanced features to help manage complex projects. However, small—and mid-sized organizations may find it more of a burden and overly complicated for their needs.
Microsoft Project Pros
- Robust Gantt charts, with strong dependency, critical path, and resource management
- Advanced reporting capabilities, with the ability to create bespoke, detailed project reports
- Integrates seamlessly with other Microsoft products (great for Microsoft powered organizations)
- High-end portfolio management functionality to track multiple projects and balance resources across them
Microsoft Project Cons
- Expensive
- Very steep learning curve
- Unnecessary complex for simpler projects, smaller teams, or smaller project portfolios.
- Gantt charts and other view types look very outdated, especially compared to modern tools like Visor
Microsoft Project Pricing
Cloud:
- Plan 1: $10 per user per month
- Plan 3: $30 per user per month
- Plan 5: $55 per user per month
On premise:
- Standard: $679.99 per license
- Professional: $1,129.99 per license
Microsoft Project Ratings and Reviews
- G2: 4.0 out of 5
- Capterra: 4.4 out of 5
Teamwork
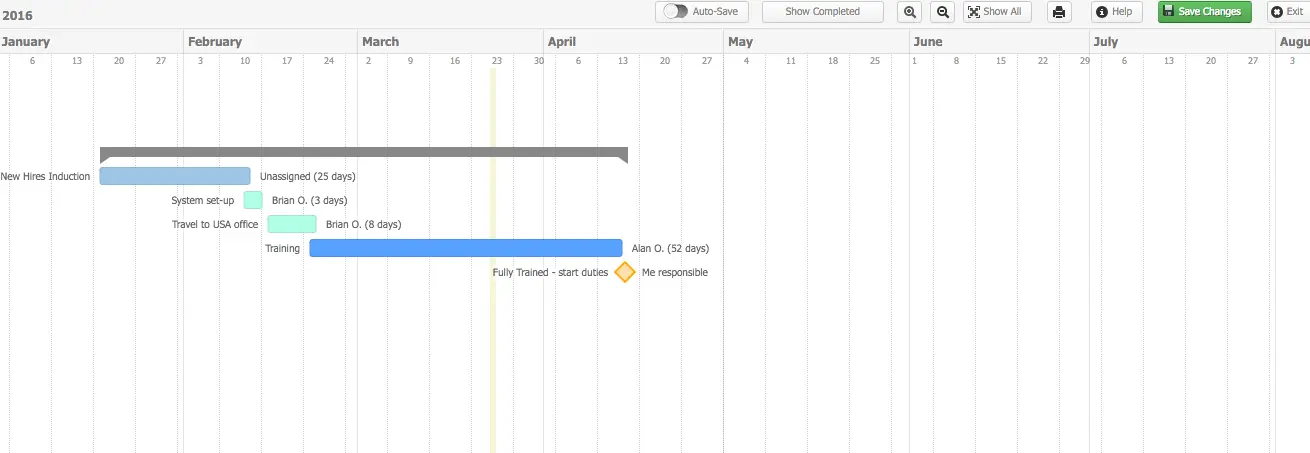
Teamwork is a project management system that is geared towards managing projects that are directly client facing, think of design agencies, consultancies, and so on.
It integrates time-tracking, client onboarding, resource management, invoicing, and project planning into an all-in-one system.
Teamwork’s Gantt charts are not as advanced as what you’ll get with MS Project, or even TeamGantt, but if you’re working in client services you may find Teamwork’s all-in-one client management system is well worth discarding some higher-end Gantt chart functionality.
Teamwork Pros
- All-in-one system for client facing work management
- Wide range of project templates for Gantt charts and other view types
- Robust resource and workload management features
- Very strong built-in time tracking functionality
Teamwork Cons
- Less suitable for project portfolio management (viewing and managing multiple projects)
- Hierarchies are limited to project, task, subtask, checklist and are not customizable
- Limited customization options
- Can feel very prescriptive and rigid, compared with more flexible apps
Teamwork Pricing
- Deliver: $10.99 per user per month
- Grow: $19.99 per user per month
- Scale: $54.99 per user per month
- Enterprise: Custom pricing
Teamwork Ratings and Reviews
- G2: 4.4 out of 5
- Capterra: 4.5 out of 5
ProofHub
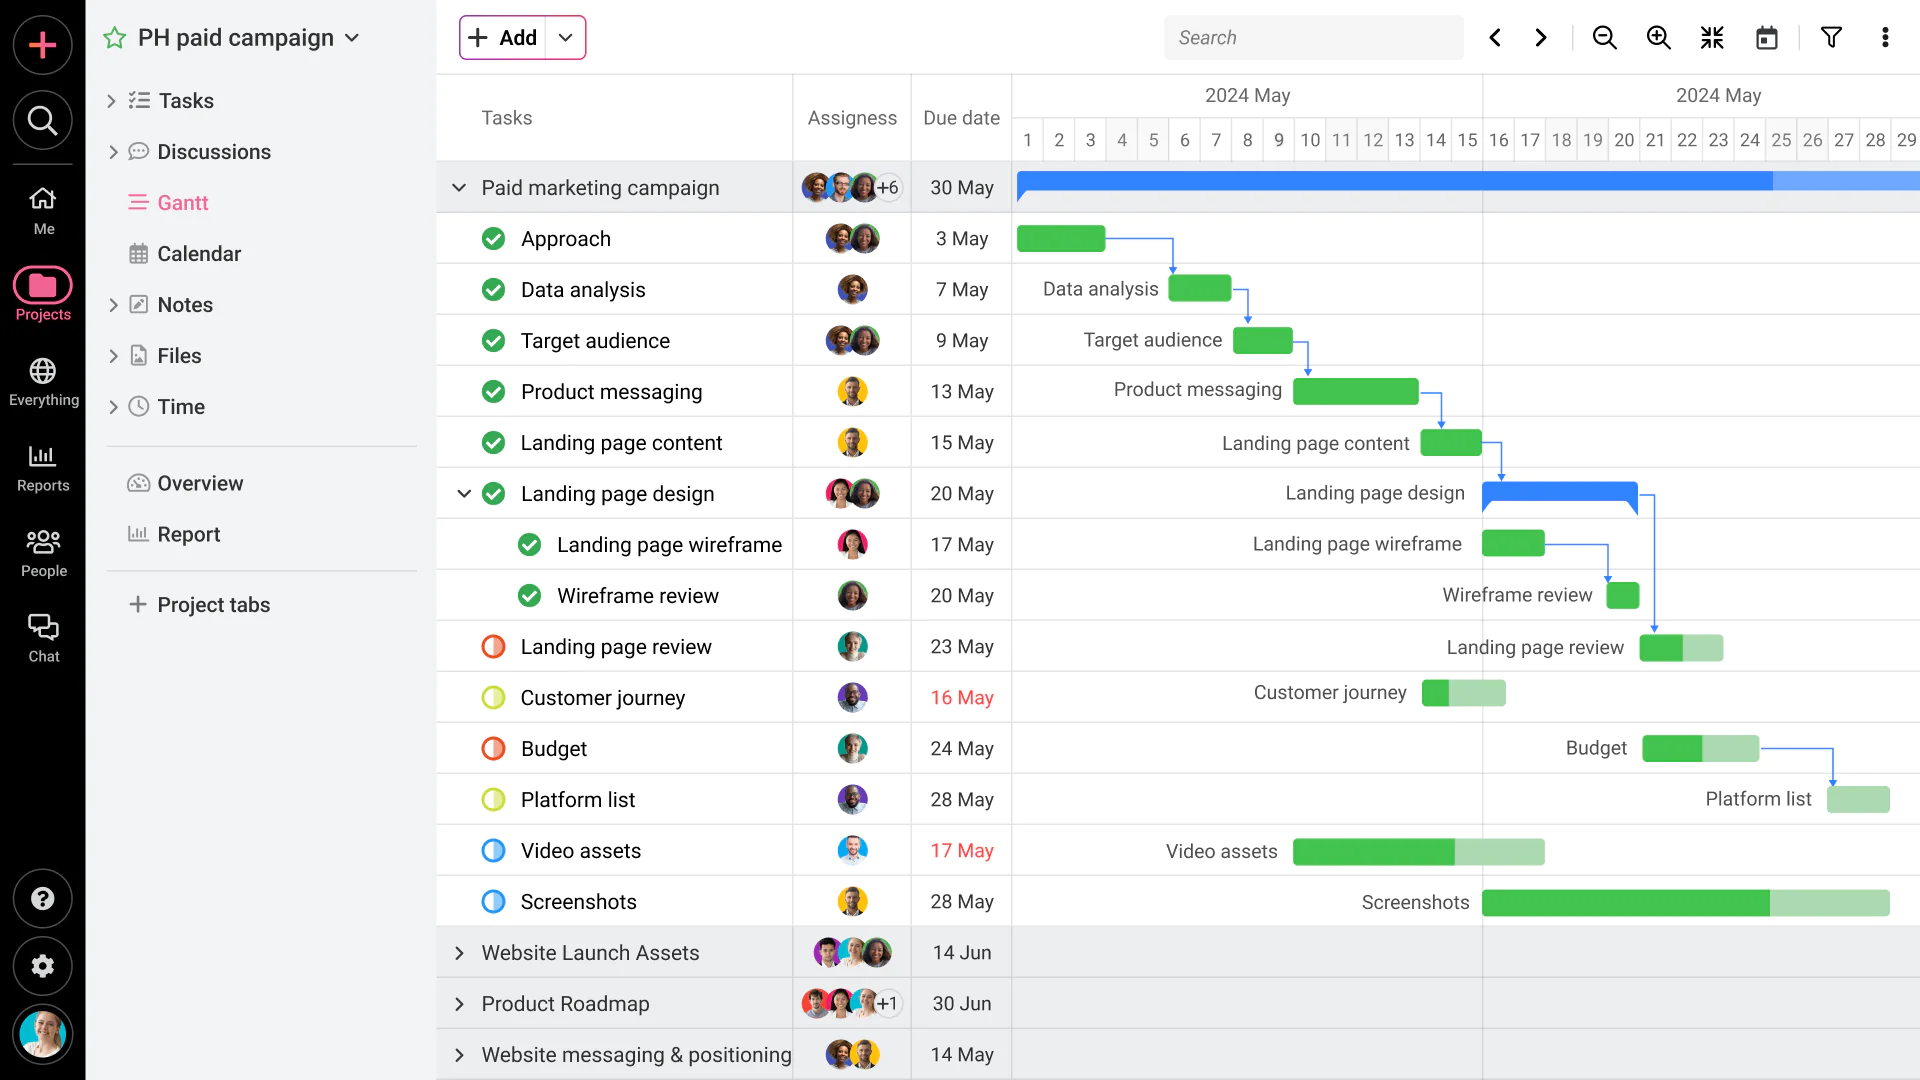
ProofHub is a project management tool with a heavy focus on improving communication, to make collaboration easier and reducing risks around missed and dropped information.
Gantt charts in ProofHub are easy to build and adjust. There’s an emphasis on simplicity, with dependencies and milestones being both easy to add and configure.
Proofhub combines multiple project views (Gantts, Kanban boards, and a table view), with a range of collaboration and direct communication methods you won’t find in many project management tools, including:
- Live chat on projects
- Discussion boards
- Shared notes
If you felt TeamGantt’s lack of built-in communication features was causing problems in your projects then ProofHub might be a better fit for you. With its emphasis on bringing everyone together, and centralizing information, it’s a great fit for creative agencies and other client service teams.
ProofHub Pros
- Centralizes all communication to improve collaboration and accountability
- Easy to build Gantt charts
- User friendly and intuitive – Apple fans will find it very familiar
- Strong time tracking functionality to help manage resources and workload
ProofHub Cons
- Customizations are fairly surface level, more how certain views look than how they can be used
- Comparatively expensive, with some key functionality (such as workflows) excluded form their $40 a month “Essential” plan
- Very basic reporting and dashboards
- Lacks integrations with other popular apps
ProofHub Pricing
- Essential: $50 per month (flat fee)
- Ultimate Control: $99 per month (flat fee)
ProofHub Ratings and Reviews
- G2: 4.6 out of 5
- Capterra: 4.6 out of 5
TeamGantt Alternatives: Your Best Option
There’s an abundance of choices out there to plan, manage, and visualize your projects and portfolios.
If you want a tool with a superb Gantt chart maker and a range of other view types that are as crystal clear as impressive, then you should try Visor.
Visor not only enables you to create superb project plans easily, it also allows you to easily take a portfolio level view of all your projects, so that you can do project portfolio management without the need for an overly complex and costly PPM tool.
If you or your colleagues use Jira and need to create better Jira Gantt charts, then you can use Visor’s two-way Jira integration to do this easily. Or if you want to visualize Salesforce data with data from project management apps, you can connect Visor to Salesforce and create Salesforce Gantt charts too.
Visor is a flexible, modern tool to create beautiful, crystal clear Gantt charts and other project visualizations easily. With Visor you can take your project management game to the next level and start doing project portfolio management easily too. Get started with your free trial of Visor now.
Gantt chart in Visor using multiple epics from Jira
