Instagantt and Asana: How, Why, and Alternatives

Start using Visor today
- Visualize all your projects and data

- Roll up multiple projects into portfolio views
- Try Visor for FREE
Instagantt and Asana are two apps that are regularly used together to enhance people’s abilities to create more sophisticated Gantt charts than is possible in Asana’s native Gantt chart tool.
However, Instagantt is not the only app with powerful Gantt chart capabilities and a two-way integration with Asana. New movers like Visor are providing Asana users with features and functionality that fill gaps left not only by Asana, but by Instagantt too.
With new options available, it’s essential that Asana users get up to date with how tools like Instagantt, Asana, and Visor differ, and can work together, in order to select the best tools for them.
Read on to learn how to use Asana and Instagantt together, why people using Asana might need to enhance it with tools like Instagantt, what the strengths and limitations are of Instagantt when used with Asana, and alternative options for creating better Asana Gantt charts, which might prove to be better for you than Instagantt too.
Why Do Asana Users Use Instagantt
People use Instagantt with Asana primarily to improve upon the native Asana Gantt chart functionality or to avoid upgrading to an Asana plan that includes Gantt charts.
Enhanced Gantt Chart Functionality
Asana’s native Gantt chart functionality has some significant limitations which motivates users to find a more powerful Gantt chart app that has a bi-directional integration with Asana (such as Visor or Instagantt).
Here are the key areas of weakness or gaps in Asana’s native Gantt charts that cause users to use apps like Instagantt:
- Portfolio Gantt charts
- Time and cost tracking functionality
- Sharing and collaboration
- Cost of Asana Gantt charts
Read more about these limitations below and how pairing an app like Visor or Instagantt with Asana addresses them.
Portfolio Gantt Charts
You cannot create portfolio Gantt charts (meaning Gantt charts with multiple projects) in Asana, even if you upgrade to unlock Asana’s portfolio feature set (which costs $30.49 per month per user if billed monthly, or $24.99 per month per user if billed annually).
Without portfolio Gantt charts, your ability to do even basic project portfolio management (PPM) will be restricted and will make typical PPM processes convoluted and longwinded.
You can create a portfolio timeline view in Asana, but this lacks crucial Gantt chart features, including:
- Gantt Chart Columns (to provide additional task/project information, e.g., status, priority, budget), etc.)
- Gantt Chart Dependencies
- Gantt Chart Milestones
- Flexible Nesting (The ability to expand collapse projects to show their tasks)
Being able to create portfolio Gantt charts is one key reason why Asana users also use apps like Instagantt or Visor. You can even create Gantt charts or roadmaps that just display all your Asana projects’ milestones, to get a high-level view of the crucial tasks across your program or portfolio.
Both Visor and Instagantt have two-way integrations with Asana, so you can create full-spec portfolio Gantt charts using live Asana project data. This makes it much easier to:
- Manage multiple projects
- Balance resources and capacity
- Unblock blocking tasks and identify delaying tasks
- Quickly go from high-level to detailed views to uncover and tackle causes of delays, overspend, or other critical project management issues
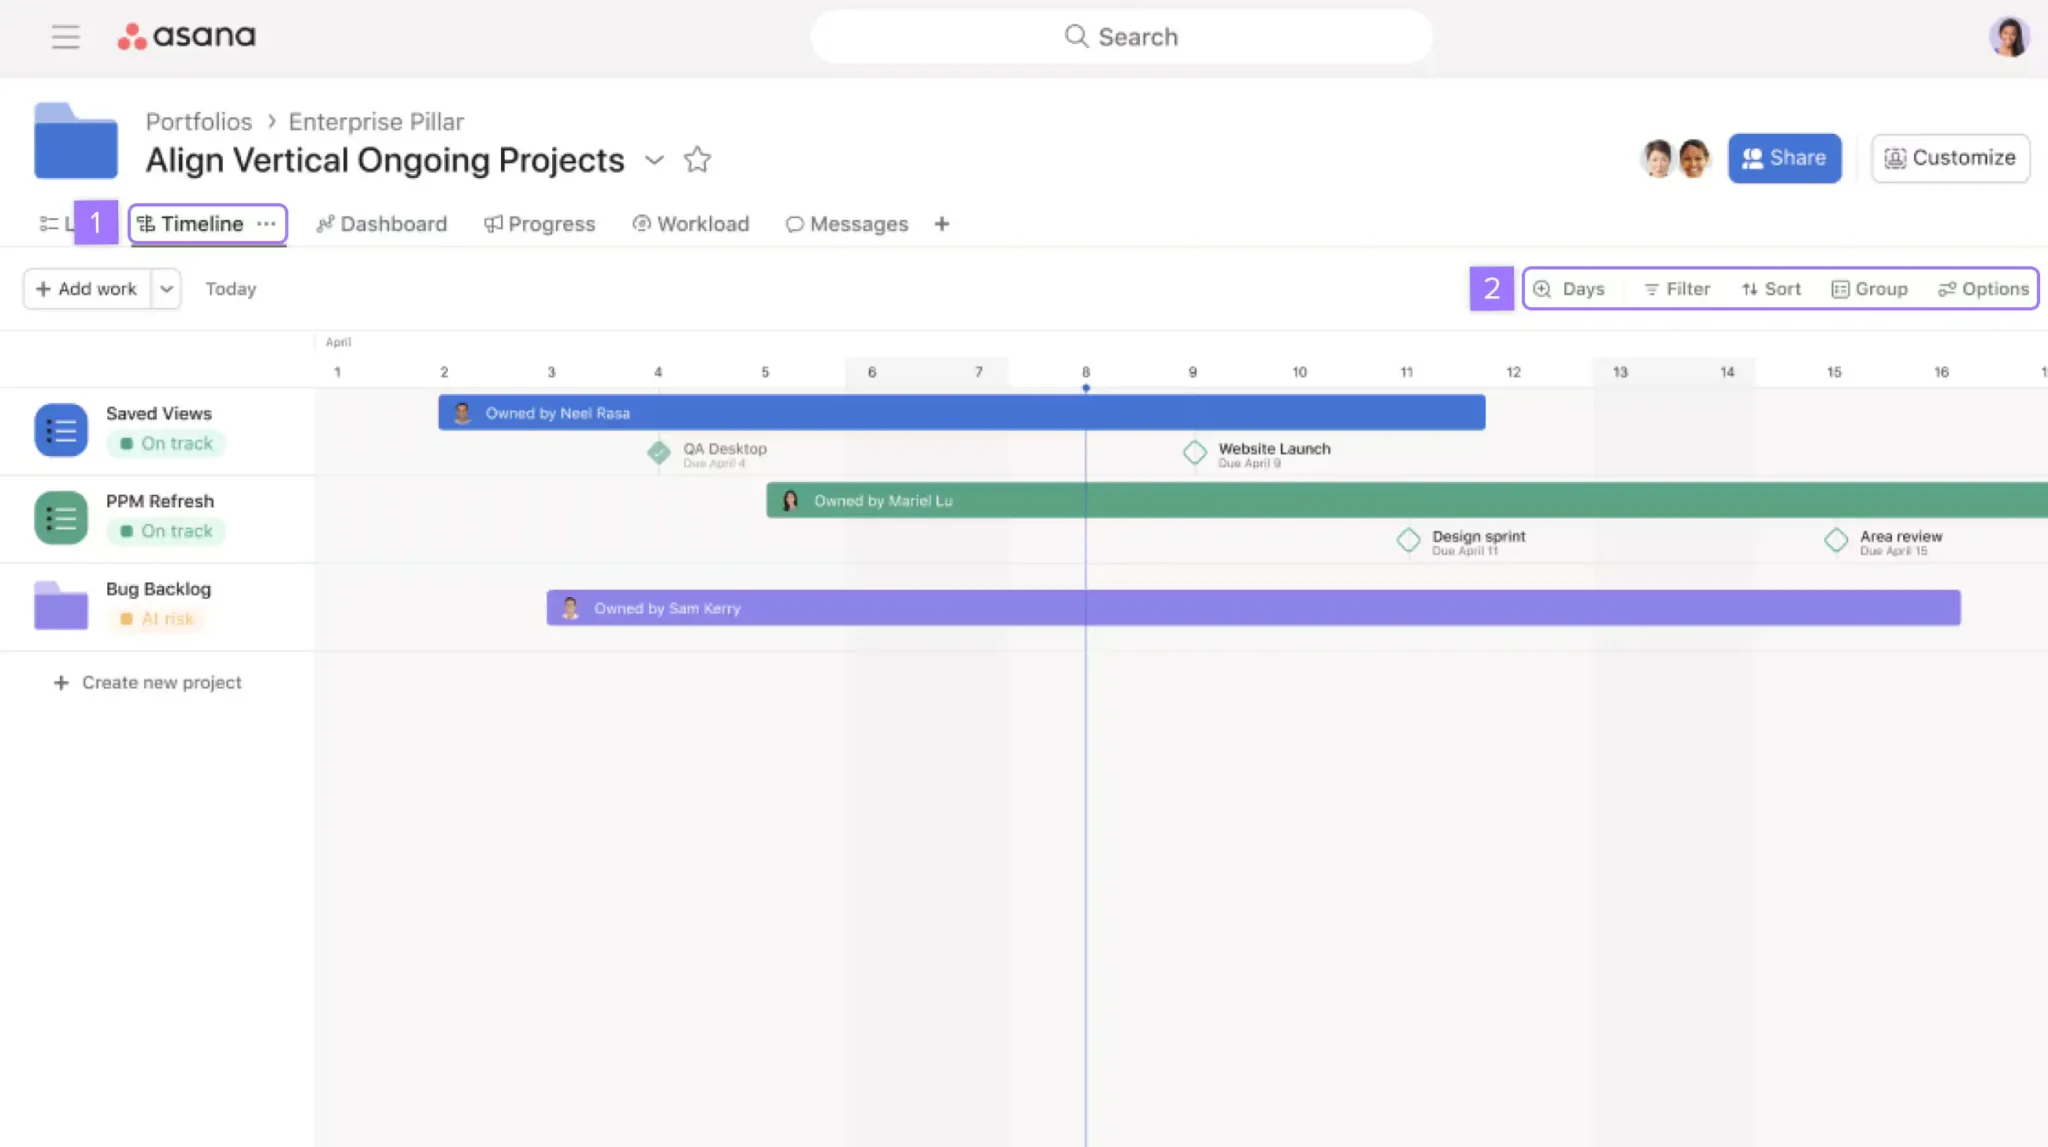
Here’s an example of a portfolio timeline in Asana:
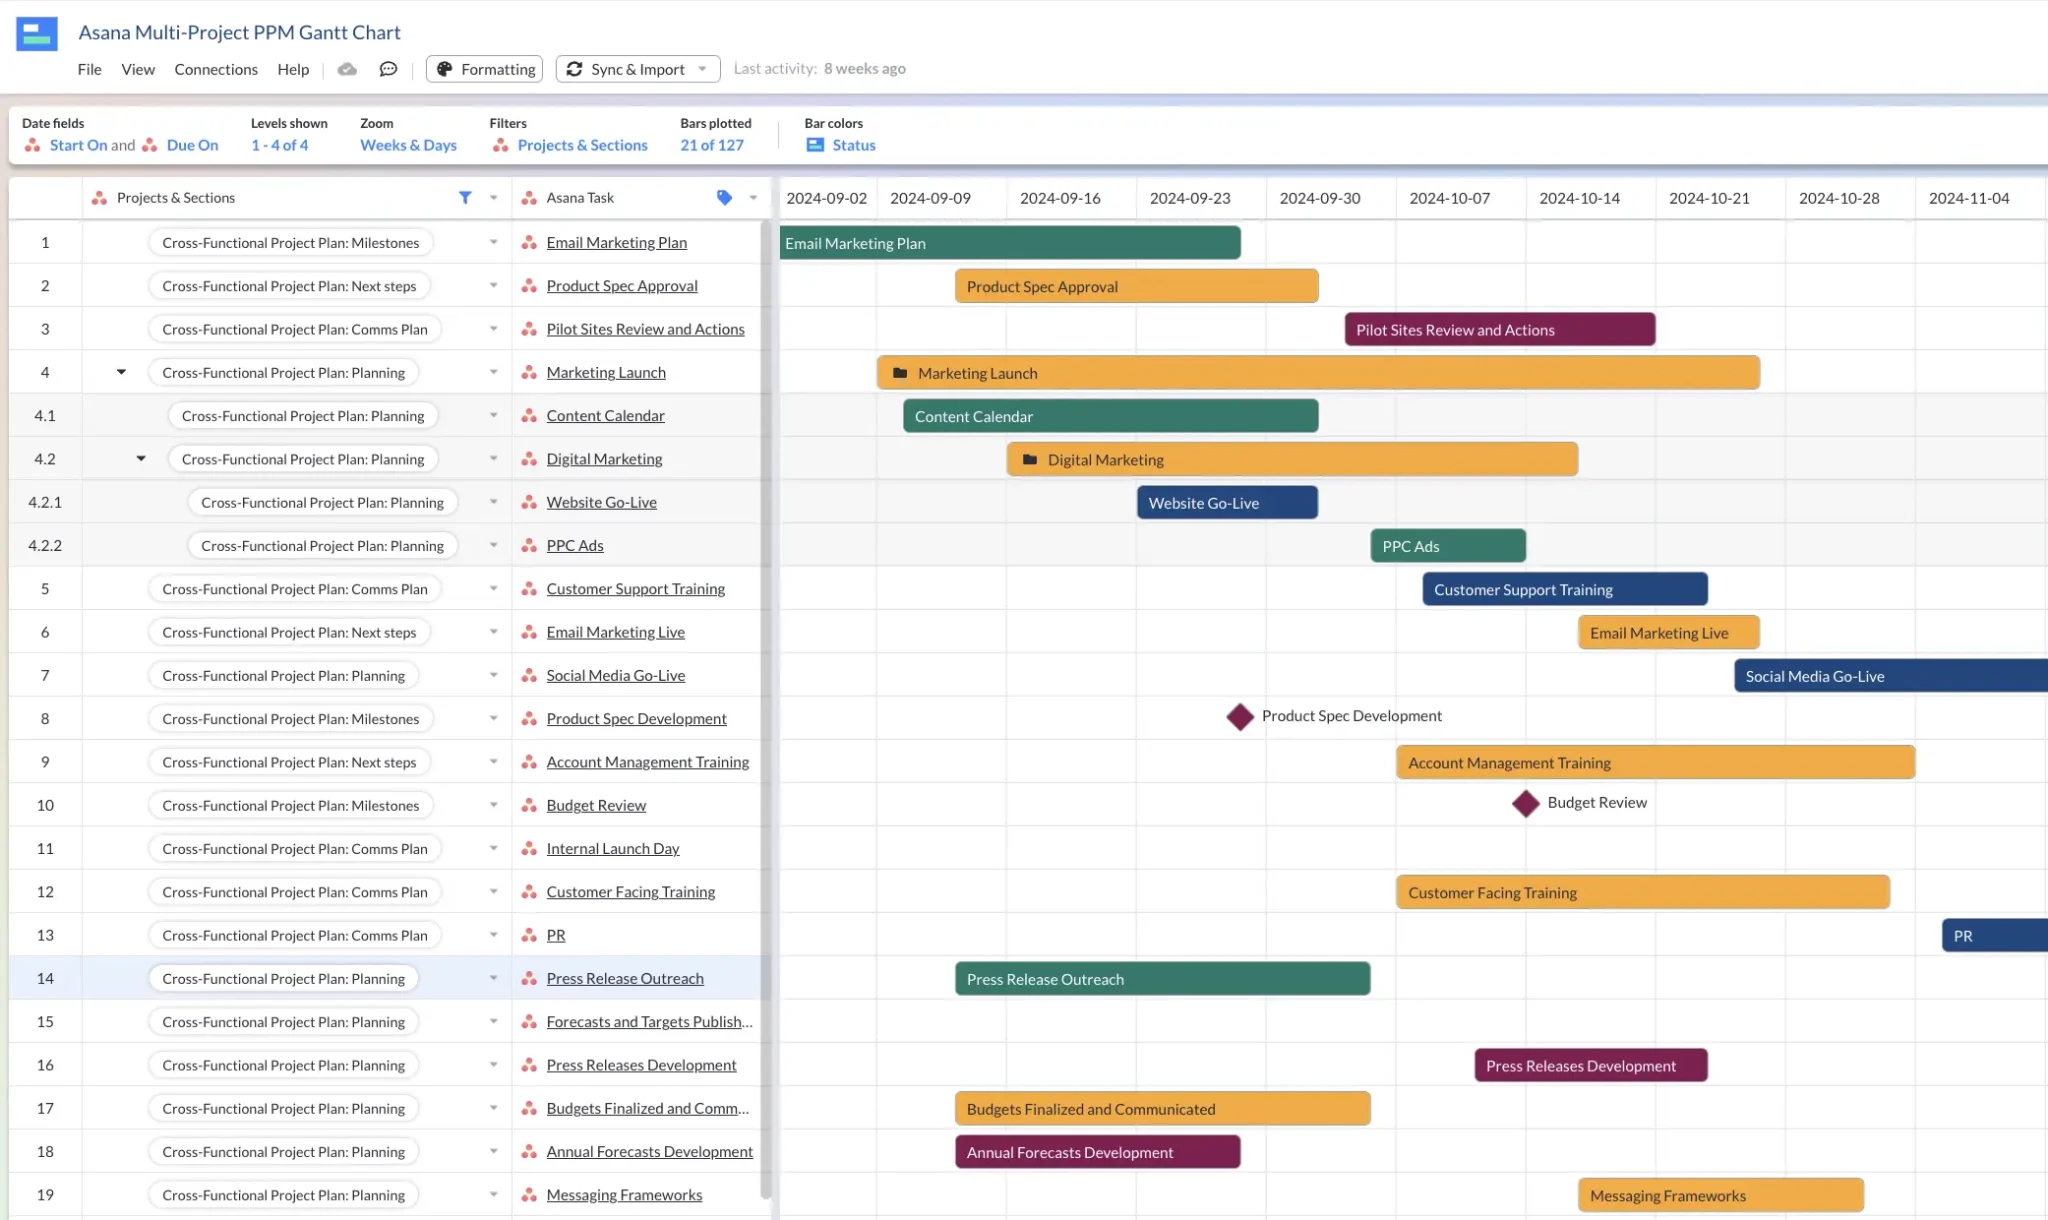
Compare this to a portfolio Gantt chart in Visor:
Time and Cost Tracking Features
Asana doesn’t include the time tracking and budget management functionality that many users require, especially those delivering projects for clients or in-house agency-style teams.
This is why time and budget or cost tracking apps are among the most widely used Asana integrations for project management.
Instagantt includes features for workload management, cost control, time tracking, and related reporting, all connected seamlessly with its Gantt charts.
Many Asana users prefer this combined approach instead of using Asana’s native Gantt charts with apps or plugins for time tracking, cost management, and related reporting features.
Sharing and Collaboration
You cannot create a “public” view-only sharing link for Gantt charts created natively in Asana.
You can create what Asana calls “Read-only links” for other view types, but not Gantt charts.
This means you can’t share views of your Gantt charts with users outside of your organization, or with users in your organization that don’t have a paid Asana license.
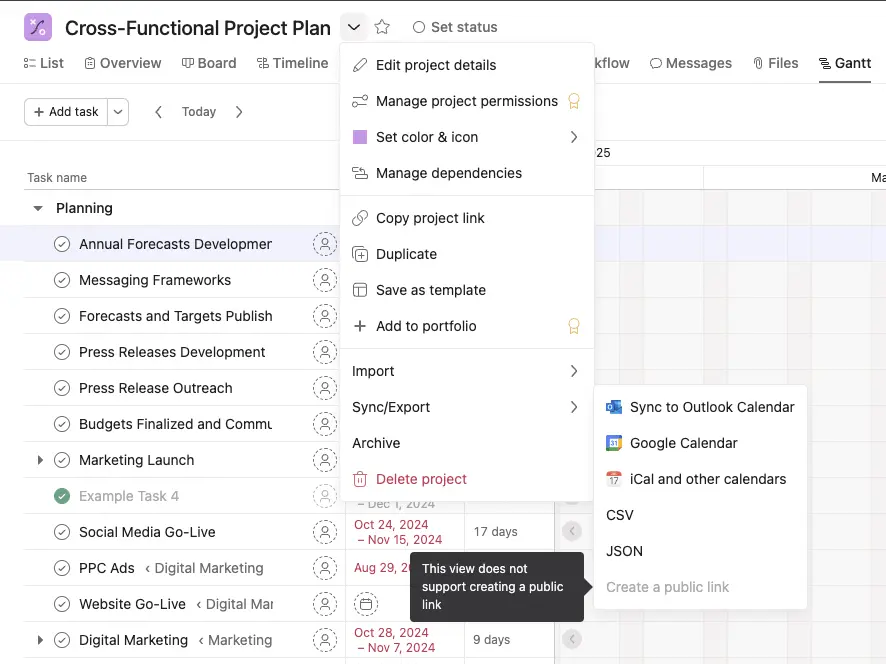
You can always take a screenshot or export a CSV/JSON, but any of these options will give your clients, team members, or stakeholders a view of your Gantt that becomes immediately out-of-date the moment anything changes in your project after you’ve exported.
As you’ll immediately realize, using CSV or JSON exports will cause big problems. It can create tons of additional admin work as you need to keep sending fresh exports, fielding redundant questions, and try to keep everyone on the same page.
Sharing Gantt Charts With Instagantt
Instagantt enables you to share “Public Snapshots” of your Gantt charts which don’t require login information. While this is an improvement on Asana’s Gantt chart sharing options, these snapshots will still become out of date as soon as something changes in your project.
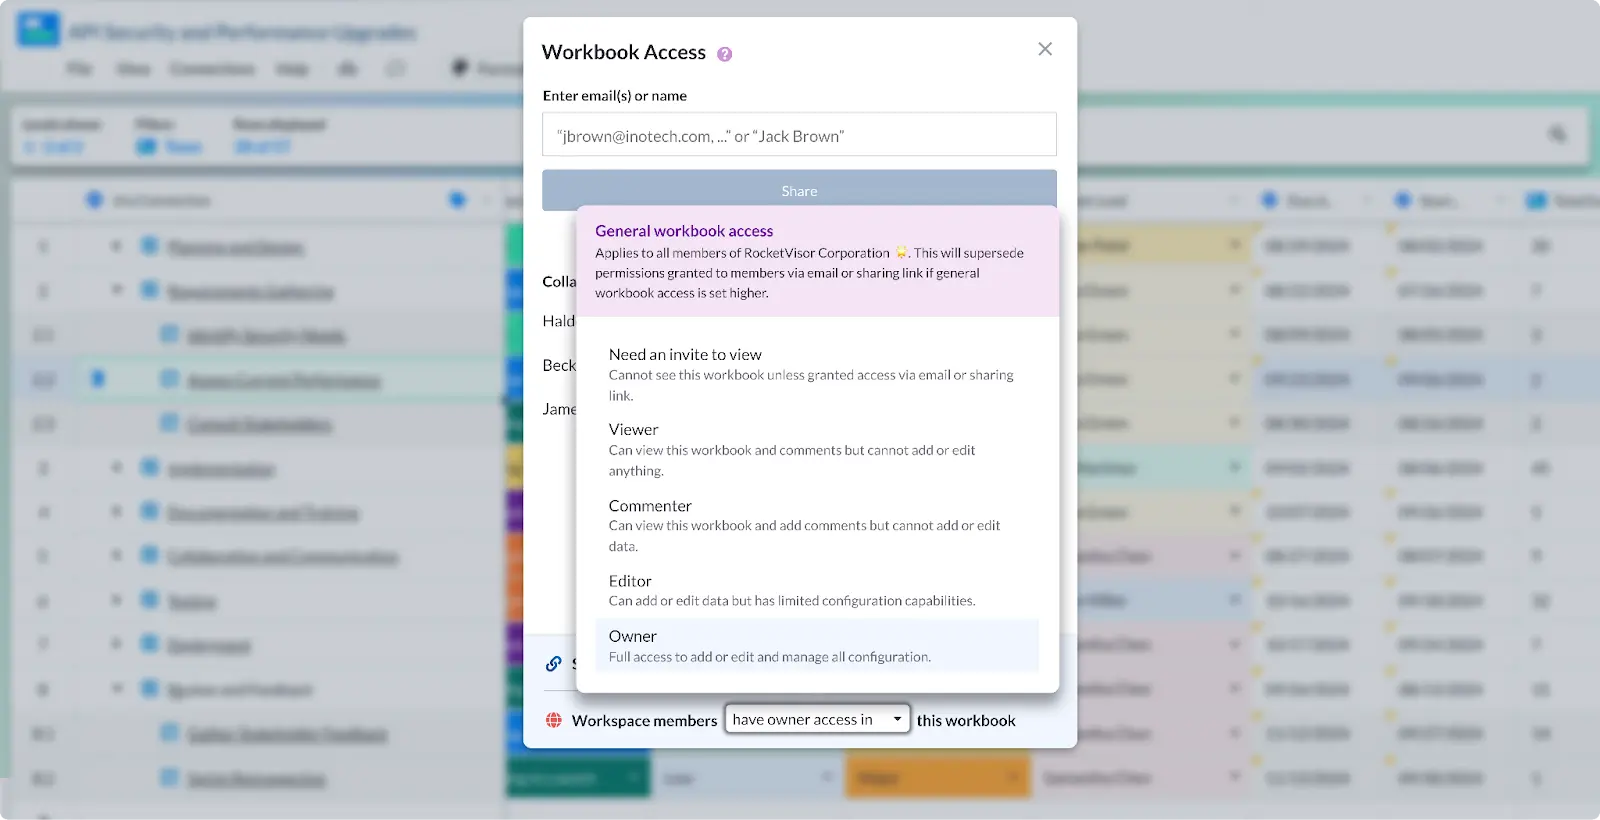
Sharing Gantt Charts With Visor
Visor allows you to share real-time views of your Gantt charts with anyone, and you have a range of controls to modify the information different users, or user groups see. You can also invite colleagues, clients, or other stakeholders directly by email.
Visor sharing links enable you to share a curated view of your Gantt chart that stays up-to-date with any changes in your project, improving the experience for your stakeholders and preventing any additional admin for you.
Cost of Asana Gantt Charts
Gantt charts are not included in the Asana free plan.
Asana users who want to use Gantt charts are faced with upgrading to the Asana Starter plan, which costs $13.49 per user per month or $10.99 per user per month if you pay annually upfront.
This can prove very costly as the fee is charged per user, so if you have lots of users in your Asana instance, but only a small proportion who want Gantt charts, then it is very uneconomical.
That’s another reason why many users on the Asana Free plan who just want to add Gantt charts decide to pay for a smaller number of licenses for an Asana integrated Gantt chart app like Instagantt or Visor, as it can save them substantial sums of money, and give them much better Gantt chart functionality than the native Asana Gantt offering.
Can I use MS Excel or Google Sheets Instead of Instagantt or Visor?
If you were really desperate you could export your Asana data into Excel to create a Gantt chart there. I would really not recommend this though. The first reason why it’s a bad idea to export your data into an app like Excel or Google is Sheets to create a Gantt chart is that your project data is immediately stale and out of date as soon as it is exported. You’ll need to keep exporting, fixing, and reorganizing your data every time you want your Gantt chart to update.
There is an Asana-Google Sheets integration that can keep your data up to date. However, trying to create a Gantt chart in a spreadsheet is a bad idea because:
- It takes a lot of time
- It is fragile and prone to breaking easily
- You need complex formulas, macros, and other workarounds to get even the most basic functionality you get in apps like Visor and Instagantt
The amount of time you will spend, and the loss of capabilities to effectively and efficiently track, manage, and report on your projects, means the losses of using Google Sheets/Excel instead of Visor or Instagantt to create Asana Gantt charts far outweigh the cost savings.
If you’re unconvinced and still want to try it, then use my guide to creating Gantt charts in Google Sheets to help you.
Why You Should Use Visor For Asana Instead of Instagantt
Instagantt for Asana will enable you to create better Gantt charts than Asana’s native Gantt chart feature.
However, using Instagantt to make Gantt charts of your Asana projects and portfolios has some important limitations you should be aware of, especially when you compare it to popular alternatives like Visor, which has powerful yet easy to use project portfolio management functionality.
Supports More Custom Fields
Instagantt only supports the following Asana custom fields:
- Estimated Hours
- Estimated Cost
- Actual Hours
- Priority and Risk
Visor supports all your Asana custom fields.
Better For Multiple Projects
Asana Portfolios cannot be imported wholesale into Instagantt, but you can combine Asana projects into Project Groups in Instagantt.
You can then visualize these Project Groups on a single Gantt chart. This fills a big gap in Asana and means you can create portfolio Gantt charts even with a Free Asana plan.
However, in Instagantt you can only visualize a maximum of ten projects on a single Gantt chart. For some teams this will be sufficient but if you want to create a multi-project Gantt chart that spans more than a few months you will probably need room for more than ten projects.
In Visor, you can create multi-project Gantt charts that include as many projects from Asana (or other apps like Jira as you need to add.
This means you can create single Gantt charts that include projects that span multiple quarters, a whole year, or incorporate multiple teams, clients, or business areas.
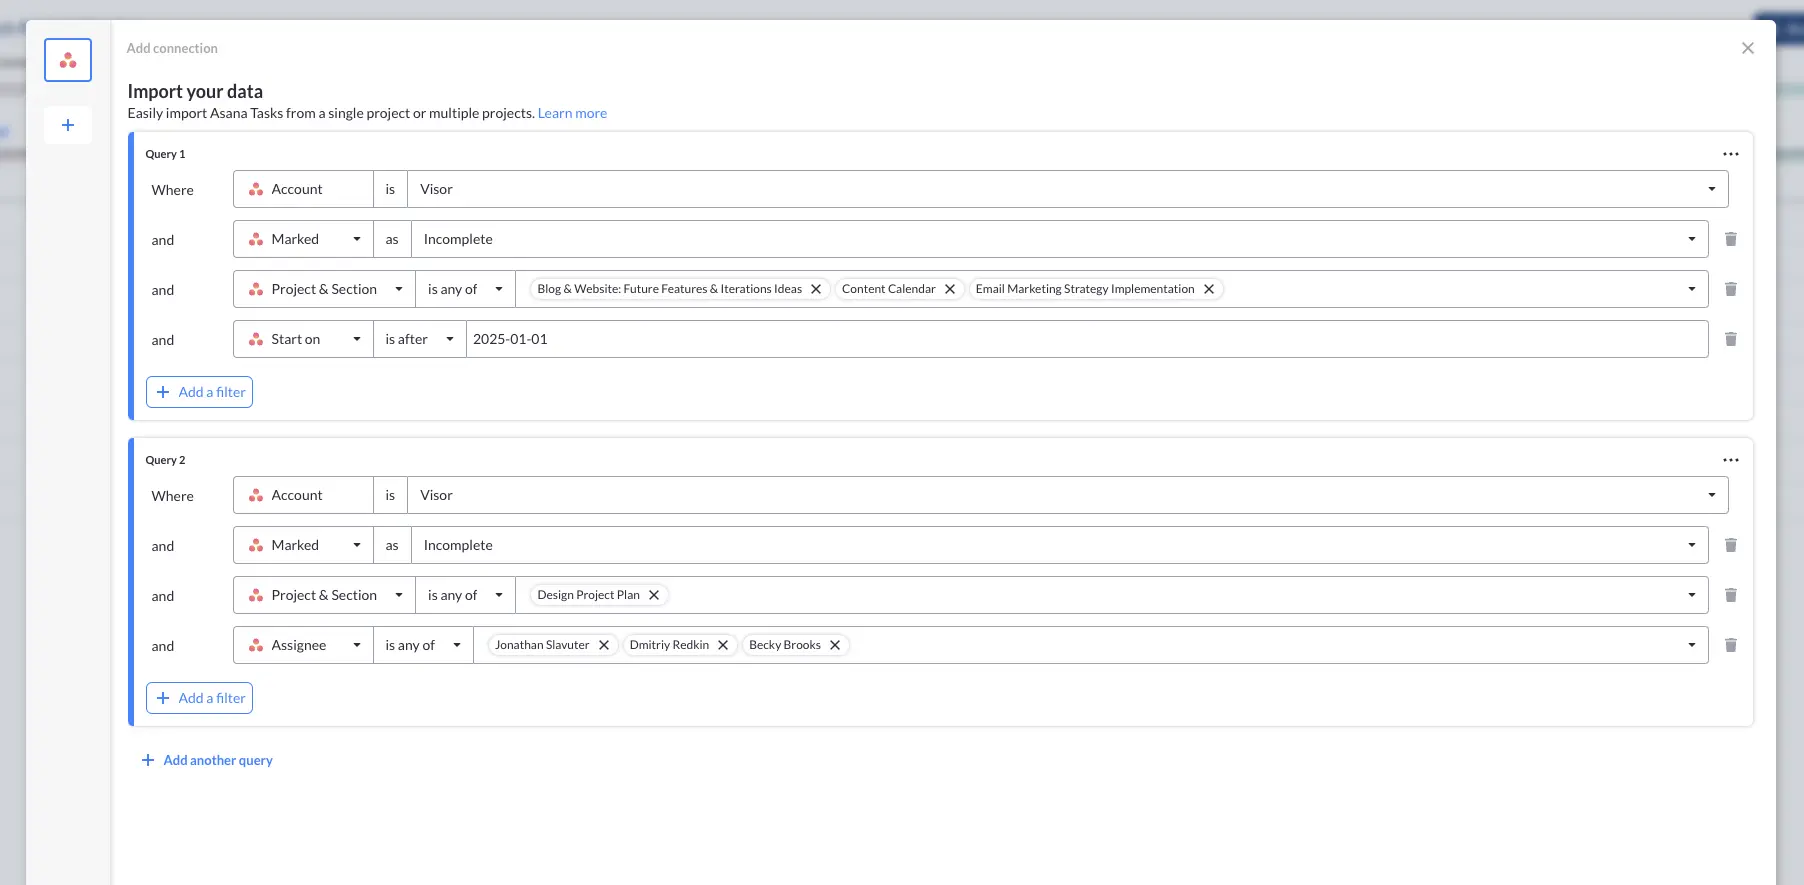
Visor has a flexible and comprehensive project import module, so you can control which projects are imported, and which tasks are imported within each of those projects too. See the example below, where I’m importing four projects, and filtering out certain tasks based on assignee and status.
Importing multiple Asana projects into my Visor workbook:
Better For Sharing and Collaborating
Instagantt only allows you to share snapshots of your Gantt charts with your clients and stakeholders if they’re not licensed users of Instagantt.
With Visor, you can share live versions of your Gantt charts with different stakeholders, using email invites or sharing links.
You can even create multiple Gantt chart versions that show different information, with varying levels of detail, but all using the same real-time project data from Asana.
This is ideal for situations like when you need to share slightly different Gantts with multiple stakeholders, like a high-level view for your CEO and a much more detailed view for your project teams.
Visor improves how your projects are communicated and viewed by stakeholders of all types, giving you multiple angles to share, without putting any more admin work on your plate.
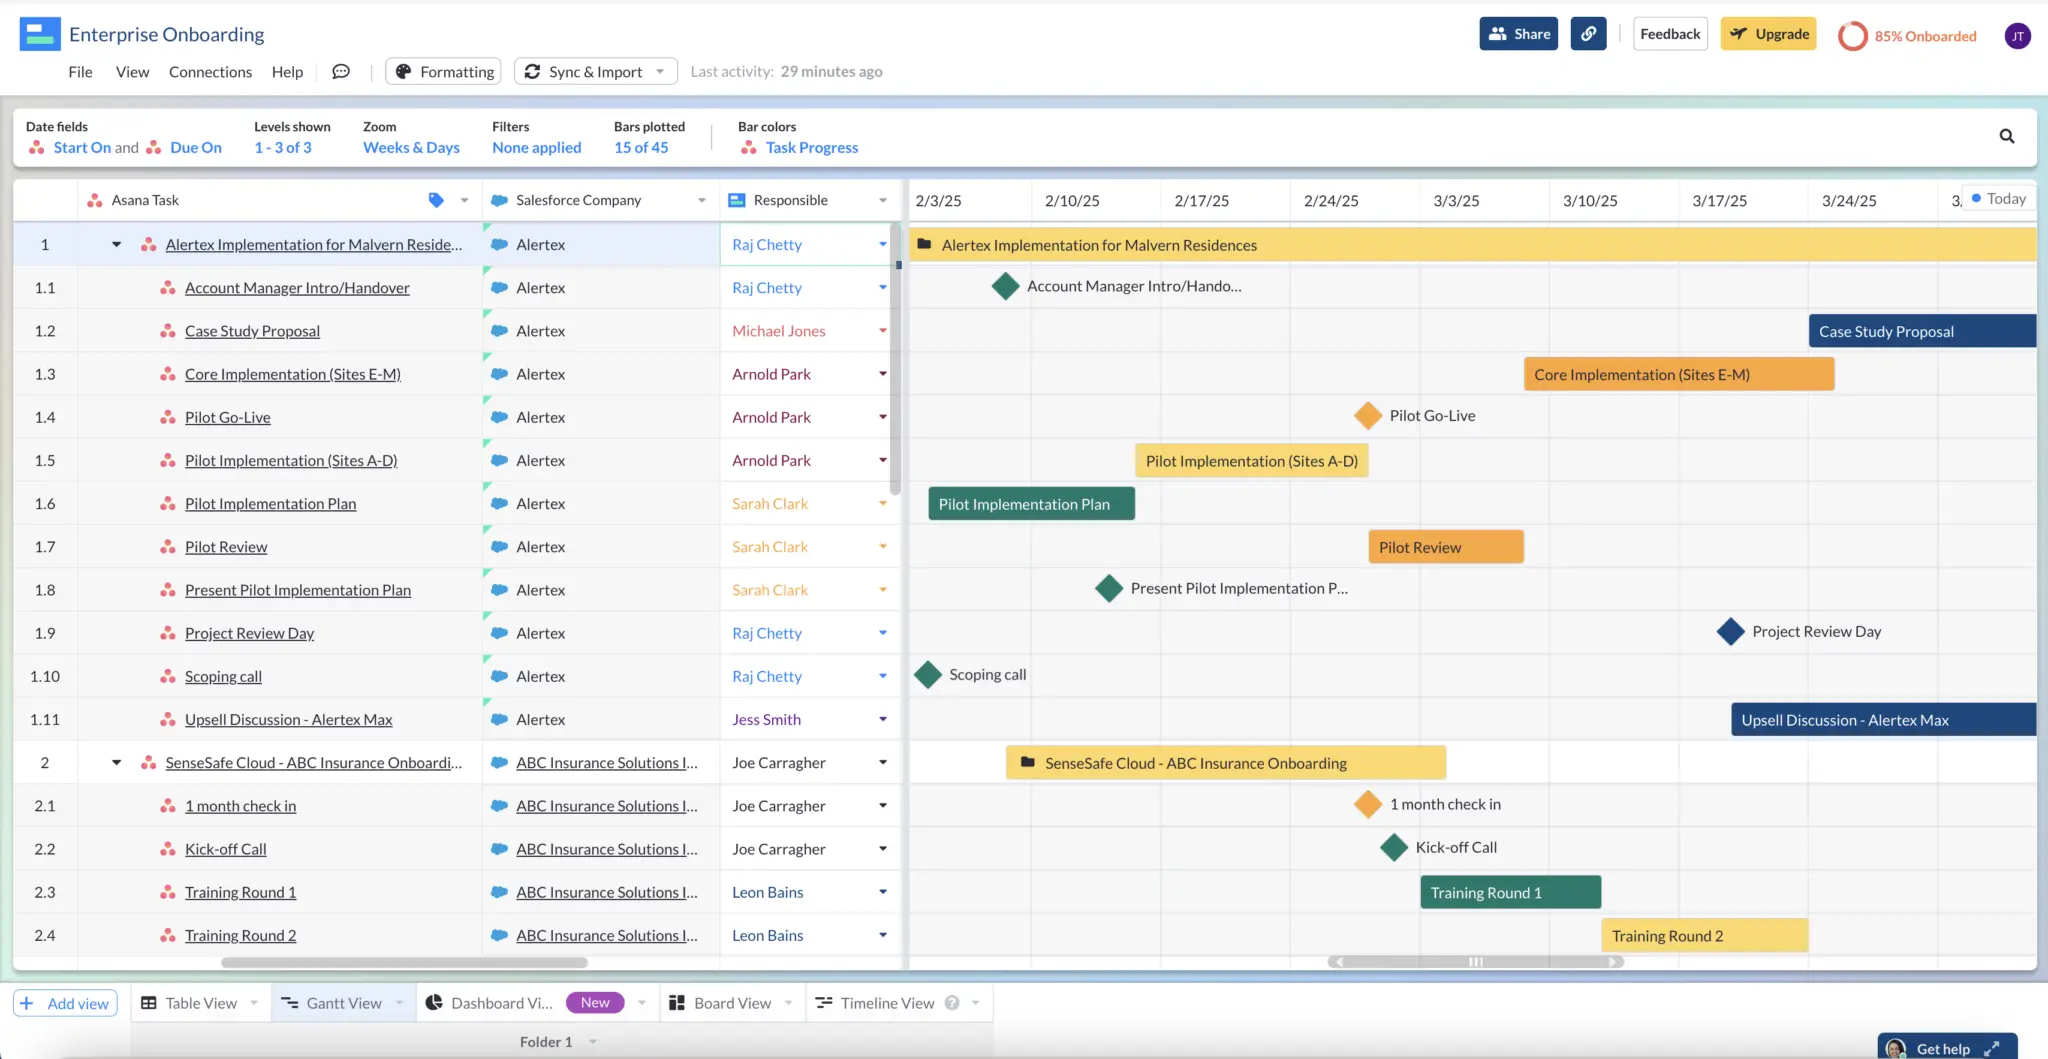
A Gantt chart I created in Visor, using data from multiple Asana projects and Salesforce, to show account managers the progress of onboarding projects:
Comparison table
| Visor for Asana | Instagantt for Asana | |
| Supports Subtasks of Subtasks on Gantt Charts | ✔ | ✘ |
| Supports Asana Custom Fields | ✔ | Limited |
| Share Real-Time Gantt Charts With Stakeholders | ✔ | ✘ |
| Portfolio Gantt Charts | ✔ | ✔ |
| Unlimited Projects | ✔ | ✔ |
| Maximum Number of Projects On a Single Gantt Chart | Unlimited | 10 |
| Cross-Project Dependencies | ✔ | ✔ |
| Customizable Gantt Columns | ✔ | ✔ |
| Custom Color Formatting | ✔ | ✔ |
How to Setup Asana and Visor
Visor offers two different ways to setup an Asana Gantt chart in Visor. You can use our AI-powered templates to get a jumpstart. Alternatively, you can manually configure a Gantt with your Asana data in Visor. We’ll go over both options.
Option #1: Use Visor’s AI Templates to Create an Asana Gantt
Visor offers a ton of different templates, such as project milestone templates (which can also import Asana milestones), along with templates for agile teams visualizing release plans in a Gantt.
This video gives you an overview of Visor’s AI-powered templates.
Option #2 Manually Make an Asana Gantt in Visor
Here’s how to connect Asana with Visor to create Gantt charts, dashboards, and a range of other visualizations without our AI-powered templates feature.
Step 1: Create a Visor account and start your 14-day free trial. There’s no credit card required, there’s no charge for your trial period, and you can choose to select a Visor Free plan after your trial is over if you don’t want to upgrade.
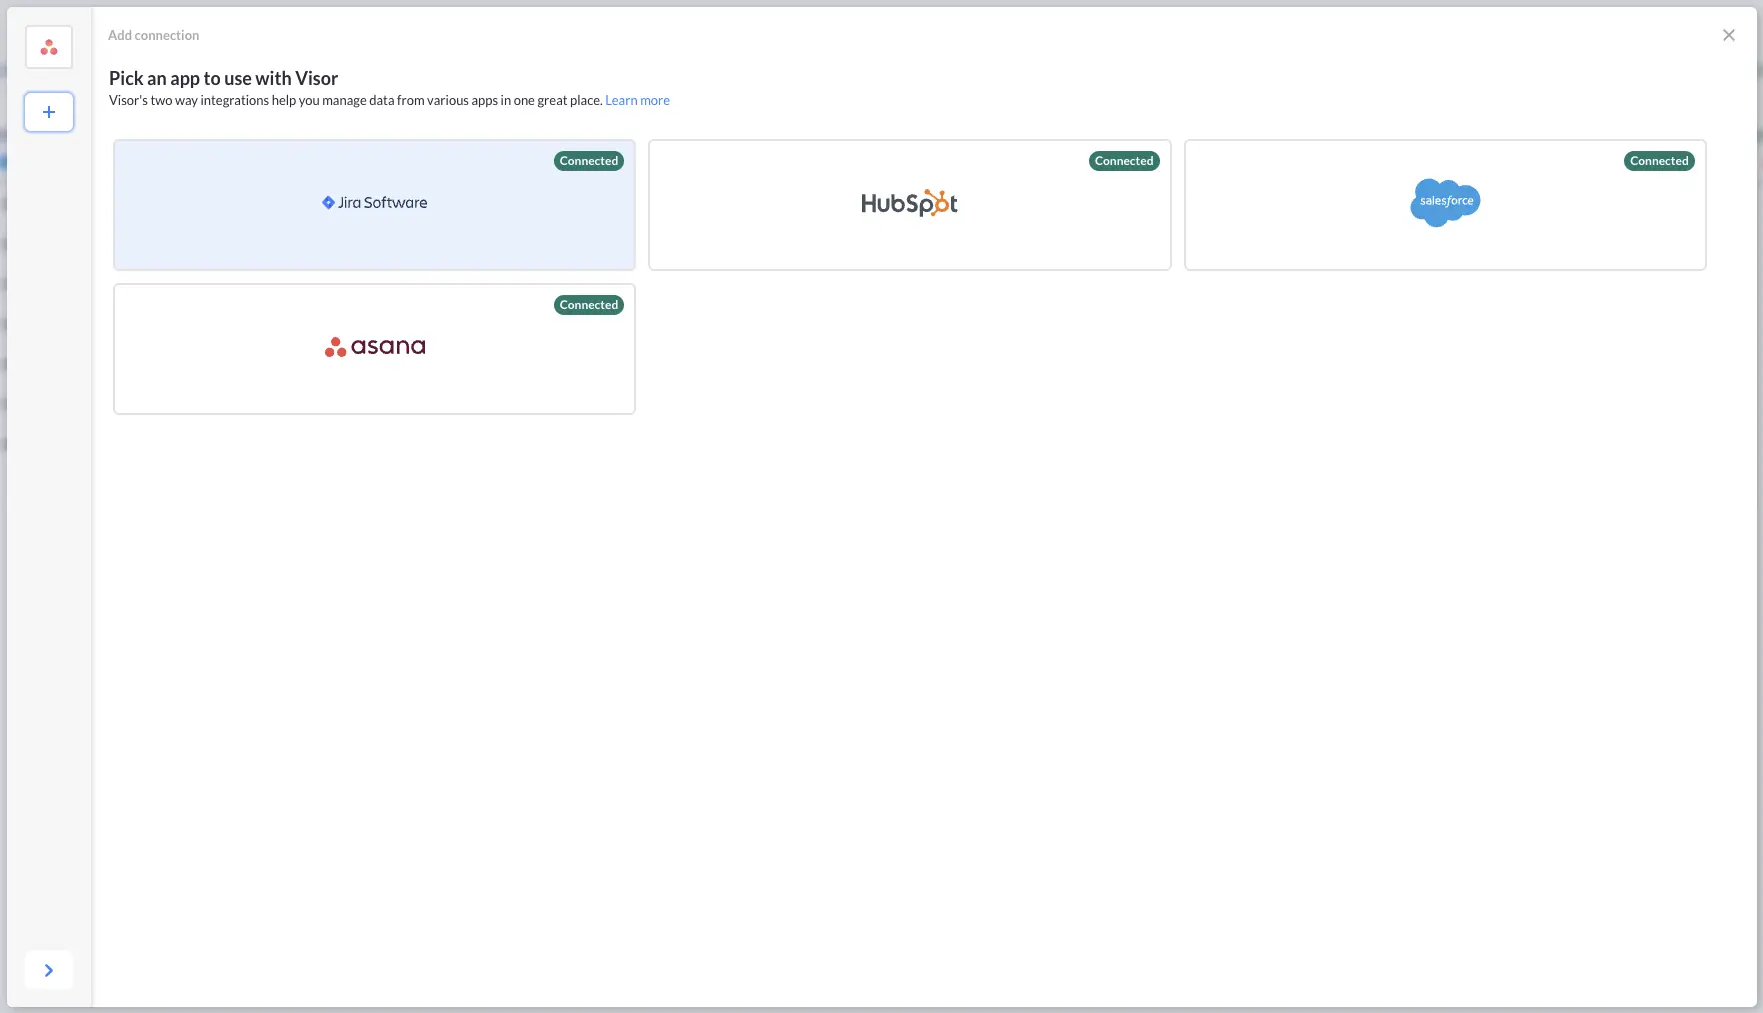
Step 2: During the onboarding, select Asana when prompted to choose which apps you want to connect to Visor. You can also add, modify, or remove the connection from Visor at any time.
Step 3: Follow the steps to authenticate with Asana, once complete Visor will learn about your Asana data.
Step 4: Use the smart filters in Visor’s Asana importer to select which projects you want to connect, adding any criteria you want to use to filter out unwanted tasks.
Step 5: Once the import is complete, click on the Gantt view tab or click “Add view” and select the Gantt view
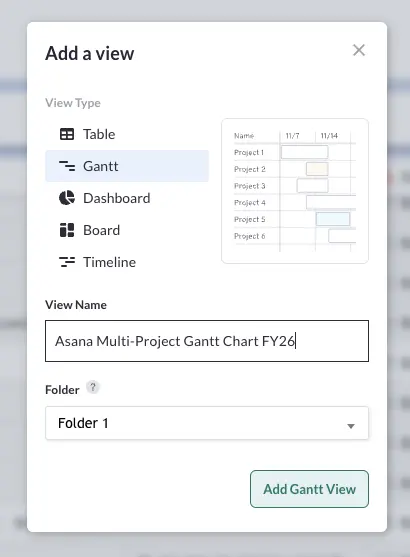
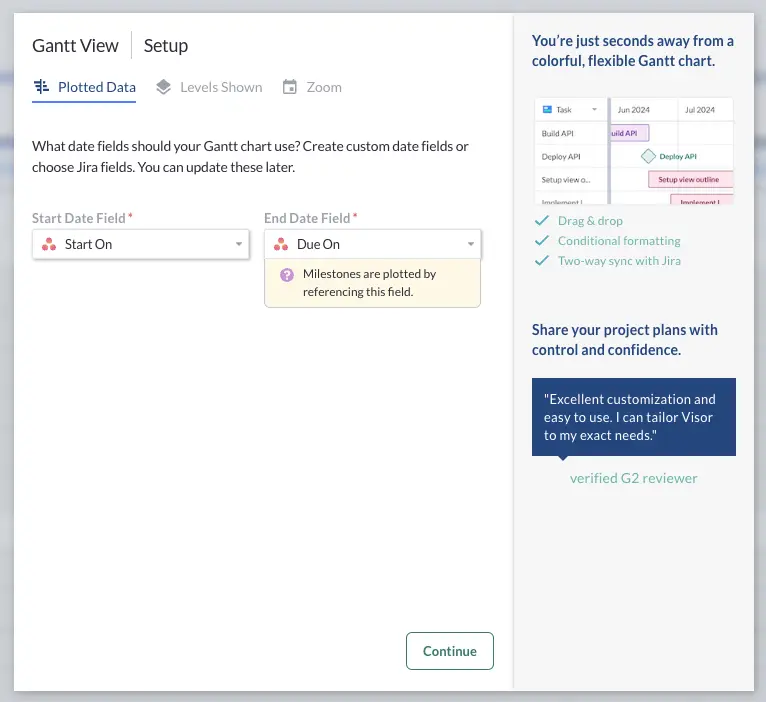
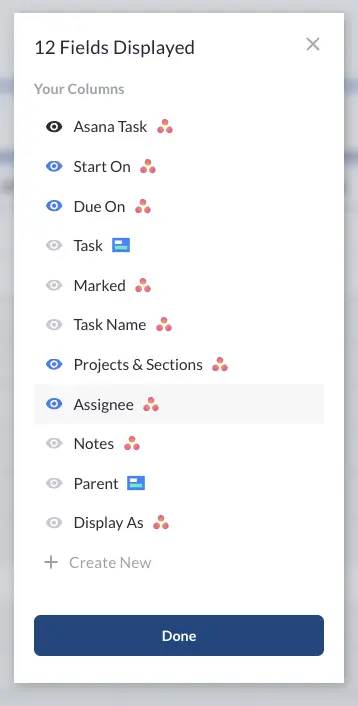
Step 6: Select the fields you want to use for your start and end dates:
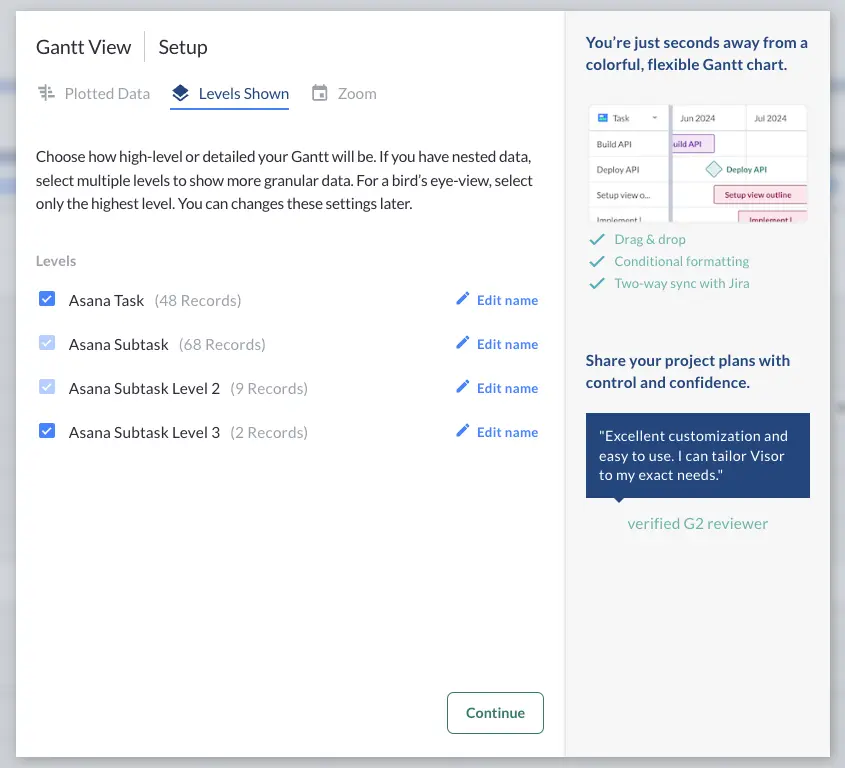
Step 7: Choose the levels of task and subtask you want to show on this Gantt chart
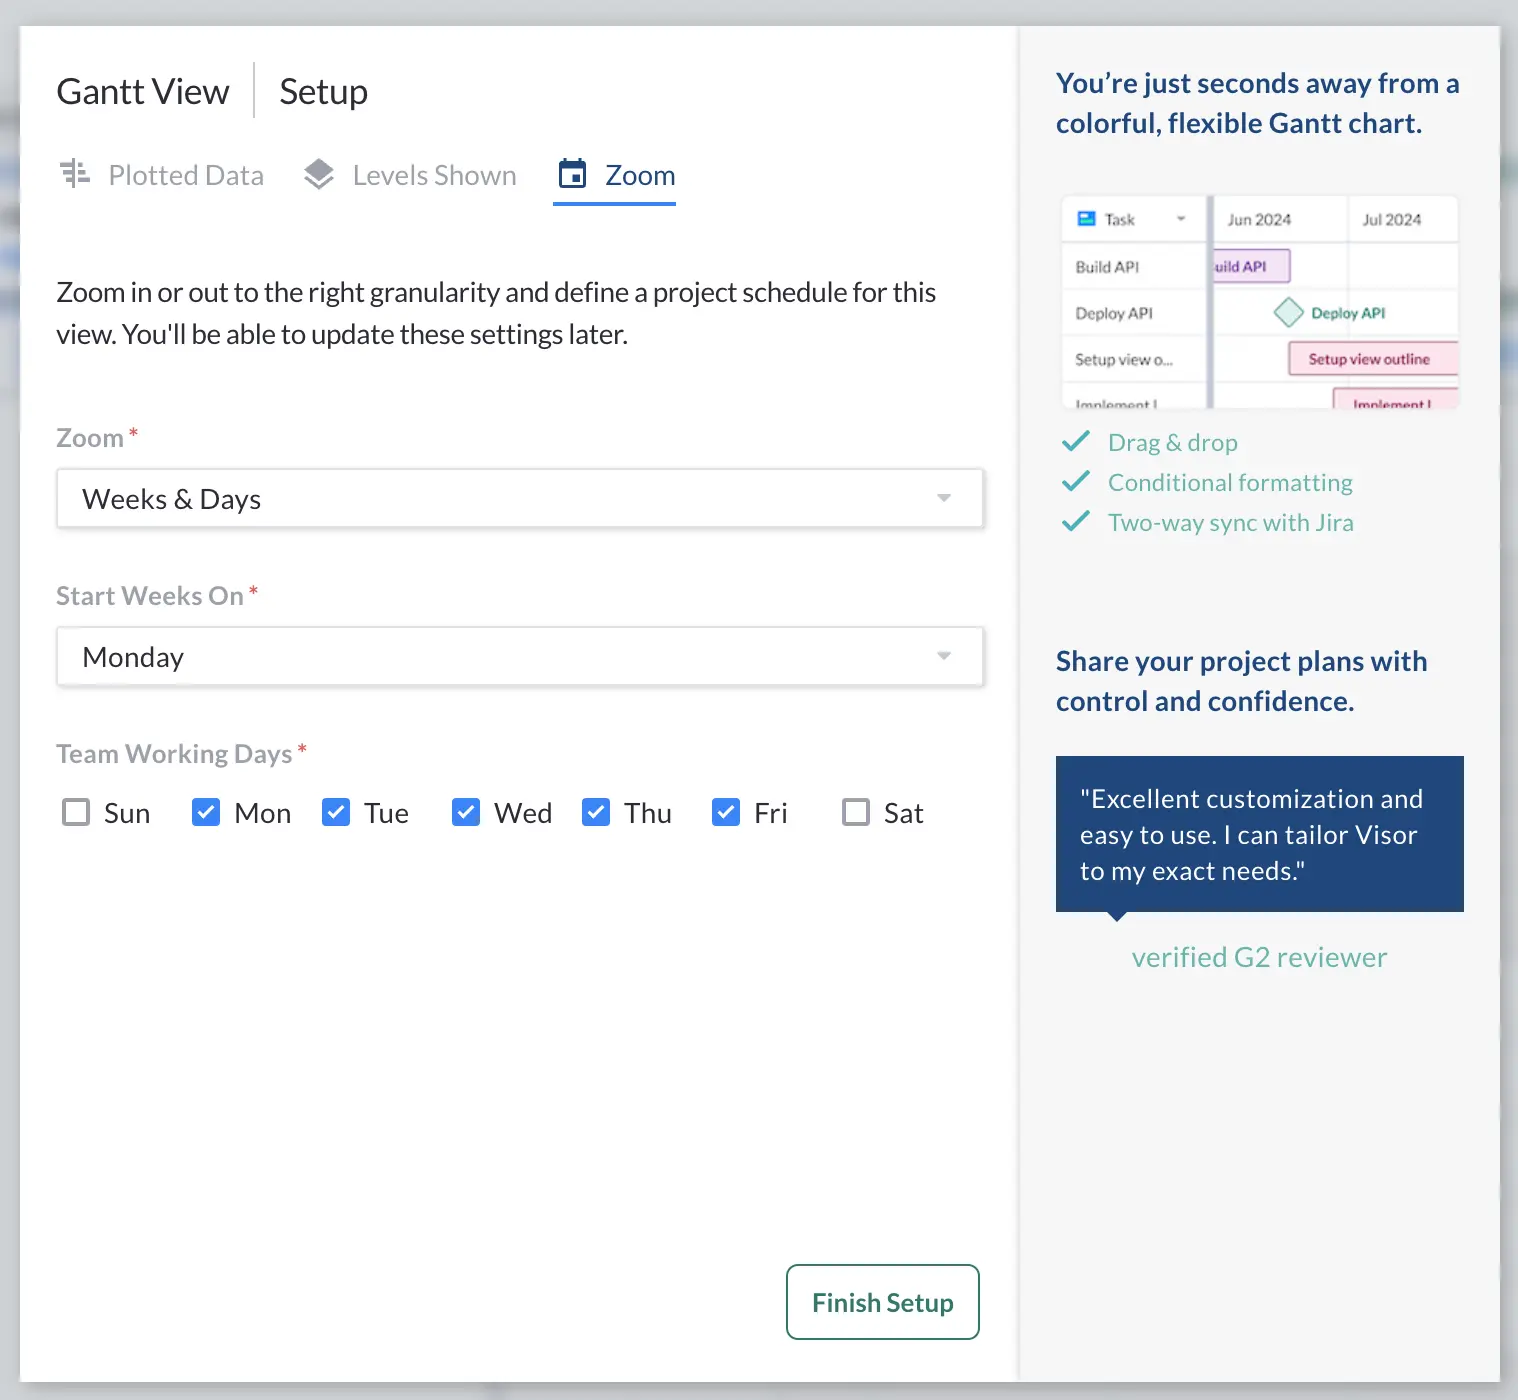
Step 8: Decide what “Zoom” or timescale you want for your Gantt chart (options include sprints, quarters, weeks and days, weeks and months and so on). Select your working days and what day to start the week on.
Step 8: Now add any additional fields you want to display as columns on the Gantt chart
Step 9: Add any filters, apply color formatting to multiple fields, and select which field to use for your Gantt bars’ colors.
Here are some examples of Gantt charts created in Visor using Asana data:
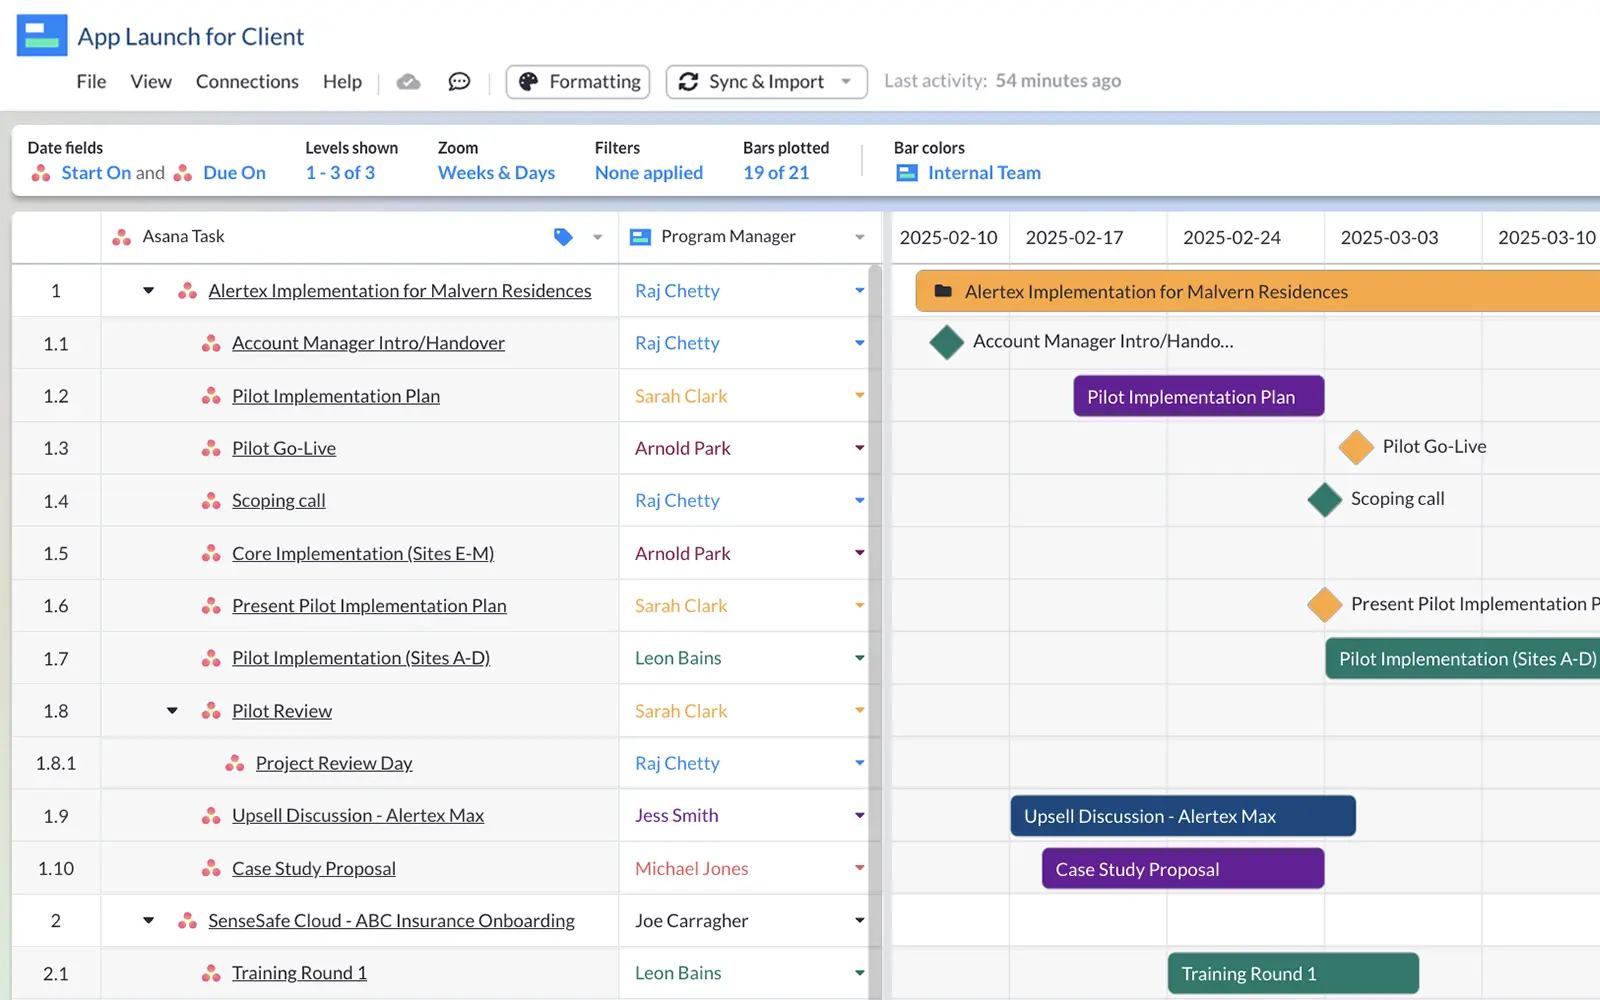
A Gantt chart showing an app launch for a client, with a Visor custom field for Program Manager:
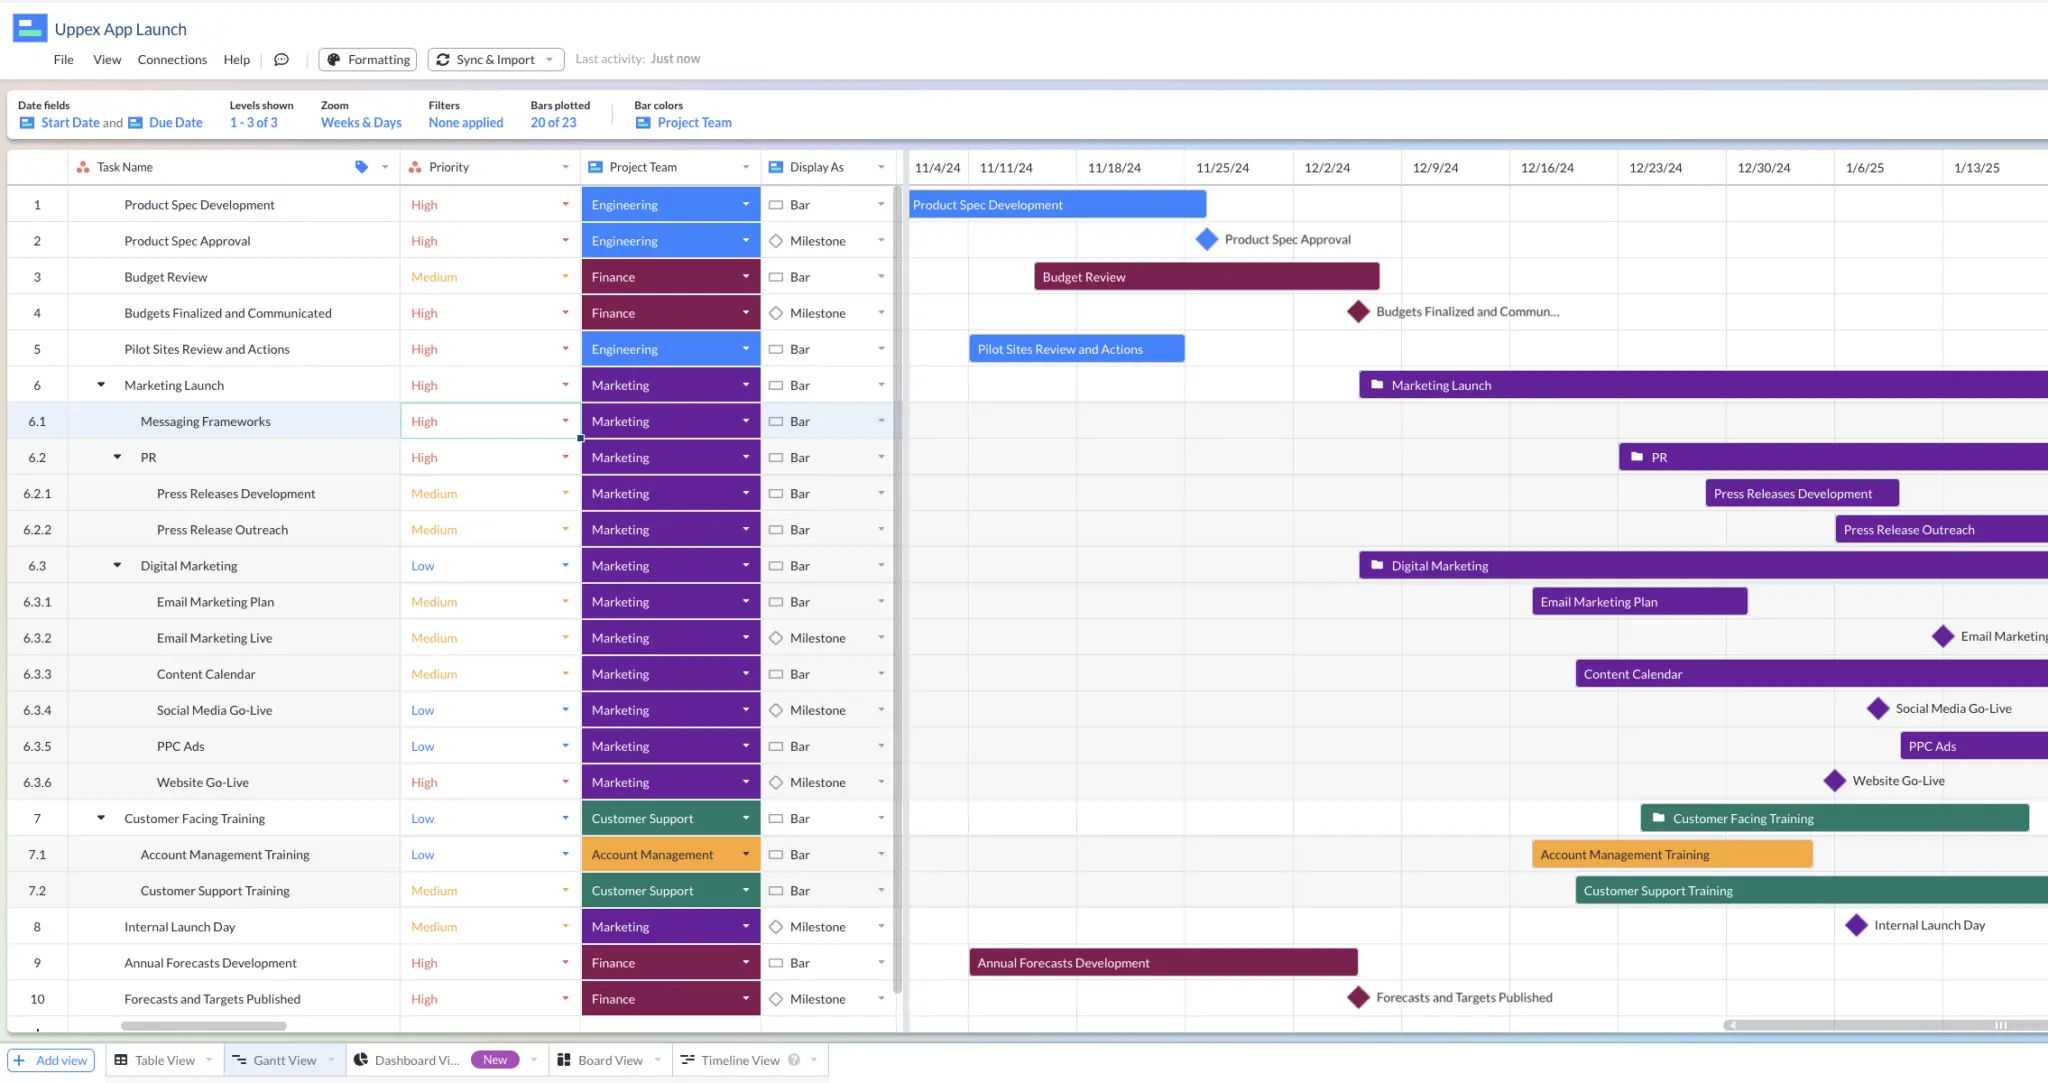
A Gantt chart in Visor, using Asana data from a project for an app launch:
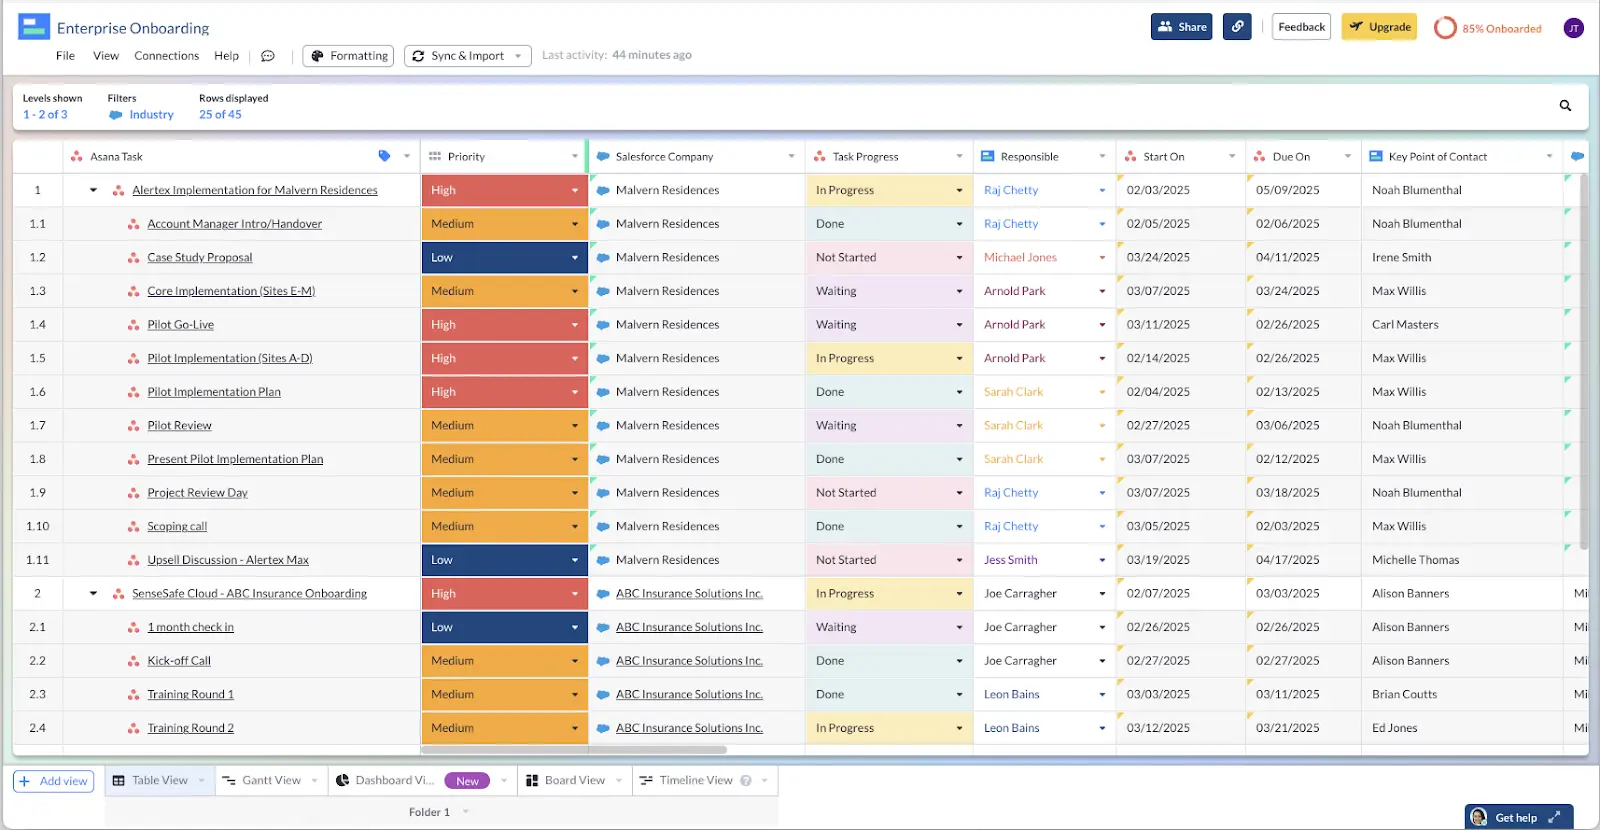
Also, here’s a Visor Table view containing data from Salesforce and Asana:
Asana and Instagantt – Is It Worth It?
As you’ve read, Instagantt is a great option you can use to enhance Asana’s native Gantt chart functionality.
It is fairly easy to use and has a range of useful functionality, including features for time and cost tracking, which make it an especially welcome addition to Asana for agencies and cross-departmental in-house teams.
However, like any product Instagantt has its own strengths and weaknesses too. That’s where a tool like Visor comes in as an alternative. Like Instagantt, Visor has a bi-directional Asana integration, that you can use to create beautiful Gantt charts, and a wide range of other view types too.
Visor is especially useful if you want to combine multiple Asana projects into portfolio Gantt charts, and arguably stronger than Instagantt in this area.
Visor also offers much better sharing options than Instagantt, enabling you to keep all stakeholders up-to-date with real-time and tailored Gantt views of your project, or live dashboards of your Asana project data that stay in sync with any updates made either in Visor or Asana.
Instagantt only allows you to share snapshots, which do not stay-up-to date and so create an extra admin burden for you and can hinder your attempts to keep your stakeholders aligned and informed.
You can try Visor for 14-days completely free of charge now. After your trial you can decide to keep a Starter or Team plan, or use Visor’s Free plan instead.