Make a simple Gantt chart in minutes with Visor’s AI Smart Templates.
Import projects from tools like Jira and Asana or input your own data. From there, AI will do the hard work for you. Generate a simple Gantt chart quickly using Visor’s AI Smart Templates that apply project management best practices and provide you with a few options.
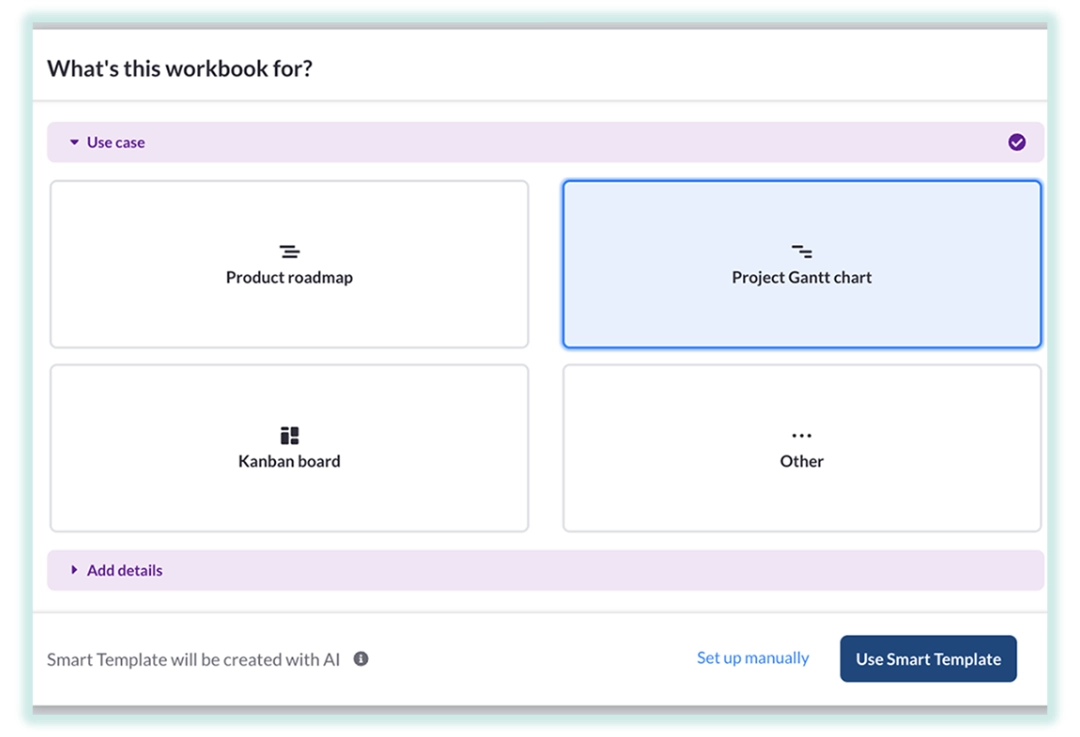
Our Simple Gantt Chart Template is powered by AI, allowing you to create a Gantt in just a few clicks. Choose a template and then prompt AI with project details so it can create a chart for you.
To get started, just click the button below, follow the steps to create your free Visor account, and when prompted select “Use Smart Template.”
Using Visor’s AI Smart Templates, you can quickly create a simple Gantt chart that follows project management best practices and shows your project data in a simple view that you find helpful.
Visor’s AI only needs a small amount of information to configure your simple Gantt chart. You can import data from places like Jira or Asana to get started.
“I was looking for a way to link Gantt charts to our Jira projects, but this allows me to do so much more.”
Nick B., Atlassian Reviewer
“5/5 – Visor is packed with features that are easy to use. It gives team members a clear view of the project timeline and their role in the project.”
Nick B., Small Business Project Manager – G2 Review
“I’ve tried just about every roadmapping platform you can think of and Visor is the first one that allows me to roadmap at both the epic and story/issue level.”
Kemper R., Atlassian Reviewer
“Visor’s integrated Gantt chart feature empowers visual project planning, enabling us to track timelines, dependencies, and resource allocation. Five out of five stars!”
Camilla B., Product Manager – G2 Review
“The integration with Jira allows for you to keep a central truth center, but still handle the many use cases teams have for roadmapping and backlog planning.”
Gabby C., Atlassian Reviewer
“Visor for JIRA enhances collaboration and project planning with its intuitive interface and integrated Gantt chart feature.”
Shruti P., Atlassian reviewer
Visor Simple Gantt Chart Template – Key Benefits:
Import data from apps like Jira & Asana for your Simple Gantt
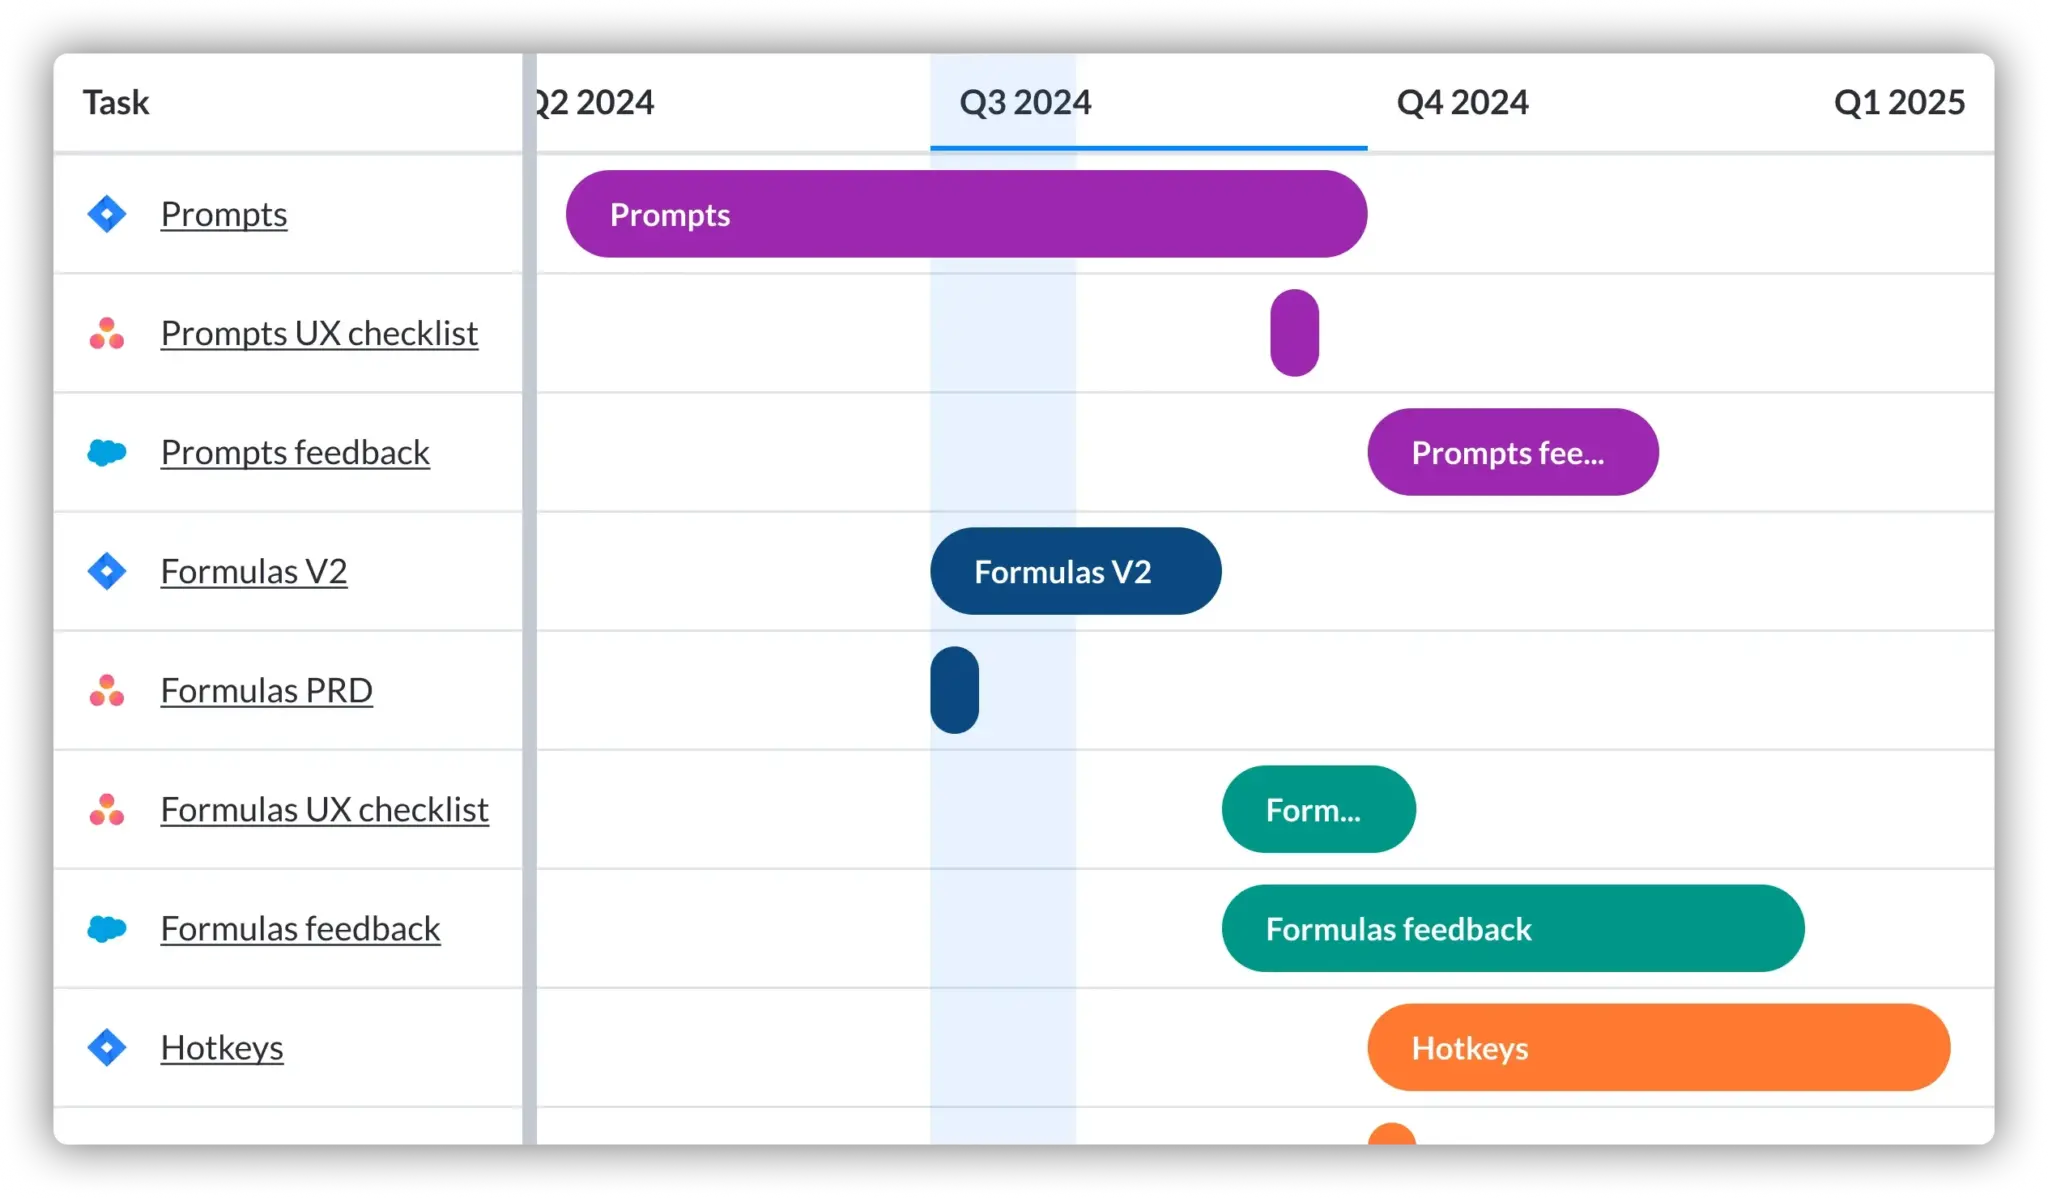
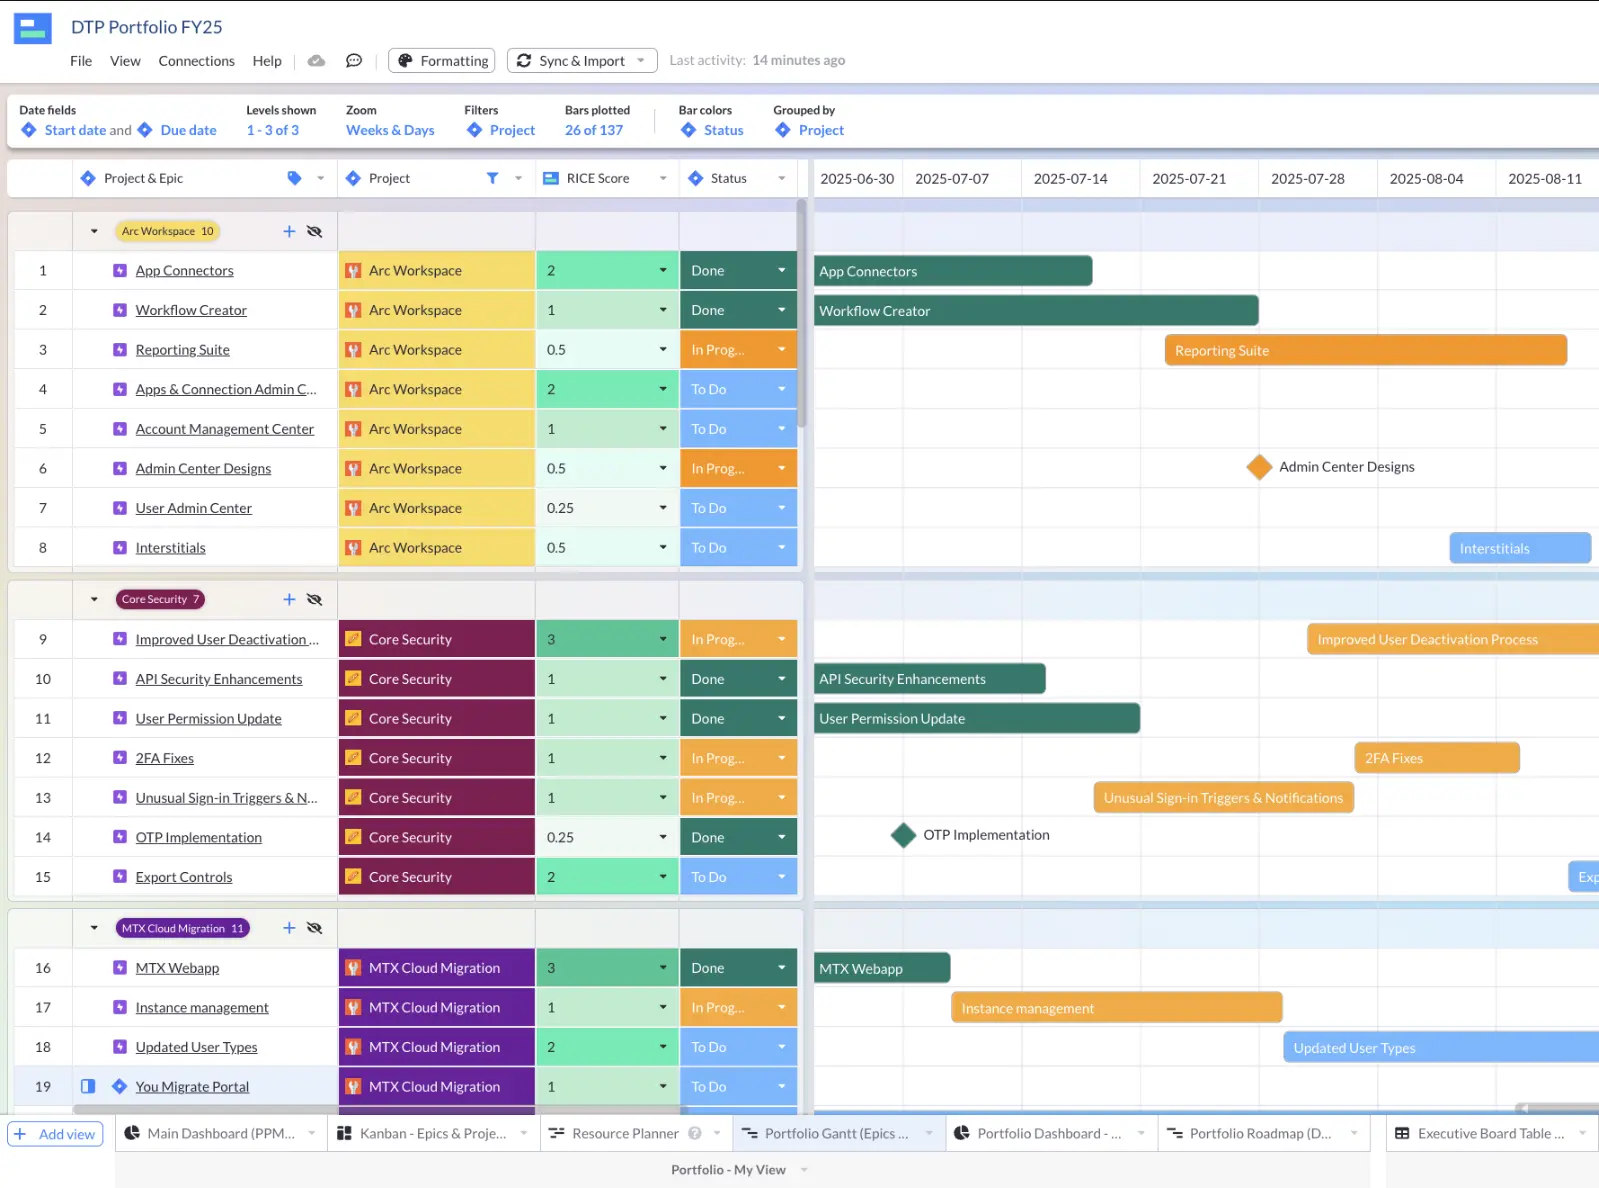
Visor’s bi-directional integration with SaaS apps makes it easy to get your data in a colorful simple Gantt chart. You can also add custom fields in Visor that don’t live in other apps or input data right into Visor.
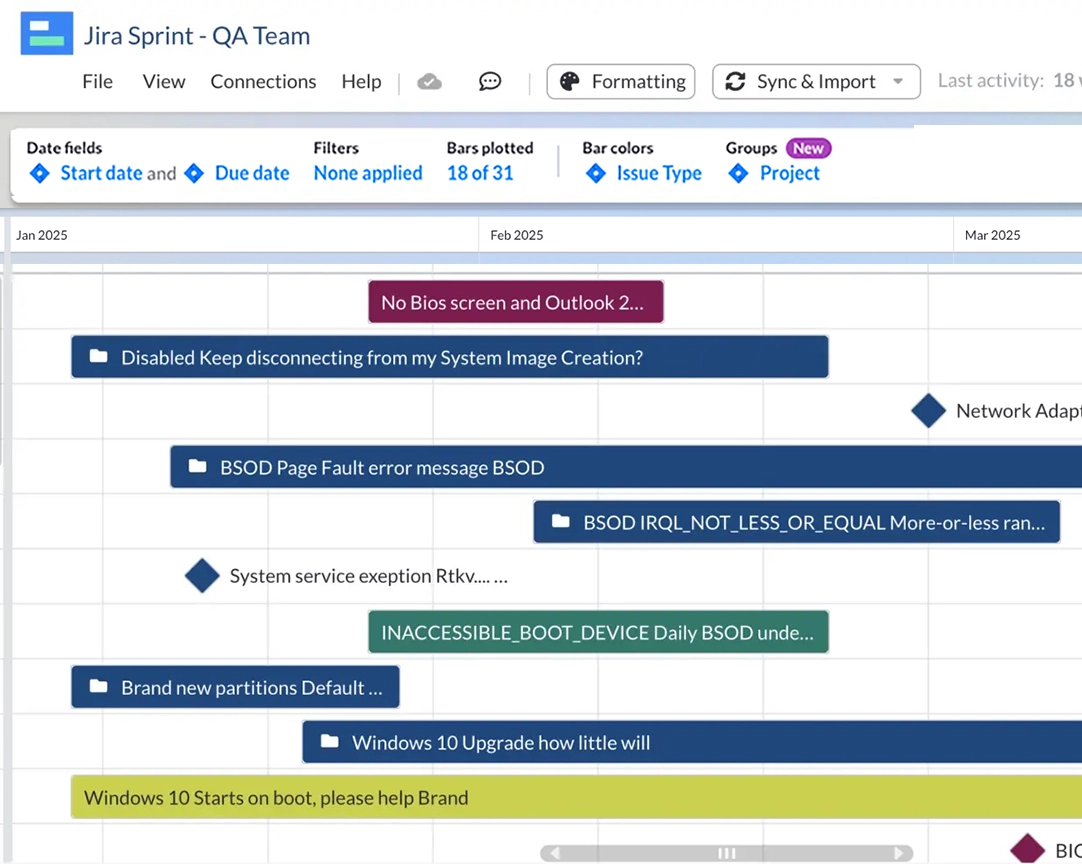
Zoom out to make your simple Gantt Chart show work by quarters, months, sprints, or even years. Zoom in to show project data by week or by day.
You can also make multiple views of your simple Gantt chart. Apply filters, import multiple projects, and make different Gantt charts for different audiences.
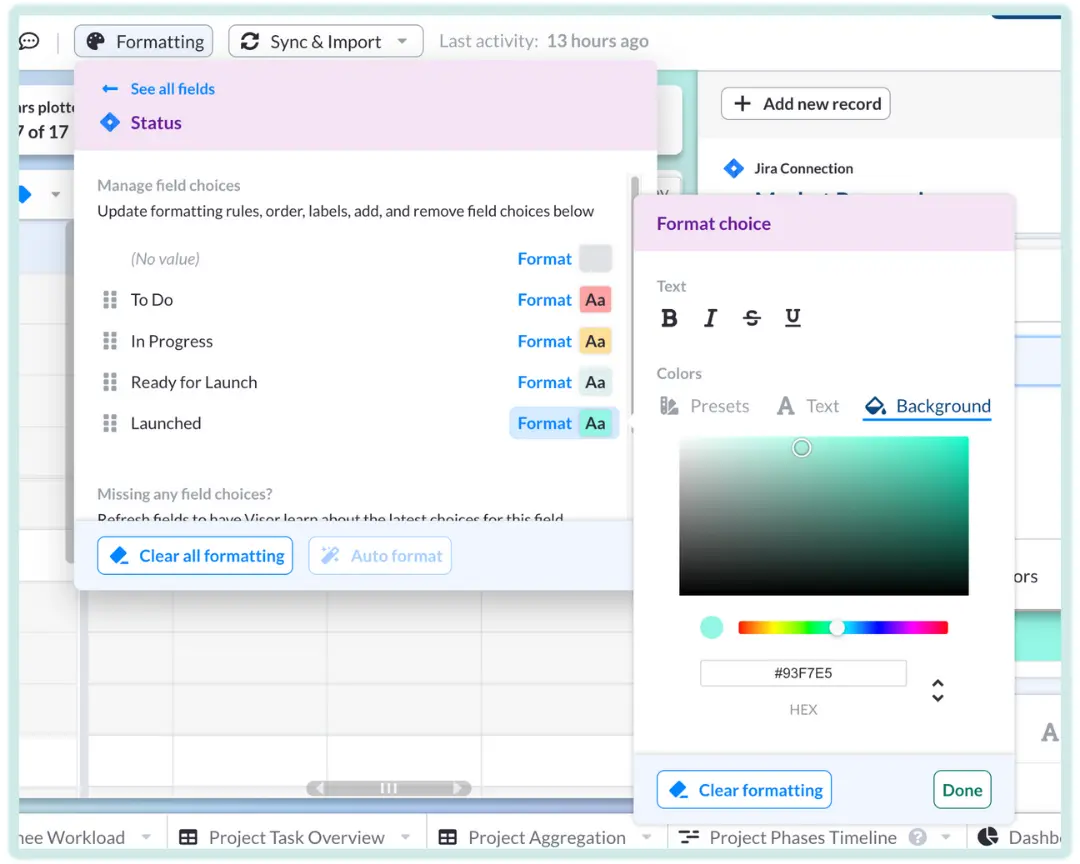
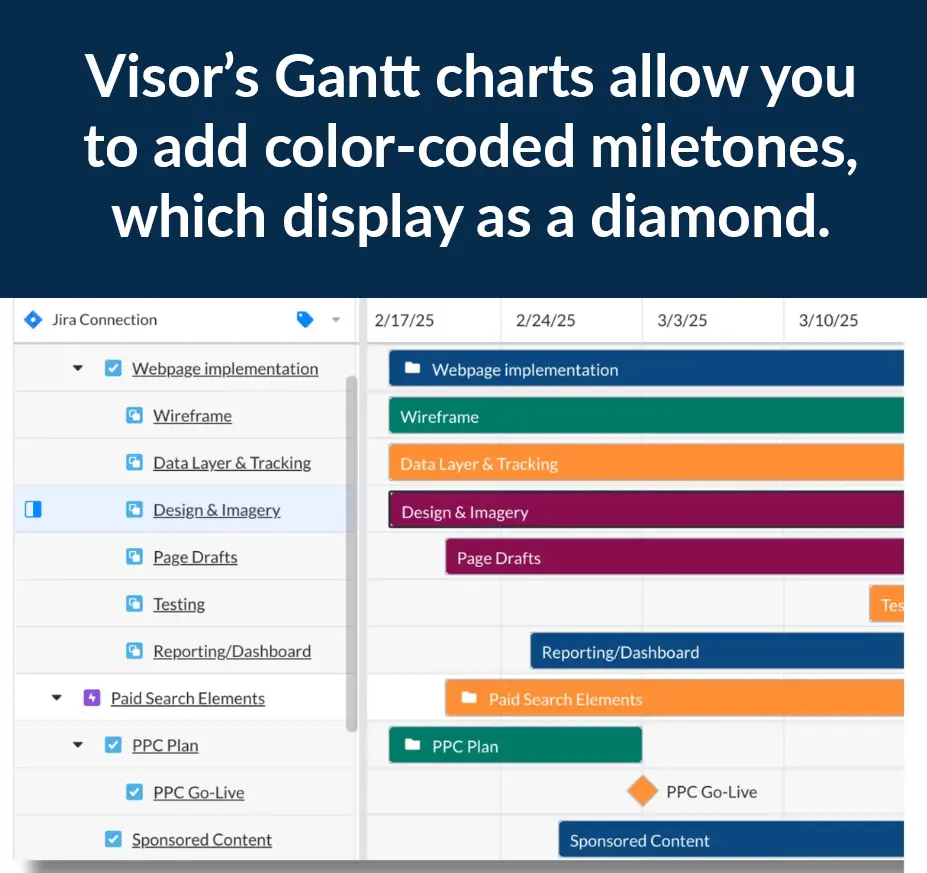
Customize, Color Code, & Add Milestones to Simple Gantt Charts
Visor’s AI does the heavy lifting, but you still have full control. Add conditional formatting to color-code your simple Gantt. You can also apply filters, allowing the right level of granularity. Add milestones as needed and other custom features.
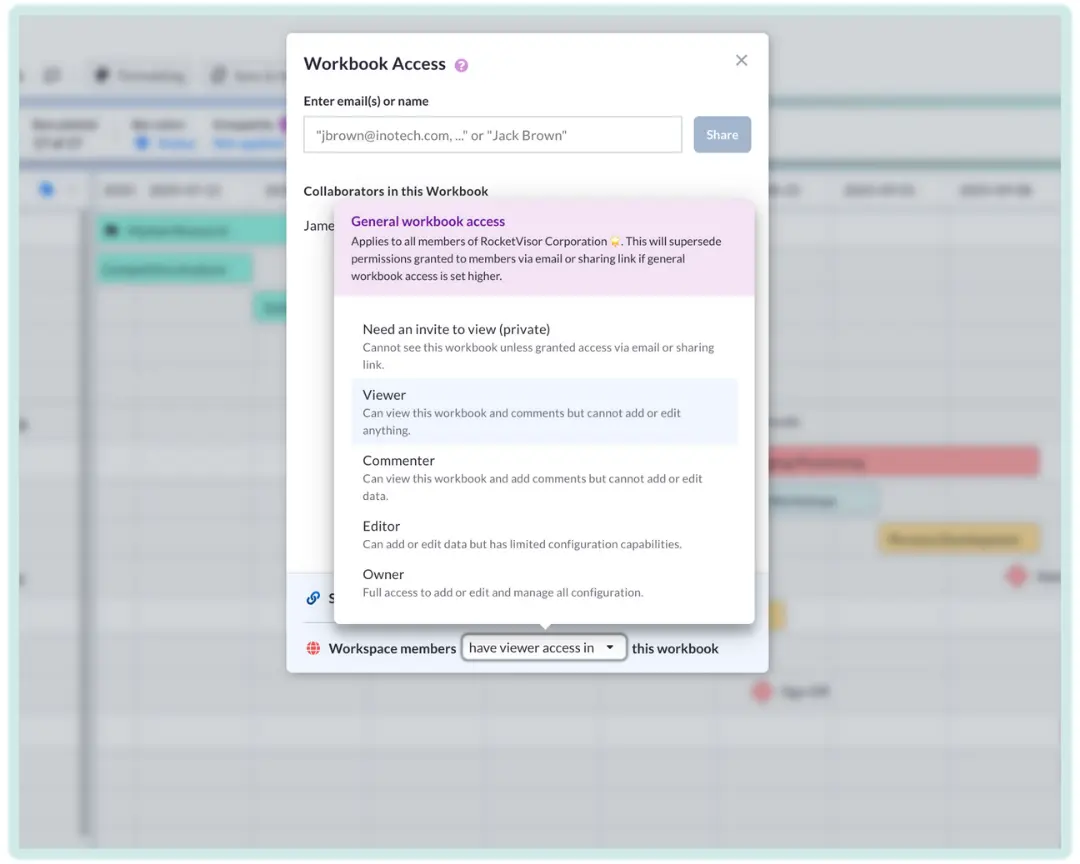
Keep your stakeholders updated at every step with Gantt charts stay in sync with apps like Jira and Asana. Share your Gantt chart easily using email invites or reusable sharing links.
Use Visor’s Simple Gantt Chart Template With Data From Your SaaS Apps
Connect Visor to popular SaaS apps or input your project data directly into Visor to create your simple Gantt chart.
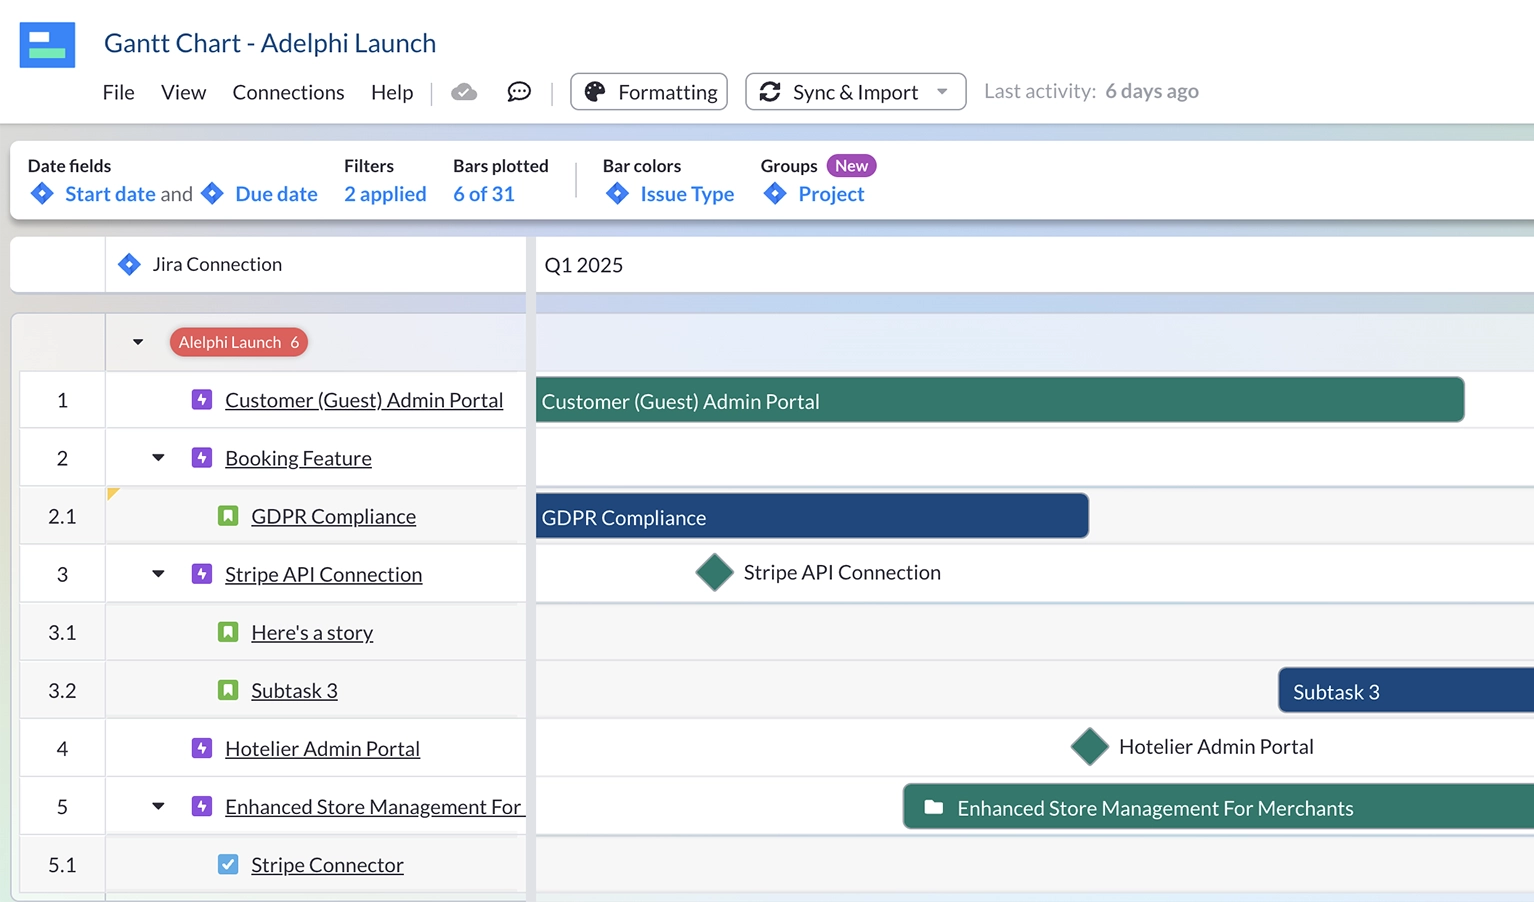
Import nested Jira data (e.g., Epics, Stories/Tasks) in minutes. Visor maintains your data’s structure, allowing you to visualize project plans and push out edits.
Visor pays attention to the details, treating your data exactly as Salesforce does. Import and edit your data, including dropdown field selections and contact names.
Connect, visualize, and update Asana projects including sub-tasks and custom fields. Easily make bulk edits and connect with project data from other apps.
Are Visor’s Simple Gantt Chart Template and AI Templates free?
Yes, you can access our Simple Gantt chart template (which uses AI) upon registering at Visor. You will have a 14-day free trial of Visor’s Team plan, giving you access to all of Visor’s premium features, including our Gantt view.
After this trial ends, your Gantt chart will still be in tact. Additionally, you can continue to use our AI Smart Templates after your trial ends, using the views that are included in our free plan (Table and Board views).
To make edits to it or adjust your simple Gantt chart after your trial ends, you can select our Team, Starter, or Business plan. You can also continue using Visor’s Free account, which lets you continue to use our Board view and Table view.
Does Visor’s Simple Gantt Template allow me to customize my chart?
Our AI-powered templates are a jumpstart. It will create a basic Gantt chart that you can always customize afterwards. We’ll go into how in this section.
Whether you want to color-code your Gantt chart, apply filters, add milestones, dependencies, or group data with swimlanes, you can.
Visor also gives you a few different “views” so you can play around with different ways to visualize your simple Gantt chart while still maintaining other versions of your Gantt.
If I don’t have start and end date fields, can I still use Visor’s Simple Gantt Chart Template?
You do need start and end date fields to use Visor’s Gantt view.
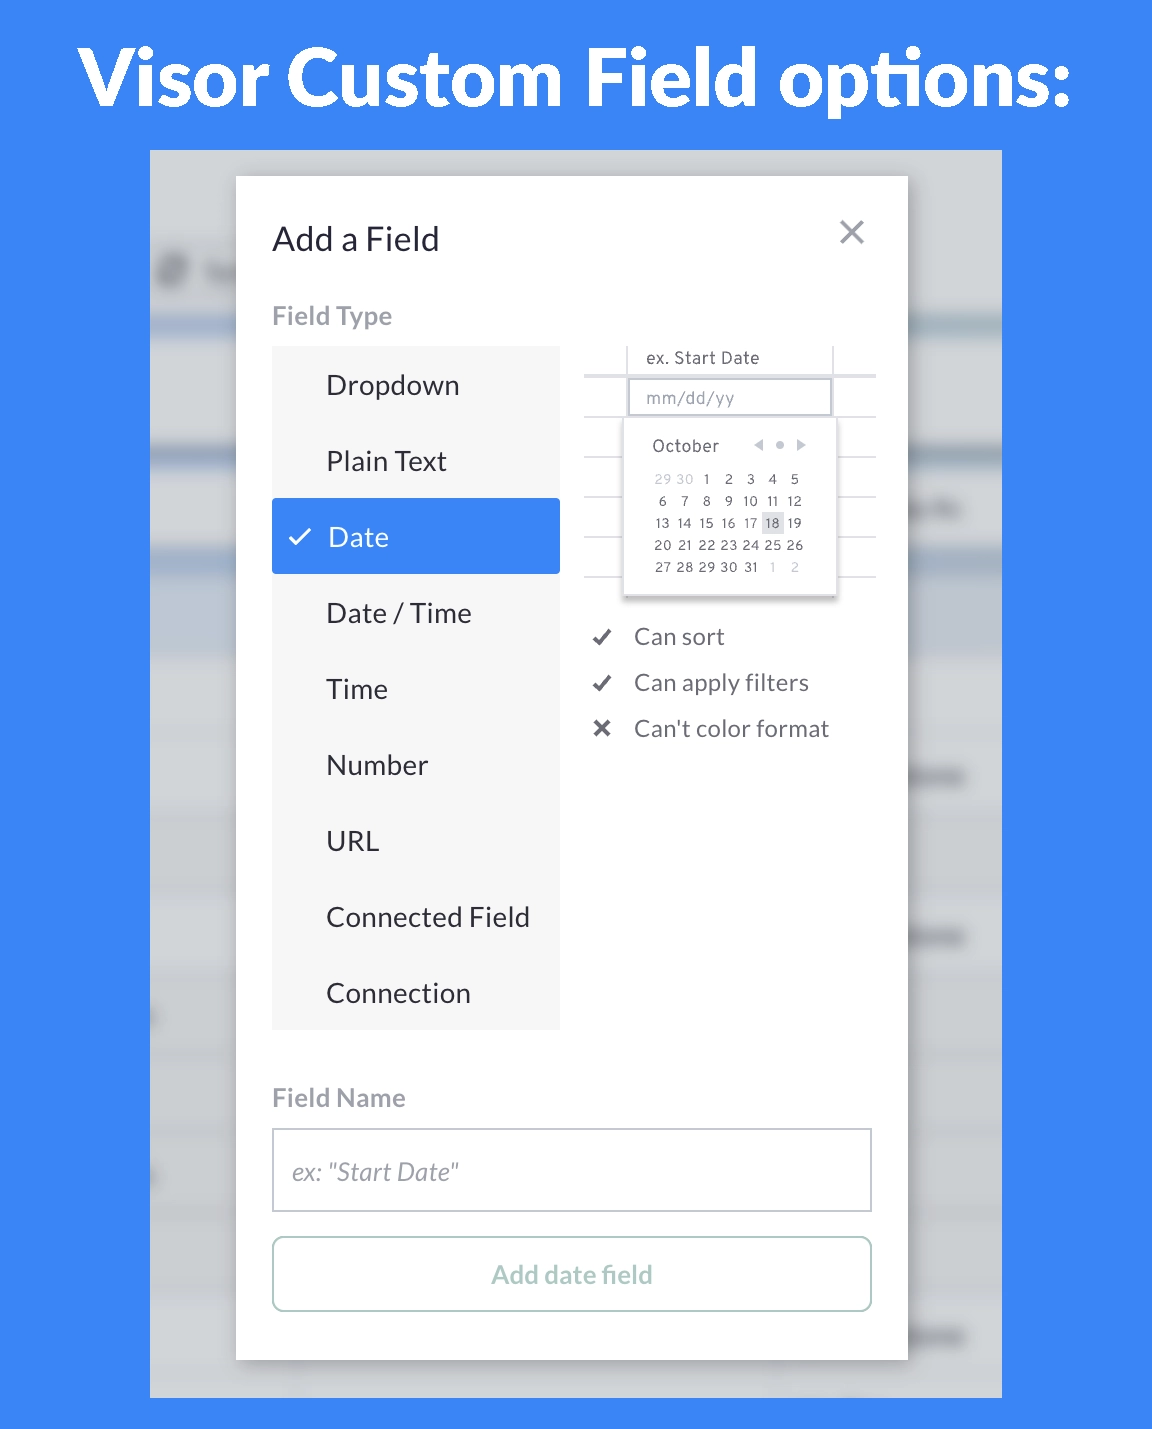
If you are importing data to create a Jira Gantt chart or an Asana Gantt chart and don’t have date fields in those apps, you can always add date fields in Visor using our custom fields. These custom Visor fields only live in Visor.
Not importing data from other apps? You can always just use Visor’s custom fields to create a Gantt chart using our Simple Gantt Chart template.
hese custom fields will live only in Visor. Therefore, if you’re importing data from elsewhere, the fields you create in Visor won’t affect data in your other apps.
I only want to visualize one project into my Gantt but Visor works across a portfolio of projects. Can I still use the Simple Gantt Chart Template for one project?
You can also import data from other apps to create Gantt charts with Salesforce data or HubSpot data. Because these apps don’t have a concept of projects, you don’t need multiple projects.
Similarly, you can just manually input data into your Gantt chart. If that data is just for one project, that’s okay!
However, if you change your mind and want to use Visor’s JQL and Asana importer to bring in multiple projects, you can always import more data (or input more data). Visor supports importing just one or multiple projects from project management apps like Jira and Asana, you can also work with just one project.
I want to create a Simple Gantt chart that I can share with others. Will this Template allow that?
Yes, during our 14-day trial, you can definitely share with unlimited view-only people. After that, you can share with unlimited viewers on our Team plan. You can explore our pricing here.
Can I also set up my Simple Gantt chart manually or do I have to use a Simple Gantt Chart template?
Our AI Smart Templates are easy to use, making Visor one of the most intuitive AI project management tools on the market). And if you want more info about the type of data we use in our AI Smart Templates, check out our Knowledge Base.)
However, we understand that not everyone wants to use AI. Therefore, you can also manually create a simple Gantt chart in Visor — even without a template! Visor is a popular Gantt chart software for good reason (even before we had AI features). Discover why by getting started today.
You can see for yourself how easy it is without a template in the video below!
To provide the best experiences, we use technologies like cookies to store and/or access device information. Consenting to these technologies will allow us to process data such as browsing behavior or unique IDs on this site. Not consenting or withdrawing consent, may adversely affect certain features and functions.
Functional Always active
The technical storage or access is strictly necessary for the legitimate purpose of enabling the use of a specific service explicitly requested by the subscriber or user, or for the sole purpose of carrying out the transmission of a communication over an electronic communications network.
Preferences
The technical storage or access is necessary for the legitimate purpose of storing preferences that are not requested by the subscriber or user.
Statistics
The technical storage or access that is used exclusively for statistical purposes.The technical storage or access that is used exclusively for anonymous statistical purposes. Without a subpoena, voluntary compliance on the part of your Internet Service Provider, or additional records from a third party, information stored or retrieved for this purpose alone cannot usually be used to identify you.
Marketing
The technical storage or access is required to create user profiles to send advertising, or to track the user on a website or across several websites for similar marketing purposes.
To provide the best experiences, we use technologies like cookies to store and/or access device information. Consenting to these technologies will allow us to process data such as browsing behavior, to improve the performance of this website.
Functional Always active
The technical storage or access is strictly necessary for the legitimate purpose of enabling the use of a specific service explicitly requested by the subscriber or user, or for the sole purpose of carrying out the transmission of a communication over an electronic communications network.
Preferences
The technical storage or access is necessary for the legitimate purpose of storing preferences that are not requested by the subscriber or user.
Statistics
The technical storage or access that is used exclusively for statistical purposes.The technical storage or access that is used exclusively for anonymous statistical purposes. Without a subpoena, voluntary compliance on the part of your Internet Service Provider, or additional records from a third party, information stored or retrieved for this purpose alone cannot usually be used to identify you.
Marketing
The technical storage or access is required to create user profiles to send advertising, or to track the user on a website or across several websites for similar marketing purposes.