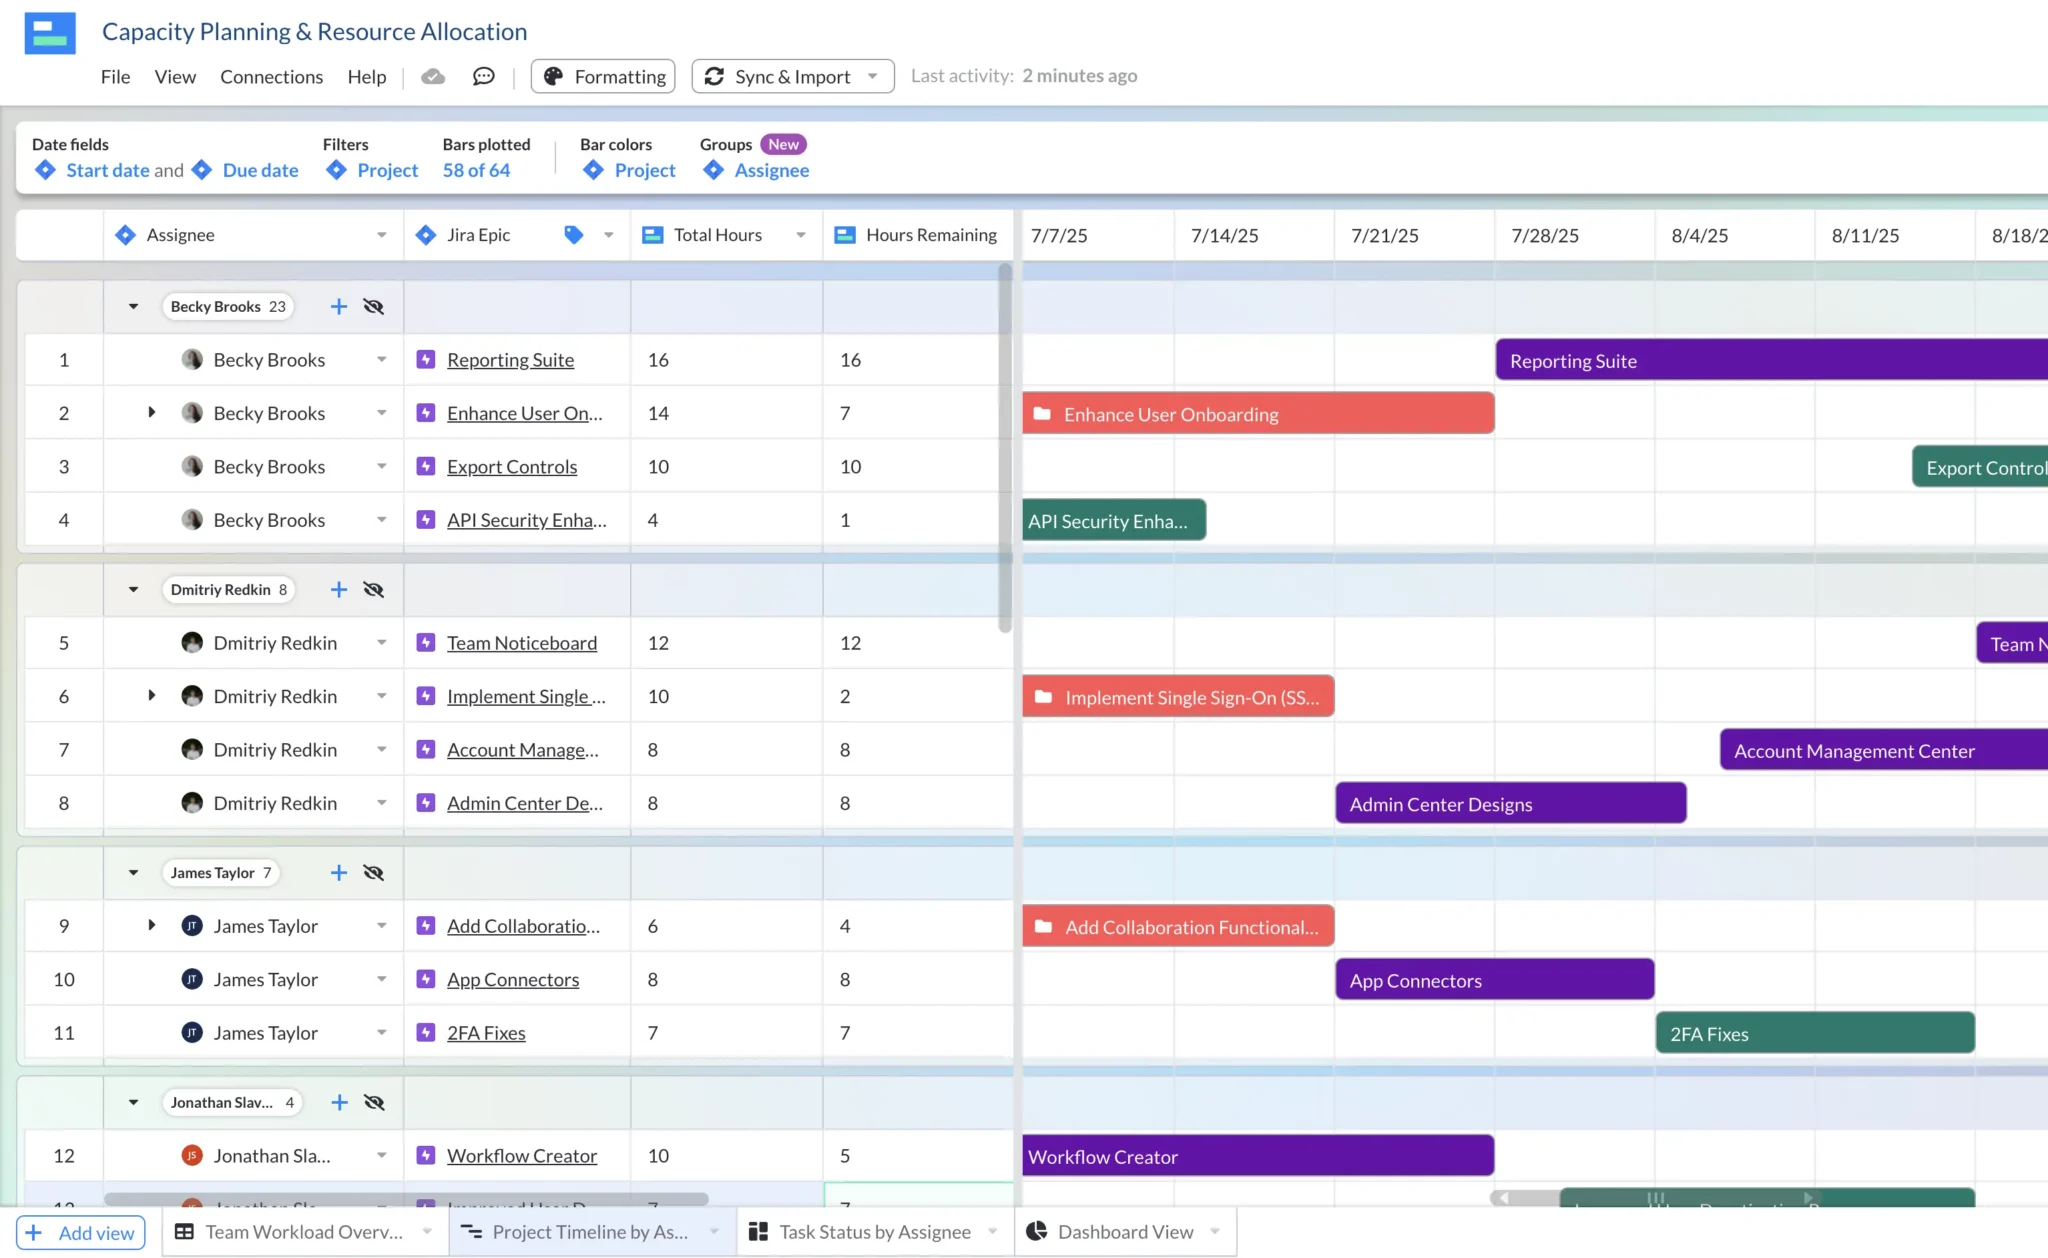
Ensure that resourcing is balanced and optimized across all your projects with our capacity planning templates.
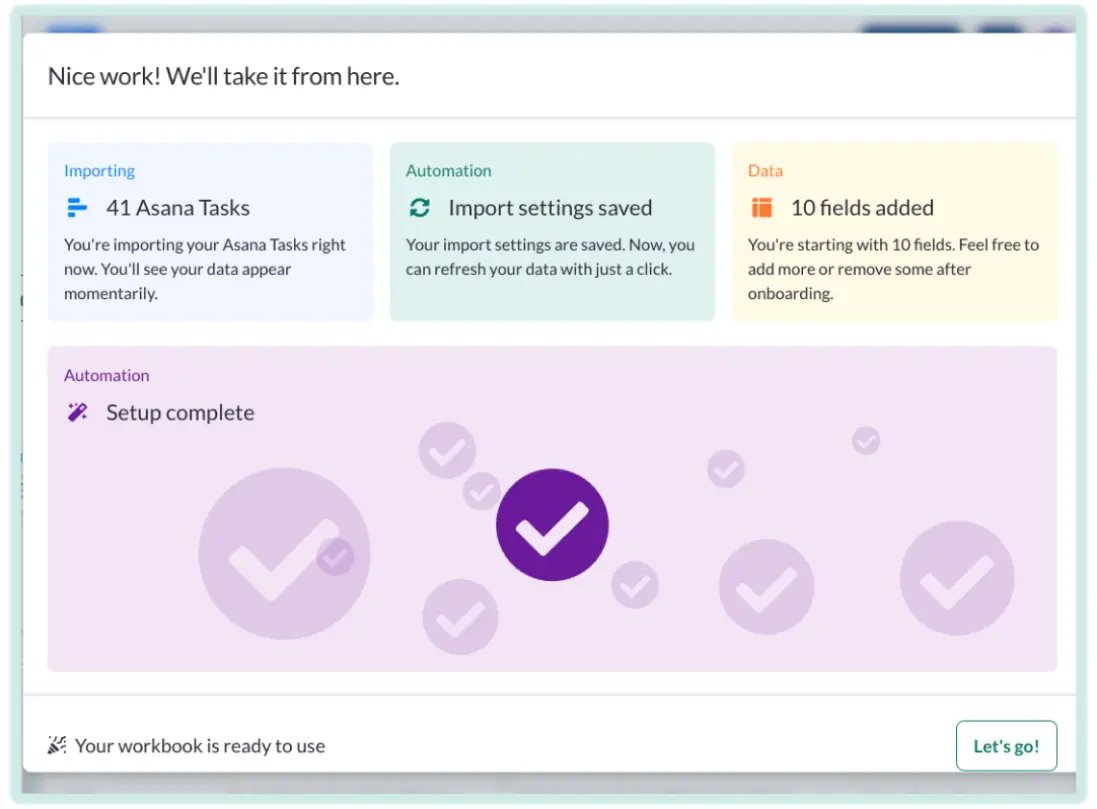
Visor’s AI uses your requirements and project data to create custom capacity planning templates for you in minutes. This saves you hours of time and effort.
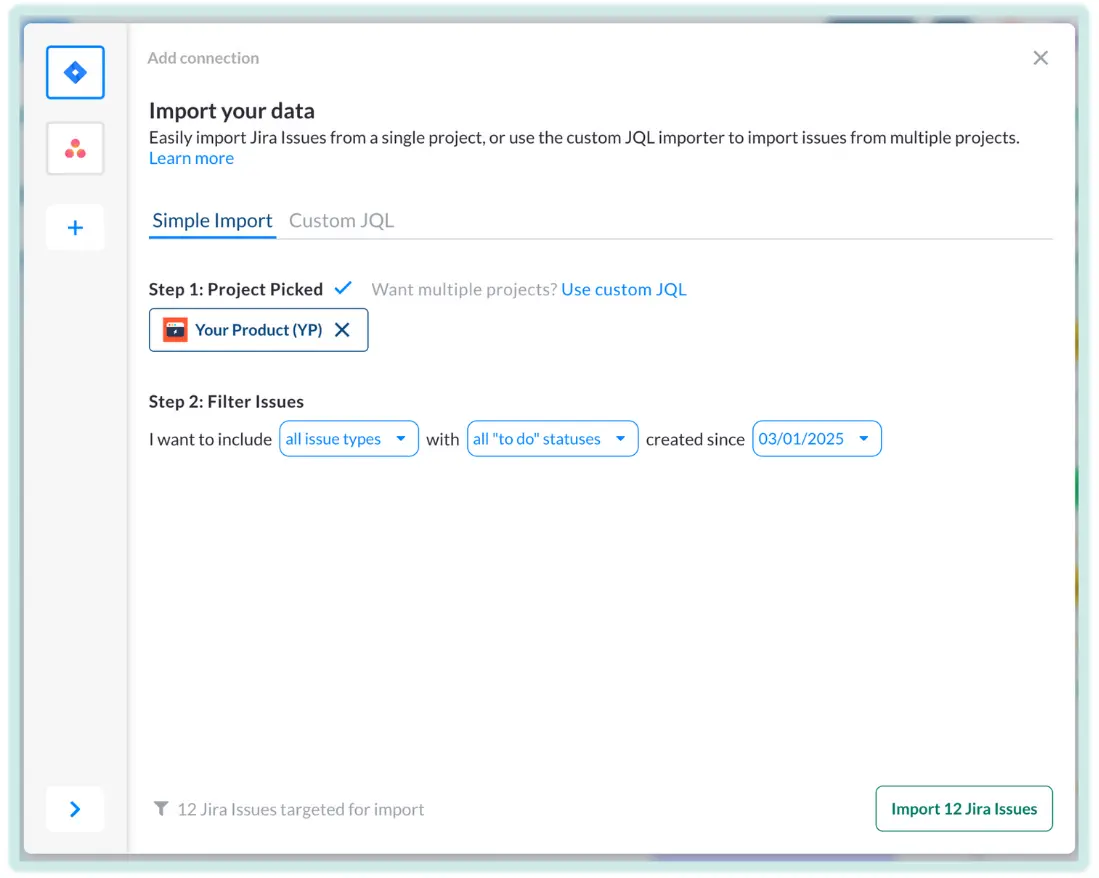
Import project data from apps like Jira and Asana, or add project and task details directly into Visor.
Adjust your plans easily with the drag-and-drop interface, and share real-time, crystal clear visualizations with your teams and stakeholders.
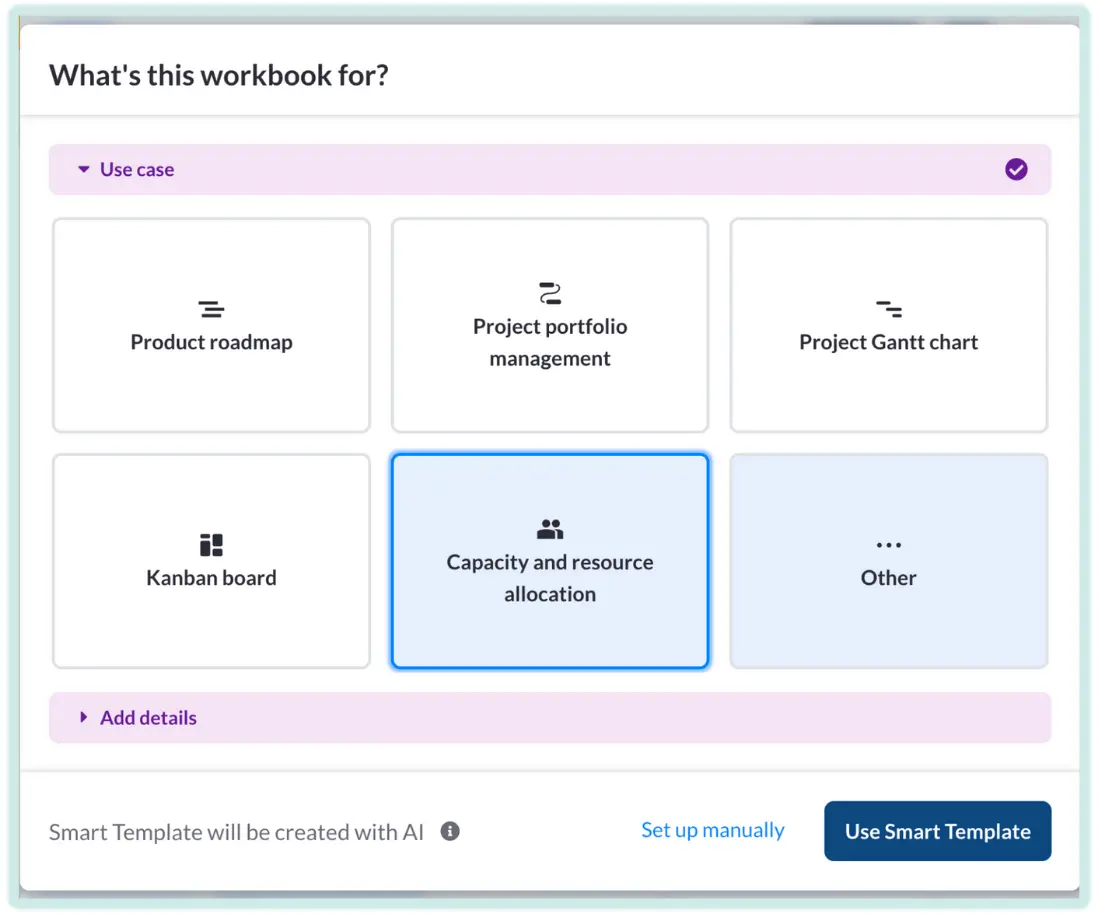
To get started, click the button below and when prompted, select “Use Smart Template.”
Smart capacity planning templates are visualizations configured by AI. Visor’s AI only needs a small amount of information to configure your custom capacity management templates. It gets to work immediately in the background, and creates custom templates for you in a few minutes or less.
“5/5 – Visor is packed with features that are easy to use. It gives team members a clear view of the project timeline and their role in the project.”
Nick B., Small Business Project Manager – G2 Review
“I was looking for a way to link Gantt charts to our Jira projects, but this allows me to do so much more.”
Nick B., Atlassian Reviewer
“I’ve tried just about every roadmapping platform you can think of and Visor is the first one that allows me to roadmap at both the epic and story/issue level.”
Kemper R., Atlassian Reviewer
“Visor’s integrated Gantt chart feature empowers visual project planning, enabling us to track timelines, dependencies, and resource allocation. Five out of five stars!”
Camilla B., Product Manager – G2 Review
“The integration with Jira allows for you to keep a central truth center, but still handle the many use cases teams have for roadmapping and backlog planning.”
Gabby C., Atlassian Reviewer
“Visor for JIRA enhances collaboration and project planning with its intuitive interface and integrated Gantt chart feature.”
Shruti P., Atlassian reviewer
Visor Capacity Planning Templates – Key Benefits:
Import Data From Jira and Other Apps
Visor’s capacity planning templates enable you to manage capacity across multiple projects from apps like Jira, Asana, and Salesforce. Visor’s sophisticated bi-directional integrations enable you to import your data into Visor, preserve its integrity, and easily share plans and updates with all your stakeholders.
Minimal Effort When Planning Capacity and Resources
Generate a full range of customized capacity planning charts and other visualizations easily in just a few minutes. Save time and effort so that you have more time to optimize how resources are deployed across all your projects and teams.
Visor enables you to easily understand, manage, and improve the allocation of capacity and resources across multiple projects, teams, and your entire organization.
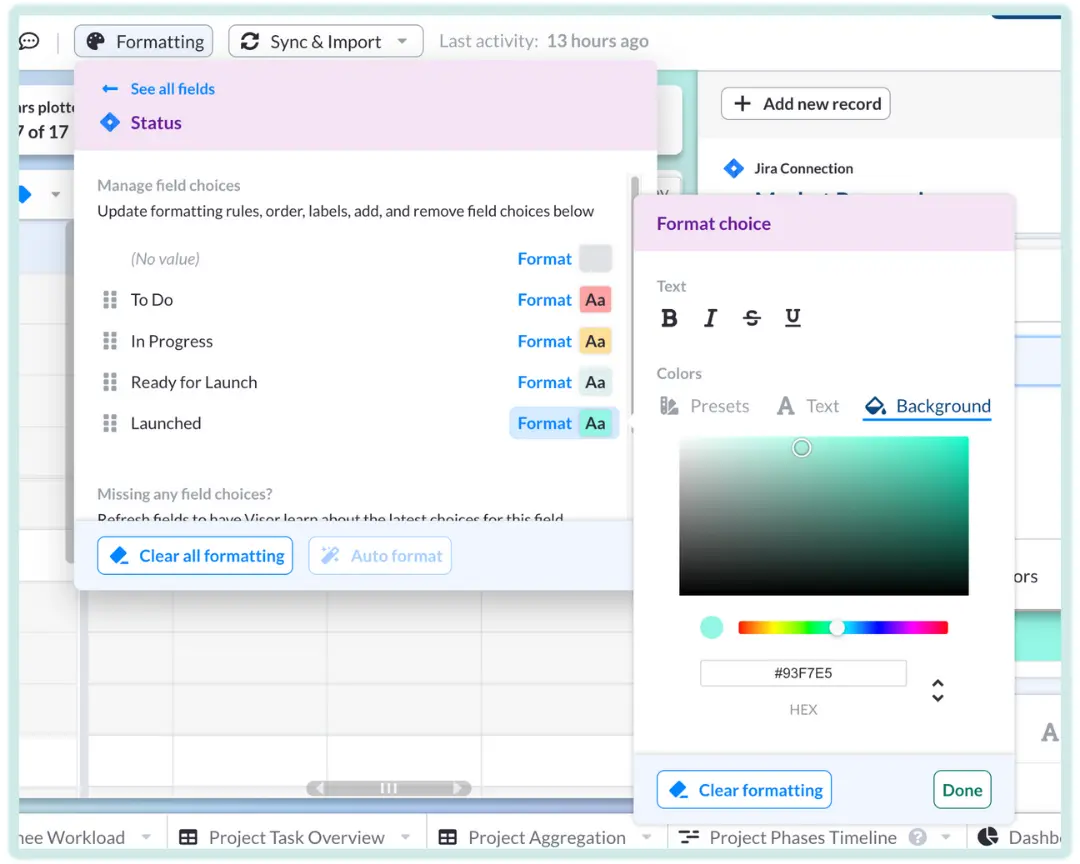
Visor’s AI does the heavy lifting, but you still have full control. You can completely change and customize the capacity planning and resource management charts that the AI produces for you. This means you save time, and reduce manual work, but remain in full control.
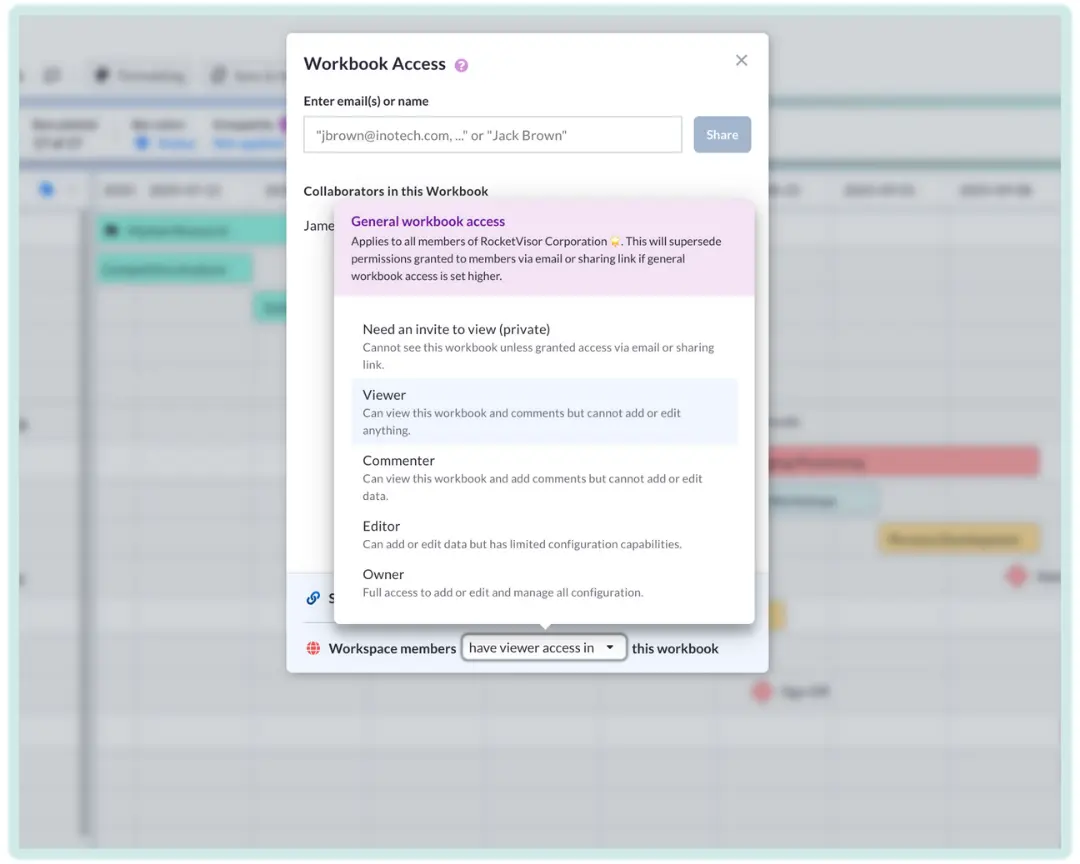
Keep your teams and stakeholders updated at every step with capacity planning charts that stay fresh with real-time data. Share easily using email invites or reusable sharing links, while maintaining complete control over editor and viewer level access.
Use Visor’s Capacity Planning Templates With Existing Data From Your SaaS Apps
Connect Visor to popular SaaS apps or input your project data directly into Visor to create your capacity planning views.
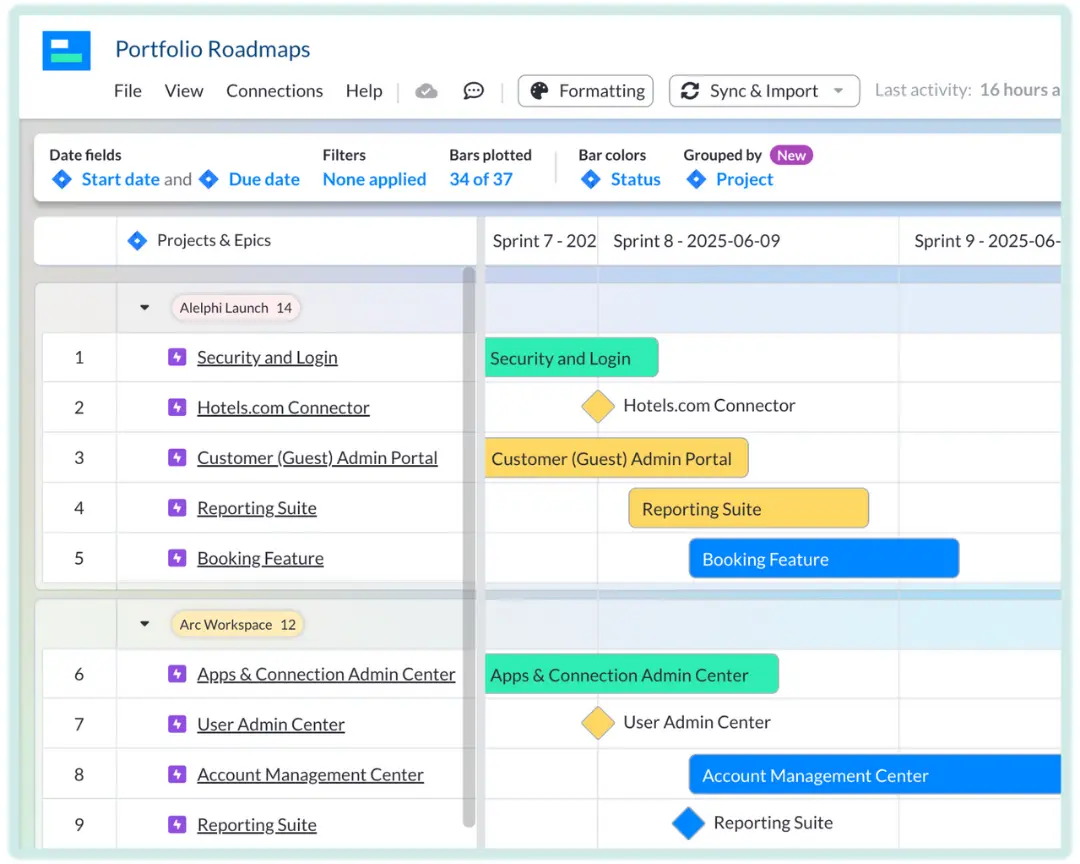
Import nested Jira data (e.g., Epics, Stories/Tasks) in minutes. Visor maintains your data’s structure, allowing you to visualize project plans and push out edits.
Visor pays attention to the details, treating your data exactly as Salesforce does. Import and edit your data, including dropdown field selections and contact names.
Connect, visualize, and update Asana projects including sub-tasks and custom fields. Easily make bulk edits and connect with project data from other apps.
Can I use Visor’s capacity planning template to manage resources and capacity for projects created in Jira, Asana, Salesforce, and other apps?
Yes, Visor has bi-directional integrations with Jira, Asana, Salesforce, Hubspot, and other SaaS apps. You can import a single project or multiple projects from these apps into Visor, and sync updates to and from these apps.
This means you can use Visor’s capacity planning template to:
Get a complete view of resource utilization and availability across your projects in these apps
Manage resources within and across multiple projects from these apps
Share capacity planning charts and other visualizations using data from these apps, with stakeholders that do not have direct access to those apps
Create capacity planning charts that combine projects or other data from multiple apps (for example Jira and Salesforce)
What kind of resource or capacity units can I use in Visor?
In Visor you can use a wide range of resource and capacity units, including custom units. You can add the existing units in projects imported from apps like Jira or Asana. You can also add units using custom fields in Visor itself. Some examples of common resource units used in Visor include:
Hours
Story Points
Effort Score
Days
Other custom resource and capacity units
Can I use custom resource and capacity units in Visor?
Yes, you can use custom resource or capacity units in Visor, either as connected fields from apps like Jira or Asana, or as custom fields within Visor itself.
This enables you to:
Plan and manage capacity using multiple unit types simultaneously (for example hours, effort, days, or scoring systems).
Use varying capacity units for different projects or resource types
Can I nest tasks, subtasks, and create other parent-child relationships in capacity management template?
Yes, in Visor you have full task nesting and hierarchization capabilities. In practice this means you can easily nest a task under another task. This makes the nested task a “child” and subtask of the task it is nested under. You can create additional levels of task hierarchy to add subtasks of subtasks and so on.
You can nest and un-nest tasks easily using drag-and-drop or keyboard shortcuts.
This enables you to view and manage capacity at a parent task level (for example an epic) and at individual task and subtask levels when required. It gives you the ability to take a micro or macro approach to managing capacity in each project or set of projects.
What time increments can I use in the capacity planning template?
In Visor you can view your capacity planning charts by a range of time increments, including:
Weeks & Days
Sprints & Days
Months & Days
Months & Weeks
Quarters & Weeks
Quarters & Months
Years & Months
It is easy to set and change these date ranges. You can also create multiple versions of your capacity planning charts using different date ranges. This is great when you (or different stakeholders) need a mix of longer term, higher level views, and shorter term, more detailed views of your projects and their progress.
Can I create dashboards in Visor to complement my capacity management charts?
Yes, Visor’s Dashboard View enables you to create custom dashboards to give you an overview of capacity and resource management across your projects, teams, or organization, and to help you identify bottlenecks, areas where extra resource should be deployed, or where there is excess resource which could be better deployed elsewhere.
Dashboards in Visor are easy to setup, with a neat drag-and-drop interface, and an advanced filter builder to help you create charts with the level of precision you need. You can create multiple dashboards per workbook, enabling you to create dashboards using the same projects data for different purposes. Here are some common examples of dashboards created in Visor to help with resource and capacity planning
What are some common examples of dashboards users create in Visor to help with resource and capacity planning?
Here are a few common examples of dashboards created in Visor to help with resource and capacity planning:
Team utilization trackers
Portfolio/program resource allocation
Task resource vs. load tracker
Capacity by team and team member
Visor’s Dashboard View is easy to use and customize, enabling you to create your own bespoke capacity planning and resource management dashboards.
What other view types can I use in Visor to help me manage my projects and portfolios of projects?
In Visor you can use all of these view types:
Gantt charts
Roadmaps
Table or spreadsheet views
Kanban views
Dashboard views
Can I use Visor’s capacity planning template to track and balance capacity across multiple projects?
Yes, Visor is essentially easy-to-use project portfolio management software. It enables you to create crystal clear visualizations of multiple projects in a range of formats, including Gantt charts, Kanban boards, timeline views, dashboards and more.
These views can be used to track the progress of multiple projects, share updates with stakeholders, and plan and balance capacity across multiple projects.
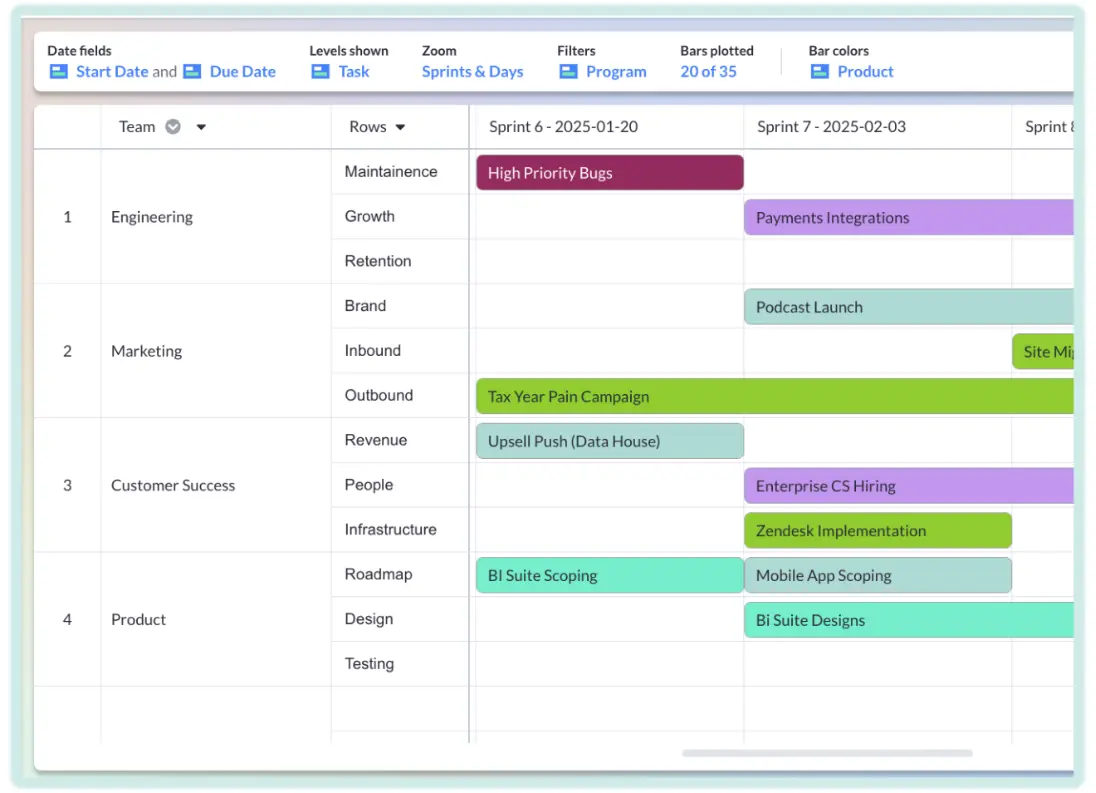
In Visor visualizations that include multiple projects (for example, Gantt charts or timelines) you can group tasks from all your projects by assignee, team, resource type, skillsets, and other relevant criteria. This enables you to take a high-level and holistic approach to capacity management and resource allocation across multiple projects, teams, or your entire organization.
Can I use Visor’s capacity planning template to create varying views for different stakeholders?
Yes, using Visor you can easily create multiple versions of your capacity planning charts that are tailored to different audiences using the same real-time data.
Creating multiple – but synchronized – versions of your capacity plans enables you to ensure that you have the best view possible for specific teams, stakeholders, or purposes (such as project review meetings, CEO presentations, or resource management).
Some of the attributes you can modify to create multiple custom project tracking views include:
“Zoom” or Timescale: Quarters and months for your executive board and days and weeks for your project team.
Data Groupings: Group data by the assignee for your team views and by the strategic initiative for your executive board
Levels of Task: Choose to show all task levels for personal views, epics to tasks for team views, and epics only for senior stakeholder views
Creating multiple views for different team members, teams, stakeholders, or purposes is quick and easy. All views are synchronized and use the same underlying data source, which means you can have many different views of your projects without having to manually reorganize or update data.
Can I use Visor’s capacity planning template for free?
Yes, upon registering you will have a 14-day free trial of Visor’s Team plan, giving you access to all of Visor’s premium visualization types. After this trial period you can choose to select a Team or Starter plan, or continue on the Visor Free plan.
Why is using an AI Smart Template to create capacity planning charts better than creating your own plans from scratch or using generic templates?
Smart Templates in Visor are powered by AI, which uses your data, your prompts, and its learnings from thousands of human-created visualizations.
This enables it to produce capacity planning charts and other visualizations infused with best practices and fully customized to your precise requirements and objectives.
The difference between Smart Templates and regular templates to create your capacity planning charts is akin to the difference between wearing a finely tailored, top-of-the-line suit to an ill-fitting, under-sized, off-the-rack shabby suit and trying to make it fit like the professionally tailored version – it’s possible. Still, it will take you lots of time, effort, trial-and-error, and frustration to get there.
Using Smart Templates to create capacity planning charts gets you off to the best possible start, saves you hours per chart created, and saves you heaps of frustration. It’s a genuine game-changer in your ability to plan, visualize, and track your projects.
What other templates are available in Visor?
Visor has a wide range of templates, which you can find in our Templates Library.
Templates in Visor are generated by AI based on your responses to a short series of questions, which enable the AI to understand what you are trying to achieve and produce a ready-configured template to suit your needs. This means that you are not limited to the set of templates we offer in our library, as the AI can meet needs that we haven’t listed or even considered.
How do I access AI-powered Smart Templates in Visor?
When you first log in to Visor, after entering your email address and how you want to use Visor, you will see a screen that asks, “What is this workbook for?” On this screen, there is a “Use Smart Template” button.
You can then pick from a range of popular template categories, or click “Other” to ask the AI to create something different to the available options. You can use the free text box to supply additional information to help the AI create a set of visualizations (or templates) that will best meet your needs.
To access Smart Templates if you already have a Visor account, simply click the New Workbook button within an existing workbook, or Create a new workbook from the workbook list screen. Then when you’re asked “What is this workbook for?” click the “Use Smart Template” button.
Are you ready to begin?
Visor is secure, free, and doesn't require a credit card.
To provide the best experiences, we use technologies like cookies to store and/or access device information. Consenting to these technologies will allow us to process data such as browsing behavior or unique IDs on this site. Not consenting or withdrawing consent, may adversely affect certain features and functions.
Functional Always active
The technical storage or access is strictly necessary for the legitimate purpose of enabling the use of a specific service explicitly requested by the subscriber or user, or for the sole purpose of carrying out the transmission of a communication over an electronic communications network.
Preferences
The technical storage or access is necessary for the legitimate purpose of storing preferences that are not requested by the subscriber or user.
Statistics
The technical storage or access that is used exclusively for statistical purposes.The technical storage or access that is used exclusively for anonymous statistical purposes. Without a subpoena, voluntary compliance on the part of your Internet Service Provider, or additional records from a third party, information stored or retrieved for this purpose alone cannot usually be used to identify you.
Marketing
The technical storage or access is required to create user profiles to send advertising, or to track the user on a website or across several websites for similar marketing purposes.
To provide the best experiences, we use technologies like cookies to store and/or access device information. Consenting to these technologies will allow us to process data such as browsing behavior, to improve the performance of this website.
Functional Always active
The technical storage or access is strictly necessary for the legitimate purpose of enabling the use of a specific service explicitly requested by the subscriber or user, or for the sole purpose of carrying out the transmission of a communication over an electronic communications network.
Preferences
The technical storage or access is necessary for the legitimate purpose of storing preferences that are not requested by the subscriber or user.
Statistics
The technical storage or access that is used exclusively for statistical purposes.The technical storage or access that is used exclusively for anonymous statistical purposes. Without a subpoena, voluntary compliance on the part of your Internet Service Provider, or additional records from a third party, information stored or retrieved for this purpose alone cannot usually be used to identify you.
Marketing
The technical storage or access is required to create user profiles to send advertising, or to track the user on a website or across several websites for similar marketing purposes.