Use Visor’s AI-powered Gantt chart tool to plan, track, and share your projects and portfolios in perfect clarity. Import multiple projects from apps like Jira and share with all your stakeholders, to keep them updated effortlessly.
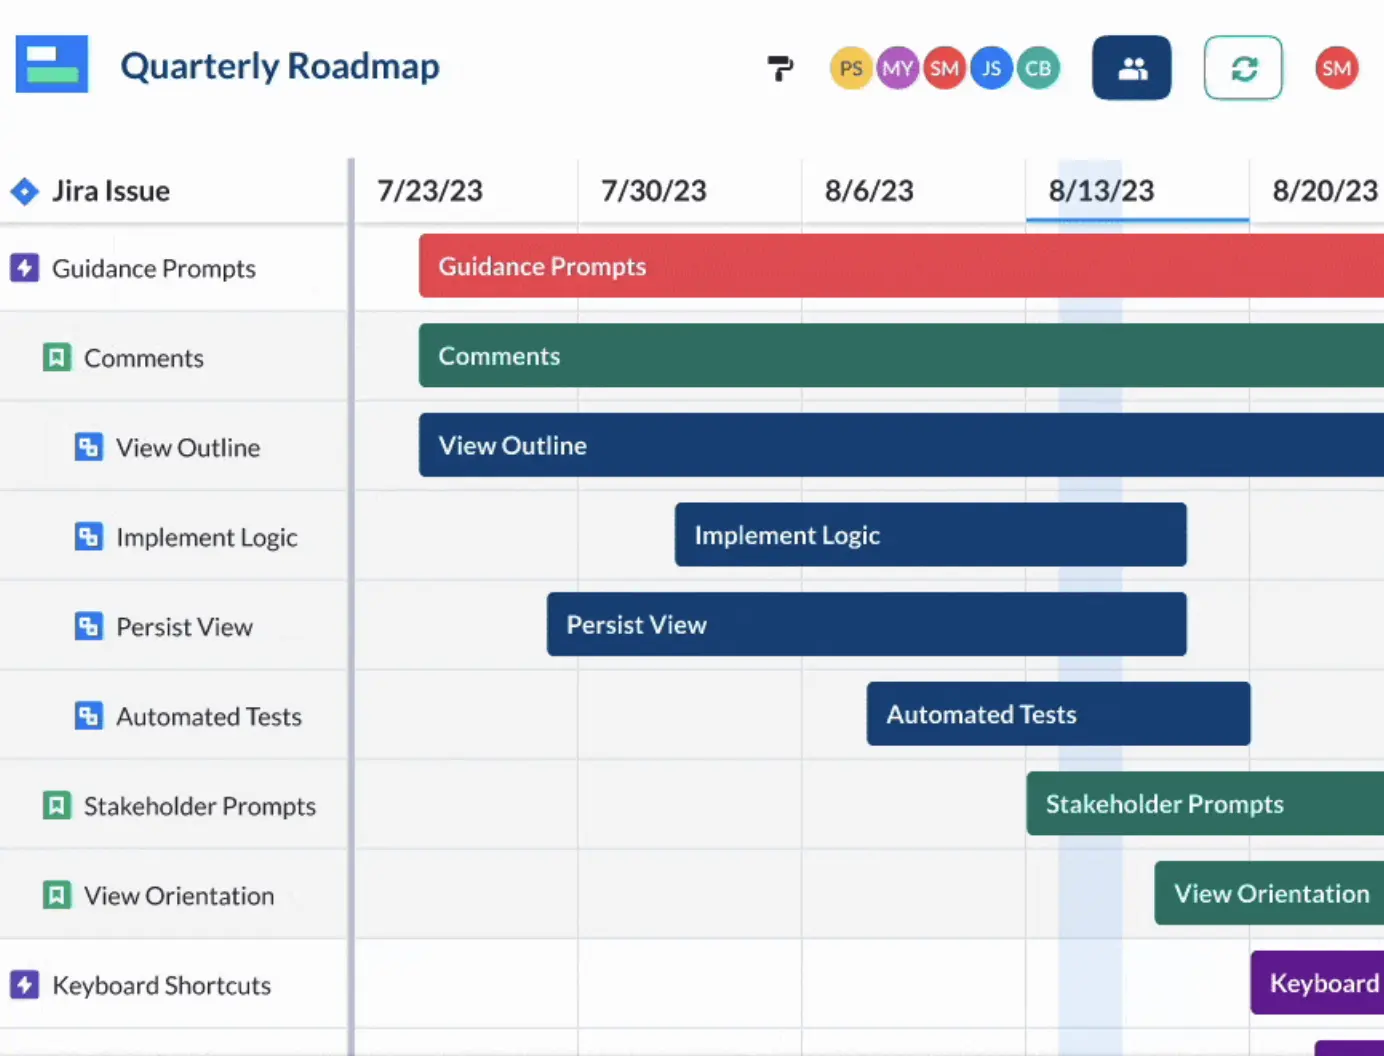
Import multiple projects from apps like Jira and Asana to quickly create professional and fully customizable Gantt charts. Visor’s simple drag-and-drop interface saves time and makes adding milestones painless.
Visor’s AI-powered templates use a few simple questions to create Gantt charts using your data, tailored to the precise tasks and objectives you need to accomplish. Visor AI works at light speed to reclaim hours that your team can dedicate to more valuable activities.
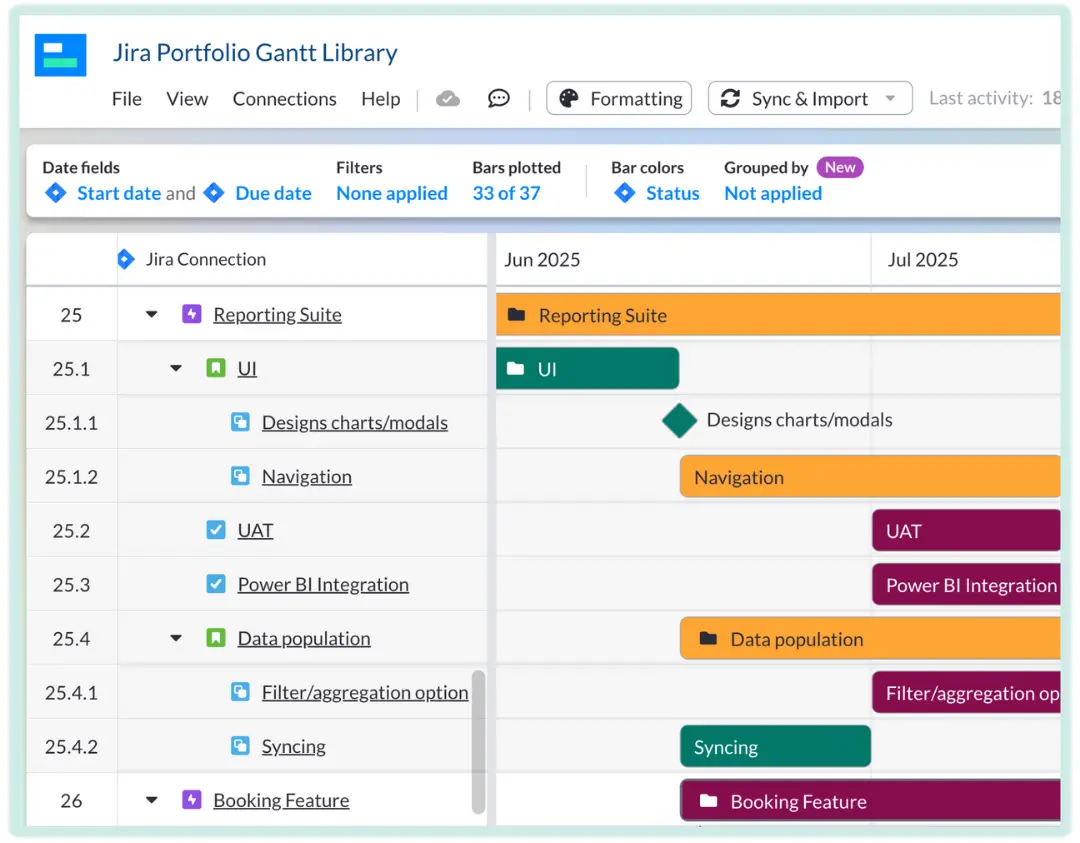
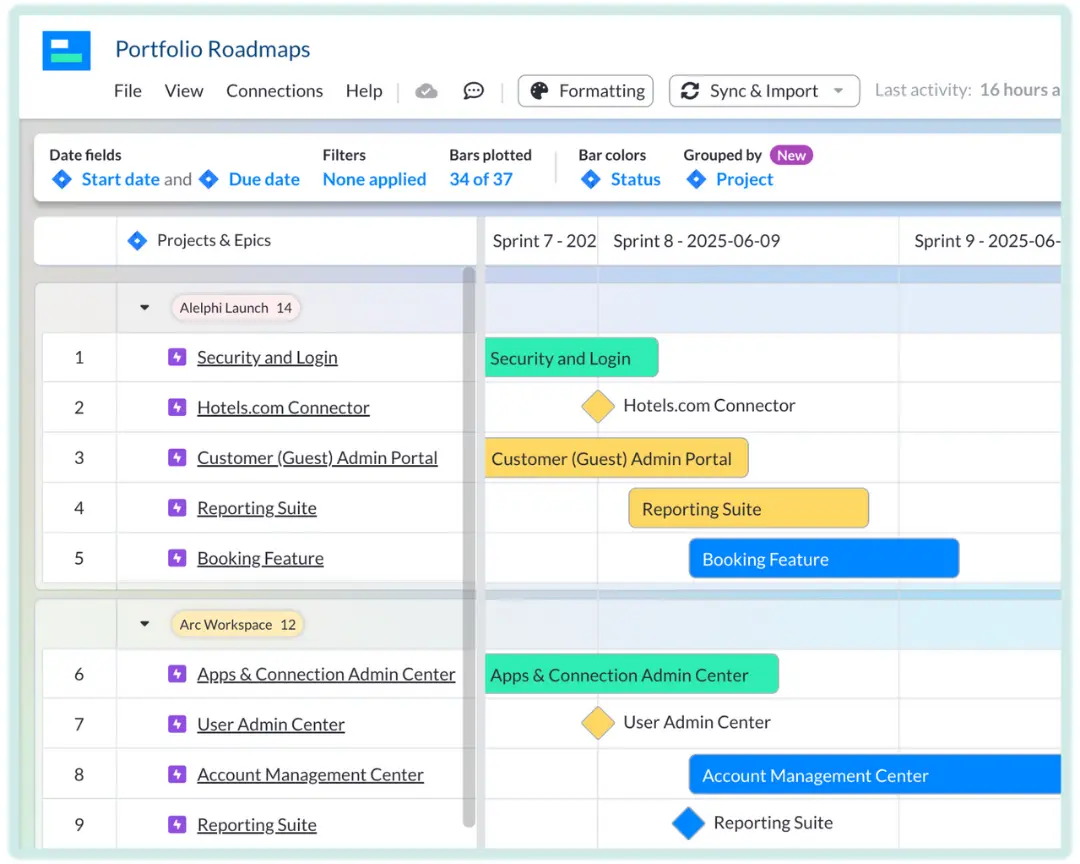
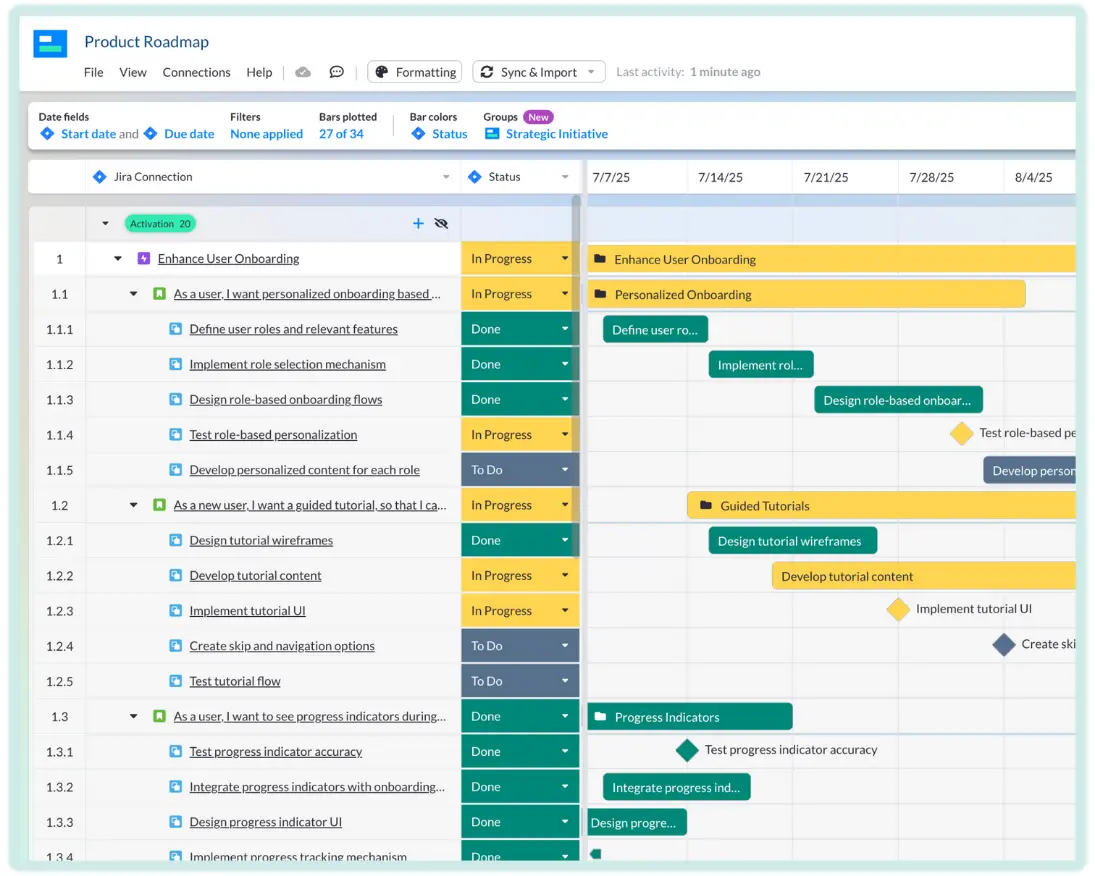
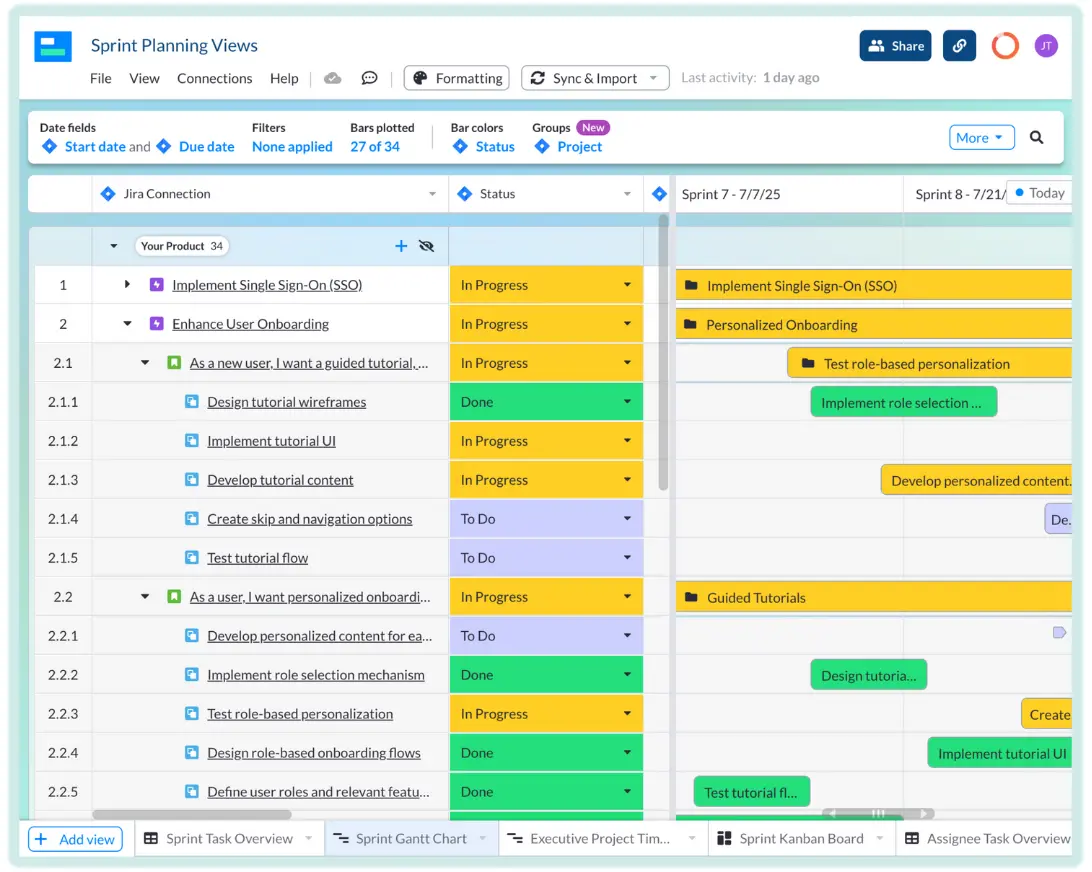
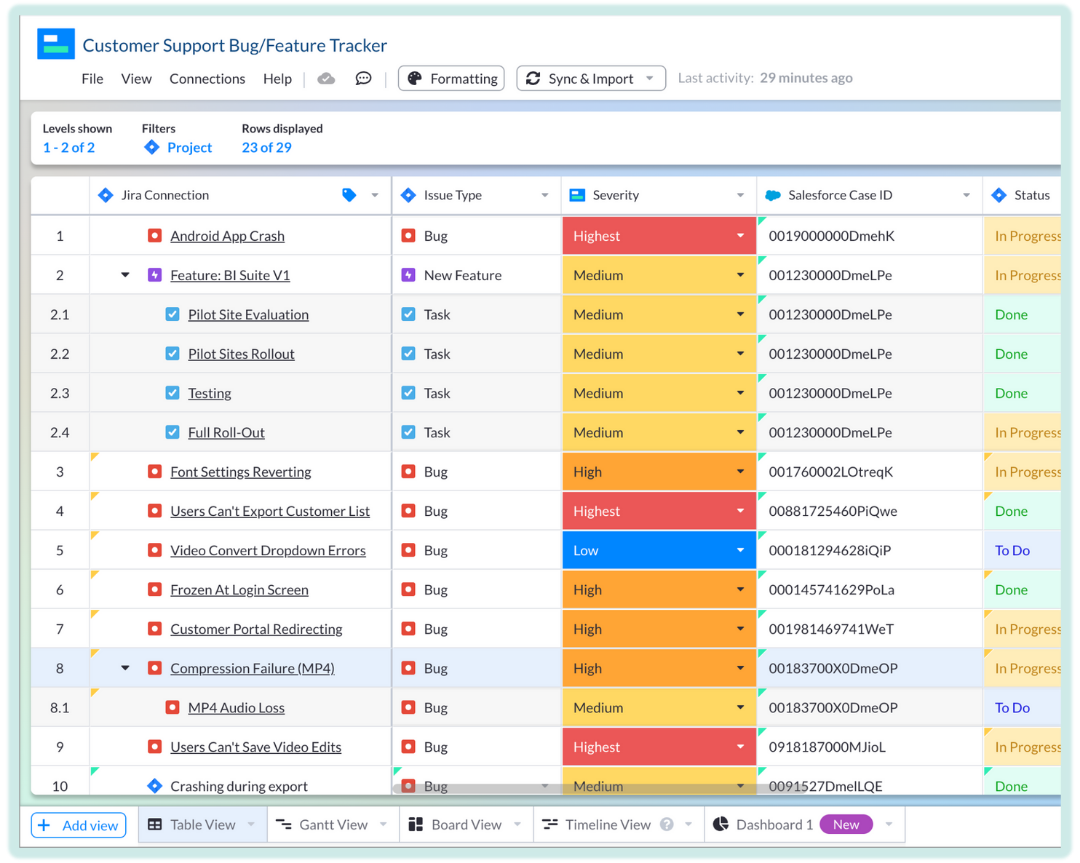
Easily nest projects, epics, tasks, subtasks and more, to create hierarchies as deep or flat as you need. Preserve your existing hierarchies from apps like Jira, or create fully flexible groupings from scratch.
Add conditional formatting to make your Gantt charts engaging and easy to understand. Apply filtering to show the level of detail you want others to see. When you’re done, share with anyone you please.
Connect Visor to popular SaaS apps or input your project data directly into Visor.
Import nested Jira data (e.g., Epics, Stories/Tasks) in minutes. Visor maintains your data’s structure, allowing you to visualize project plans and push out edits.
Visor pays attention to the details, treating your data exactly as Salesforce does. Import and edit your data, including dropdown field selections and contact names.
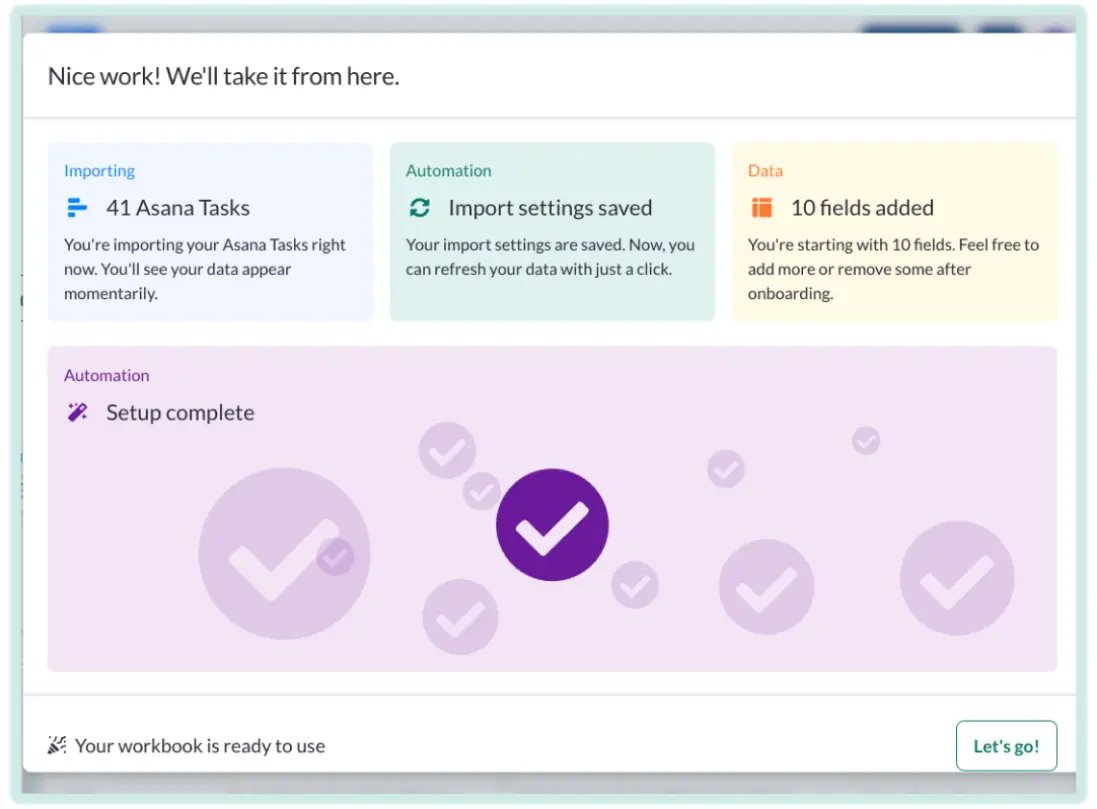
Connect, visualize, and update Asana projects including sub-tasks and custom fields. Easily make bulk edits and connect with project data from other apps.
Easily adjust the depth, time frame, and detail shown on each Gantt chart view. Apply filters to share a high-level view or highly detailed project plans.
Visor’s spreadsheet-inspired workspace makes it easy to update tasks and timeframes quickly. Spend more time driving projects forward and less time updating data. Visor also syncs with other apps so you can share data with confidence.
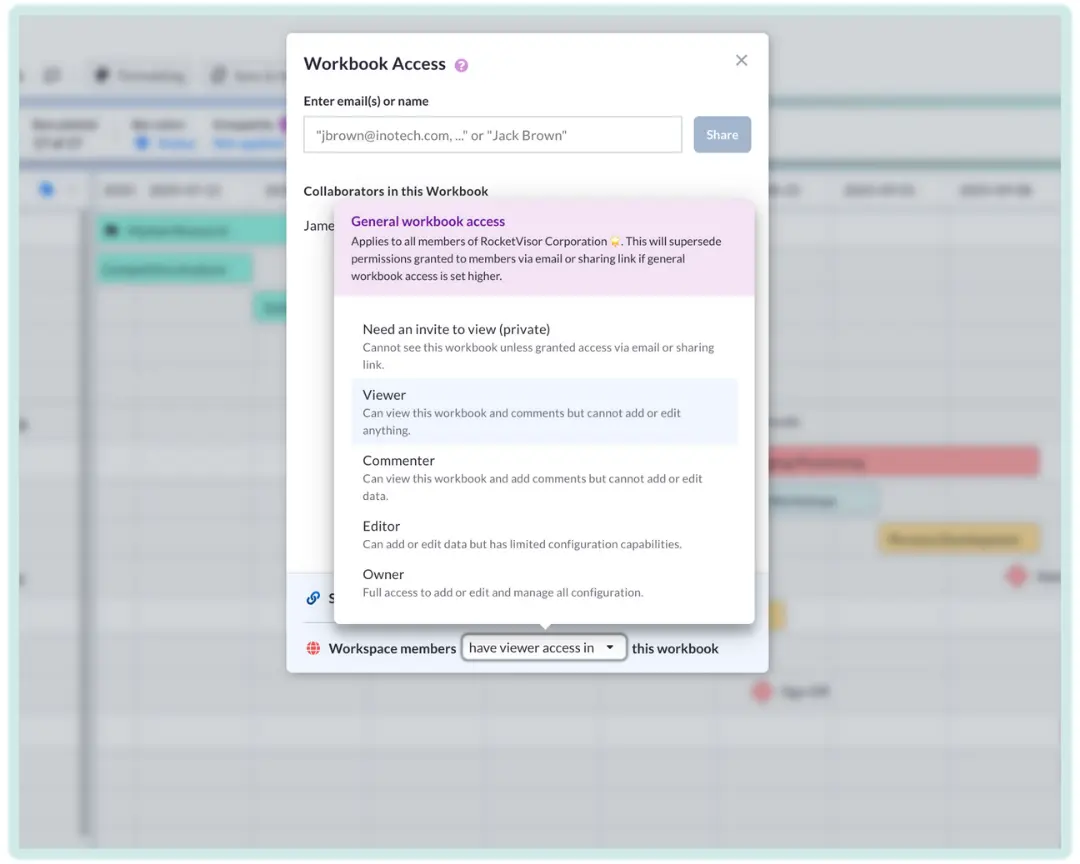
Share Gantt charts and reports with ease. Hide or lock fields and data, add comments, and change detail levels to tailor views to different stakeholders.
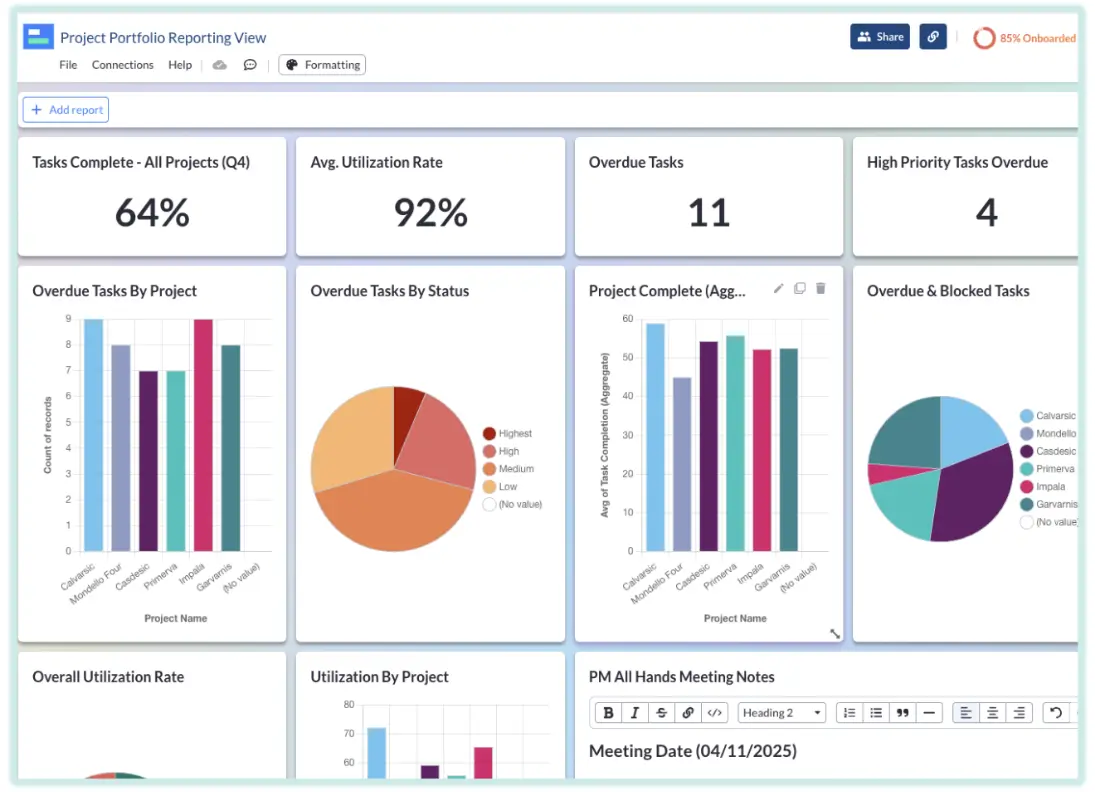
A Built-in Dashboard view uses data from your Gantt charts and connected apps, providing the insights you need to identify blockers, spot issues early, and improve project and team performance.
It’s secure, free, and doesn’t require a credit card.
Visor Gantt Chart Maker FAQs
How do Visor’s AI Smart Templates for Gantt charts work?
Using your data and a few simple prompts from you, Visor’s AI will create a series of visualizations based on your requirements and what you are trying to accomplish. These view types include Gantt charts, roadmaps, timeline charts, Kanban boards, and table views.
Smart Templates are already color formatted, named, and configured. You can of course make any changes and customizations you want. The key here is that AI is doing the heavy lifting for you and your team. It is automating those tasks that eat up your time and slow you down.
This saves huge amounts of time – hours per each view created – and effort, across each member of your team, which you can reinvest into higher-value work that will help you achieve your strategic goals faster.
What makes Visor’s Gantt chart maker better than others?
Visor’s Gantt charts give you the flexibility and professional look of the highest end Gantt charts without the difficulty or fragility. Visor makes creating impressive Gantt charts easy and fast.
You can customize Gantt charts using color, custom fields, and custom hierarchies. You can also create Gantt charts using synchronized data from apps like Jira, Asana, and Salesforce, giving you improved visualization options in comparison to these app’s native Gantt features – at a much better value!
Unlimited view-only licenses makes sharing easy and worry free. You can create different versions of your Gantt chart for different audiences, while the underlying data all stays in sync so you only have to make any change one time.
Can I add calculations (or “rollups”) to Gantt charts I create in Visor?
Yes! You can add calculated “rollup” fields to your Visor Gantt charts based on any number or date field. This enables you to show important, high-level information on your Gantt chart, such as:
Total number of hours for an initiative (or other group of tasks and subtasks)
Average days to complete tasks by assignee
Total number of hours remaining to complete all the tasks and subtasks under an initiative/epic or other task grouping
Earliest start and latest end date for subtasks under a task
And much more. Unlike other Gantt chart tools, Visor allows you to add rollup calculations for any date or number field, including secondary date fields like planned start dates, review dates, and so on.
Visor empowers you to create Gantt charts that calculate the data points that are most important to you without clumsy and clunky workarounds or compromises, which means planning and tracking a diverse range of projects, programs, and portfolios is easier and more effective.
Can I add milestones to my Gantt chart?
Yes! In Visor you can add milestones to any item on your Gantt chart, including tasks and sub-tasks. You can add conditional formatting to color code milestones and make them stand out. You can also filter Gantt charts to just show milestones, or milestones at a certain level (for example task or project milestones only).
Can I visualize multiple projects together on a single Visor Gantt chart?
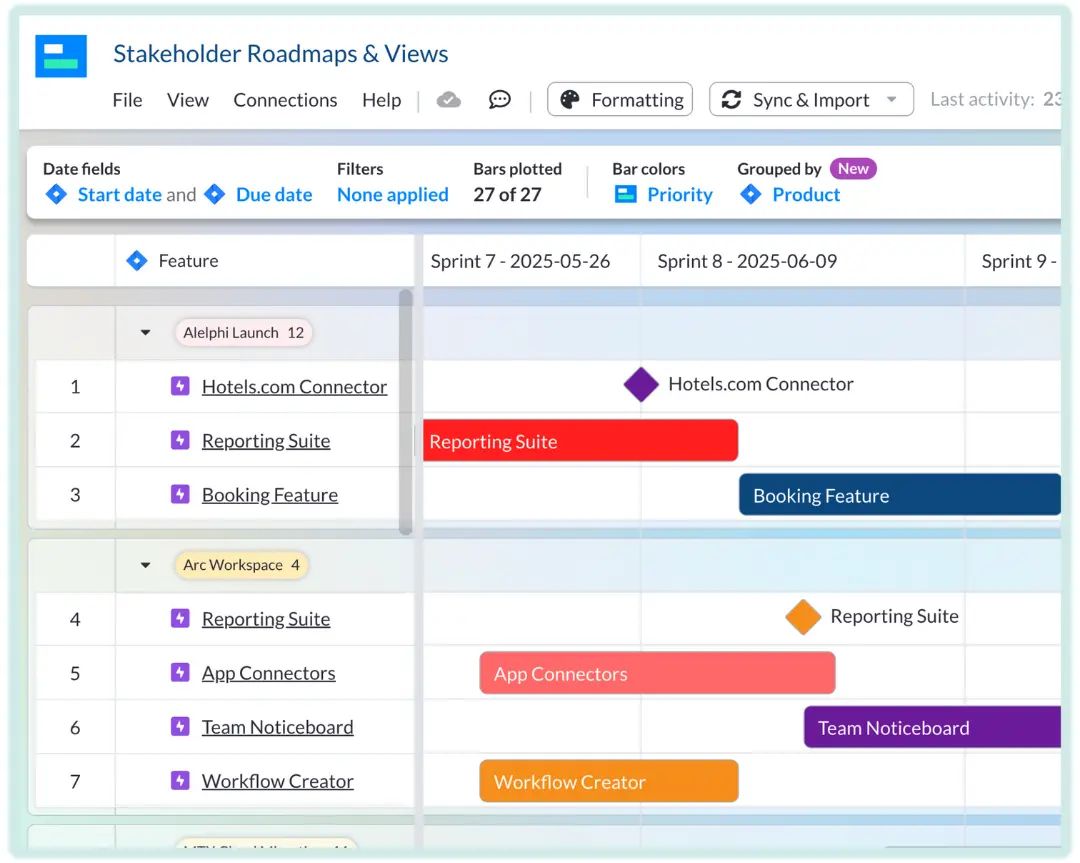
Yes, you can add multiple projects (from Visor or from apps like Jira, Asana, and Salesforce), into a single Gantt chart in Visor. This is also known as a project portfolio Gantt chart.
What is a project portfolio Gantt chart?
Portfolio Gantt charts are used in project portfolio management (PPM) to visualize an entire portfolio of projects on a single Gantt chart. Portfolio Gantt charts are used to take a high-level view of all the projects in a portfolio, to assess plans, balance resources, optimize project scheduling, and track project progress or performance.
Can I use Visor to create project portfolio Gantt charts and roadmaps?
Yes, Visor is equipped for you to easily create project portfolio Gantt charts and roadmaps. You can input project data directly in Visor, or import and synchronize project data from apps like Jira, Asana, and Salesforce.
How do I share Visor Gantt charts with other people?
Gantt charts in Visor can be shared via an email invitation, or using sharable links. The sharable links can be reused again and again, making sharing easy. Visor’s Team and Individual plans include unlimited view-only licenses so that sharing your Gantt charts is both easy to do and economical.
Is there a charge to share with others?
No, Visor’s Team and Starter plans give you unlimited view-only access, so that you can share your Gantt chart with colleagues and stakeholders with no additional license fees.
Can I use data from other apps like Jira, Asana, and Salesforce?
Yes, Visor has two-way integrations with Jira, Asana, Salesforce, Hubspot and other popular SaaS apps. This means you can create Gantt charts based on real-time data from tasks and multiple projects in all of these apps. Visor’s two-way integrations keep your Gantt chart updated with any new data, and you can choose to push updates back into your source apps, or keep things separated. The choice is yours!
Can I add custom fields and columns to Gantt charts in Visor?
Yes, in Visor, you can create custom fields using a range of different field types, including drop-down, number, plain text, date/time, and more. You can use Visor custom fields (or imported fields from your connected apps like Jira and Asana) both to record data and as the primary label in your Gantt charts.
Do Visor Gantt Charts Support Task Dependencies?
Visor currently supports the visualization of all Jira linked issues.
The creation and management of dependencies within Visor is coming soon! Watch our roadmap for more info.
What color coding options do I have?
You can use any color scheme you want on your Gantt chart. Choose from a selection of pre-sets, or create your own color palette using color sliders or Hex codes. Keep things on-brand, or unique. In Visor you can make your Gantt chart match.your vision because the color coding options are truly limitless.
Verified Visor Reviews:
“I was looking for a way to link Gantt charts to our Jira projects, but this allows me to do so much more.”
Nick B., Atlassian Reviewer
“I’ve tried just about every roadmapping platform you can think of and Visor is the first one that allows me to roadmap at both the epic and story/issue level.”
Kemper R., Atlassian Reviewer
“The integration with Jira allows for you to keep a central truth center, but still handle the many use cases teams have for roadmapping and backlog planning.”
Gabby C., Atlassian Reviewer
“Visor for JIRA enhances collaboration and project planning with its intuitive interface and integrated Gantt chart feature.”
Shruti P., Atlassian reviewer
Are you ready to begin?
Visor is secure, free, and doesn't require a credit card.
To provide the best experiences, we use technologies like cookies to store and/or access device information. Consenting to these technologies will allow us to process data such as browsing behavior or unique IDs on this site. Not consenting or withdrawing consent, may adversely affect certain features and functions.
Functional Always active
The technical storage or access is strictly necessary for the legitimate purpose of enabling the use of a specific service explicitly requested by the subscriber or user, or for the sole purpose of carrying out the transmission of a communication over an electronic communications network.
Preferences
The technical storage or access is necessary for the legitimate purpose of storing preferences that are not requested by the subscriber or user.
Statistics
The technical storage or access that is used exclusively for statistical purposes.The technical storage or access that is used exclusively for anonymous statistical purposes. Without a subpoena, voluntary compliance on the part of your Internet Service Provider, or additional records from a third party, information stored or retrieved for this purpose alone cannot usually be used to identify you.
Marketing
The technical storage or access is required to create user profiles to send advertising, or to track the user on a website or across several websites for similar marketing purposes.
To provide the best experiences, we use technologies like cookies to store and/or access device information. Consenting to these technologies will allow us to process data such as browsing behavior, to improve the performance of this website.
Functional Always active
The technical storage or access is strictly necessary for the legitimate purpose of enabling the use of a specific service explicitly requested by the subscriber or user, or for the sole purpose of carrying out the transmission of a communication over an electronic communications network.
Preferences
The technical storage or access is necessary for the legitimate purpose of storing preferences that are not requested by the subscriber or user.
Statistics
The technical storage or access that is used exclusively for statistical purposes.The technical storage or access that is used exclusively for anonymous statistical purposes. Without a subpoena, voluntary compliance on the part of your Internet Service Provider, or additional records from a third party, information stored or retrieved for this purpose alone cannot usually be used to identify you.
Marketing
The technical storage or access is required to create user profiles to send advertising, or to track the user on a website or across several websites for similar marketing purposes.