Visor Sunset: Your Questions Answered & Data Export Instructions

Start using Visor today
- Visualize all your projects and data

- Roll up multiple projects into portfolio views
- Try Visor for FREE
On July 31, 2026, Visor will shut down as part of our company’s transition to MCP Manager under Usercentrics. We know this is disruptive, and we want to make this as straightforward as possible for you. Below you’ll find answers to the most common questions we expect you to have
FAQs
Billing & Refunds
- I’m on a monthly plan. What happens to my billing?
Your monthly subscription will continue as normal until you cancel or until we cancel it on July 31, 2026. If you’d like to cancel before then, see the cancellation instructions below. - I’m on a monthly plan. How can I cancel it?
You can log into your Visor account and go to “Settings” and then “Plan and Usage” (also at this link). You can fill out the “Account Change Request Form” (see below) to cancel your monthly subscription. - I’m on an annual plan. How can I cancel it?
We have already turned off auto-renewal for your annual plan. You will not get charged again. You do not need to take further steps to ensure that auto-renewal is off. - I’m on an annual plan that ends after July 31, 2026. How can I get a refund?
If your annual subscription is set to renew after July 31, 2026, we will issue you a partial refund for the unused part of your subscription within a week of Visor’s sunset date.
Data Access
- My annual plan ends before July 31, 2026. How long can I access my data for?
You will retain full paid access at the same level of your subscription through the sunset date at no additional charge. - What happens to my data after July 31, 2026?
We are following GDPR compliance and will delete or anonymize your data after the sunset date. - Where can I export my data before the sunset date?
We have a guide to exporting your data below.
The Guide to Exporting Your Visor Workbook Data
If you take nothing else from this guide: go to the Table view in your workbooks and export a CSV. This is the fastest, most complete way to preserve your data (assuming you remove all filters), regardless of which views you’ve been working in day-to-day.
A CSV export from the Table view will capture all of your data in a clean, portable format you can open in Google Sheets, Excel, or import into another tool. The same is not true for all the other views.
| View | CSV (Recommended) | Full View PDF | Snapshot PDF / PNG / JPG |
|---|---|---|---|
| Table | ✅ | ❌ | ✅ |
| Gantt | ✅ | ✅ (paid customers) | ✅ |
| Timeline | ❌ | ❌ | ✅ |
| Board | ❌ | ❌ | ✅ |
| Dashboard | ❌ | ❌ | ✅ |
Table View — Best for Complete Data Export
The Table view is the backbone of every Visor workbook. It displays your records in a familiar spreadsheet-style layout, and it’s where you’ll get the most complete, usable export of your data.
Available export formats: CSV, PDF, PNG, JPG
Note: Make sure filters are off to export the full dataset for .csv exports (which is the recommended export option.)
What to know about each format:
- Recommended: The CSV export is your best option for preserving all of your data. It captures every record in your workbook, including rows hidden by filters or collapsed hierarchy levels, in a clean tabular format. Color-coding does not carry over, but all your field values do. Make sure filters are turned off to export the fill dataset.
- Other options: The PDF, PNG, and JPG exports will render your Table view visually, similar to what you see on screen. Keep in mind these formats only capture what’s currently visible — if your table extends beyond your screen width, some columns may be cut off.
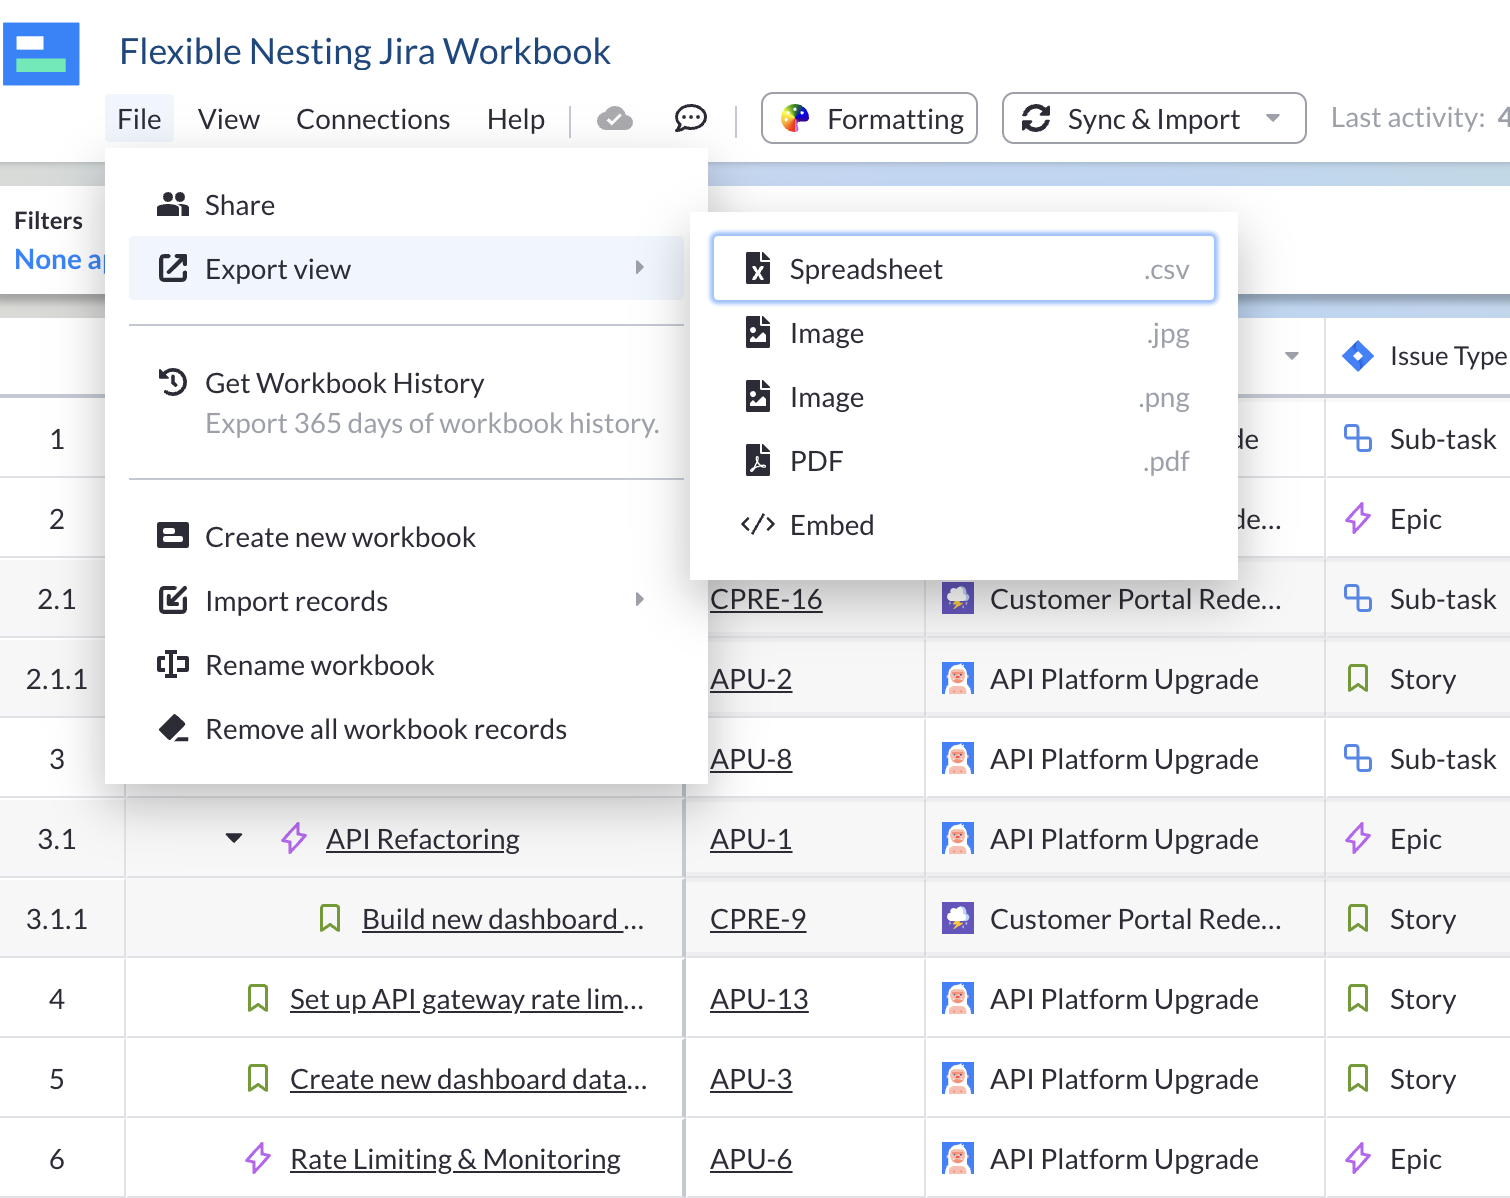
How to export:
- Open the File menu
- Click Export View
- Choose your format: Spreadsheet (.csv), PDF, Image (.jpg), or Image (.png)
If you’re connected to Jira:
Your CSV will include all your imported Jira data. If you want to continue working with that data in a spreadsheet that stays in sync with Jira, consider JXL or Jira Cloud for Google Sheets as alternatives.
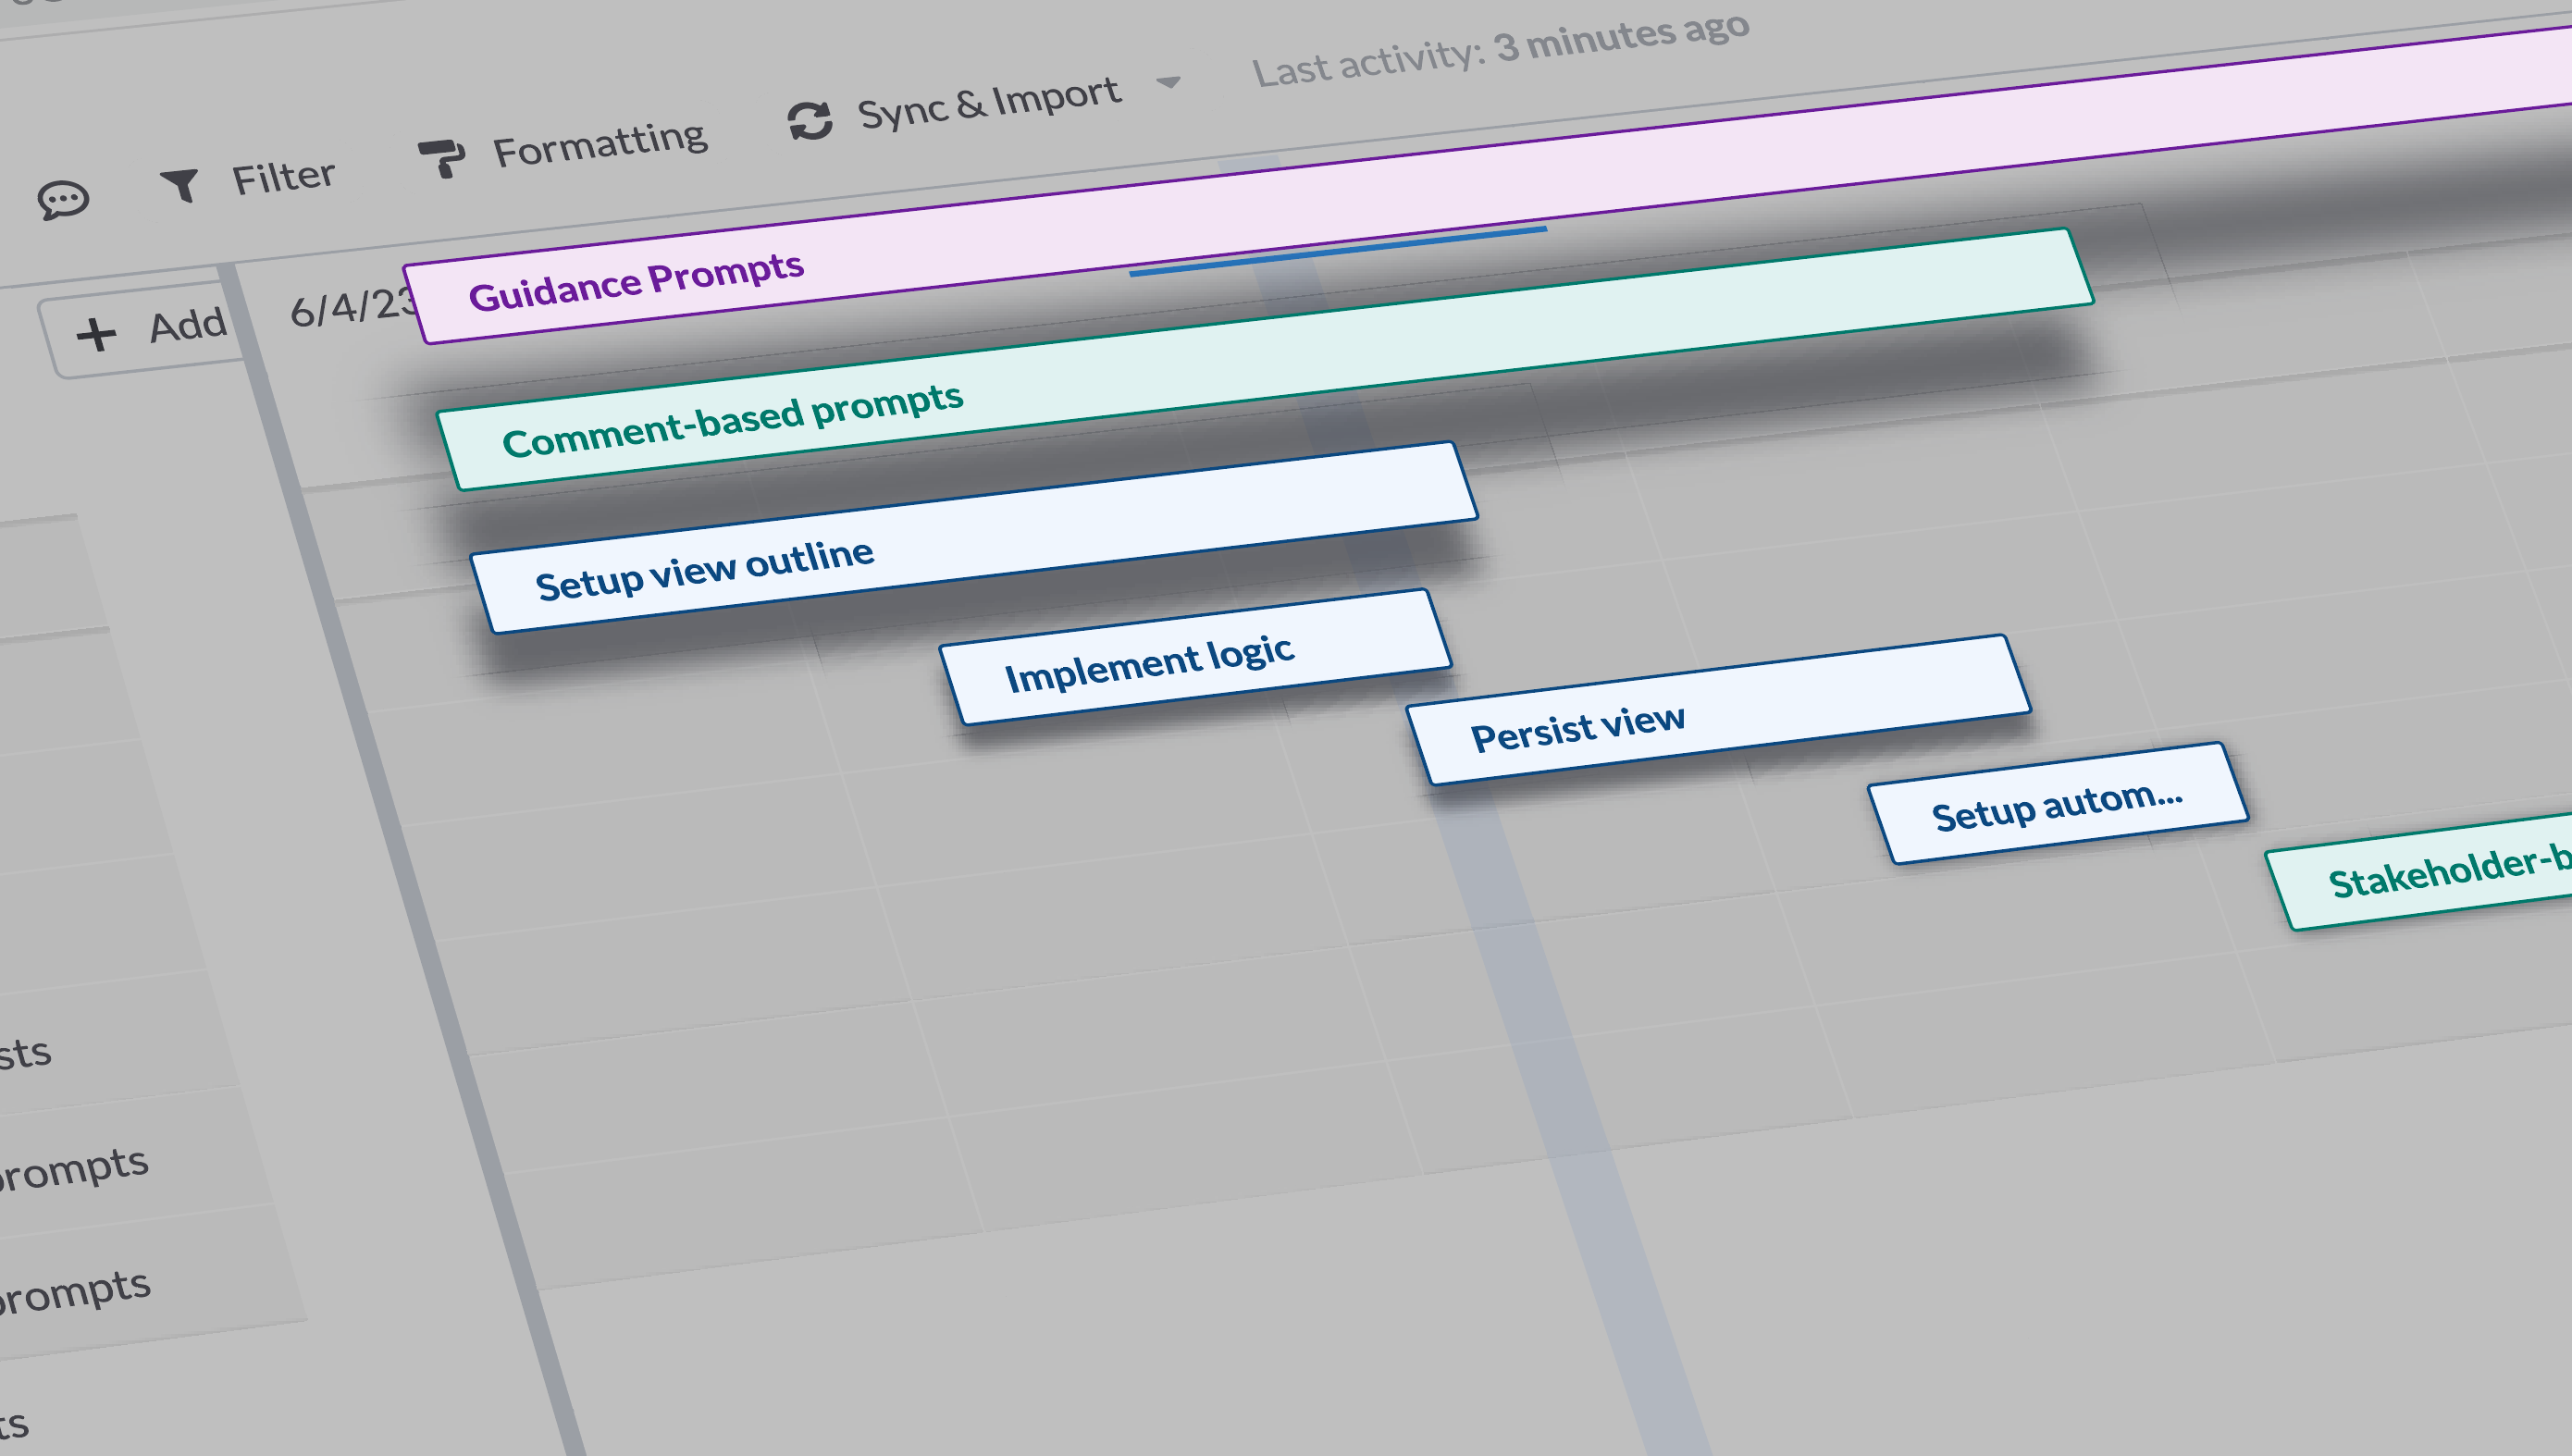
Gantt View — Best Exported as PDF or via Table View CSV
The Gantt view is Visor’s visual project planning view, showing tasks as bars on a timeline.
Available export formats: CSV, PDF (Snapshot or Full View), PNG, JPG
What to know about each Gantt export format:
- The Full View PDF (available to paid subscribers) is the best way to preserve your Gantt visually. It exports the entire Gantt across multiple pages, making it ideal for printing or sharing. This is the only export options that captures the complete timeline without cropping, and it’s only available with this view.
- The Snapshot PDF, PNG, and JPG exports capture only what’s currently visible on your screen. If your Gantt spans a long timeline, data will cut off.
- The CSV export from Gantt view will contain your underlying data, but it won’t look like a Gantt. Instead, it renders as a flat spreadsheet with some structural irregularities. For a cleaner data export, we recommend switching to the Table view and exporting from there instead.
How to export:
- Open the File menu
- Click Export View
- Choose your format
If you’re connected to Jira:
Jira’s native Timeline view works well for single-project visualization, and Advanced Roadmaps supports multiple projects. The Atlassian Marketplace also has strong third-party options, including Gantt Charts for Structure PPM by Tempo and Gantt Chart Maker by DevSamurai.
Timeline View — Snapshot Export Only
The Timeline view organizes your data into swimlanes for capacity planning and resource visualization — a great way to spot allocation issues or blockers across team members.
Available export formats: PDF (Snapshot), PNG, JPG
What to know: Timeline view does not support CSV export or Full View PDF. All exports are snapshots of what’s currently on your screen.
How to export:
- Open the File menu
- Click Export View
- Choose PDF, Image (.jpg), or Image (.png)
Want more export options? Convert your Timeline to a Gantt view first — that unlocks CSV export and the Full View PDF for paid subscribers.
Board View — Snapshot Export Only
The Board view gives you a Kanban-style layout for tracking work by status, project, or any other field. It’s useful for visualizing workflow states at a glance.
Available export formats: PDF (Snapshot), PNG, JPG
What to know: Like Timeline, Board view does not support CSV export or Full View PDF. Exports capture only what’s visible on screen.
How to export:
- Open the File menu
- Click Export View
- Choose PDF, Image (.jpg), or Image (.png)
If you’re connected to Jira or Asana: Both platforms have native Kanban boards built in. We recommend using those going forward — you won’t be losing the functionality.
Dashboard View — Snapshot Export Only
The Dashboard view displays your workbook data as charts and metrics — bar charts, pie charts, KPI tiles, and more. It’s designed for reporting and sharing project health at a glance.
Available export formats: PDF (Snapshot), PNG, JPG
What to know: Dashboard view does not support CSV export. Exports are snapshots only. For the underlying data behind any dashboard, export from the corresponding Table view in the same workbook.
How to export:
- Open the File menu
- Click Export View
- Choose PDF, Image (.jpg), or Image (.png)
Our Recommendation
It’s worth repeating that going to your Table view and exporting a CSV is the best way to preserve your data. No matter which views you work with day-to-day, your workbook will have a Table view.
You have until July 31, 2026 to export your data. If you have questions or run into any issues, reach out to us at support@visor.us. We’re happy to help.