Visor’s bi-directional Jira integration makes it easy to create Jira Gantt charts that stay accurate. Add conditional formatting, filters, and milestones before sharing. Visor is an officially listed Atlassian Marketplace Partner.
Visor provides a secure connection to Jira with fewer steps than other apps. Import your nested Jira data in just a few minutes. Visor also supports JQL.
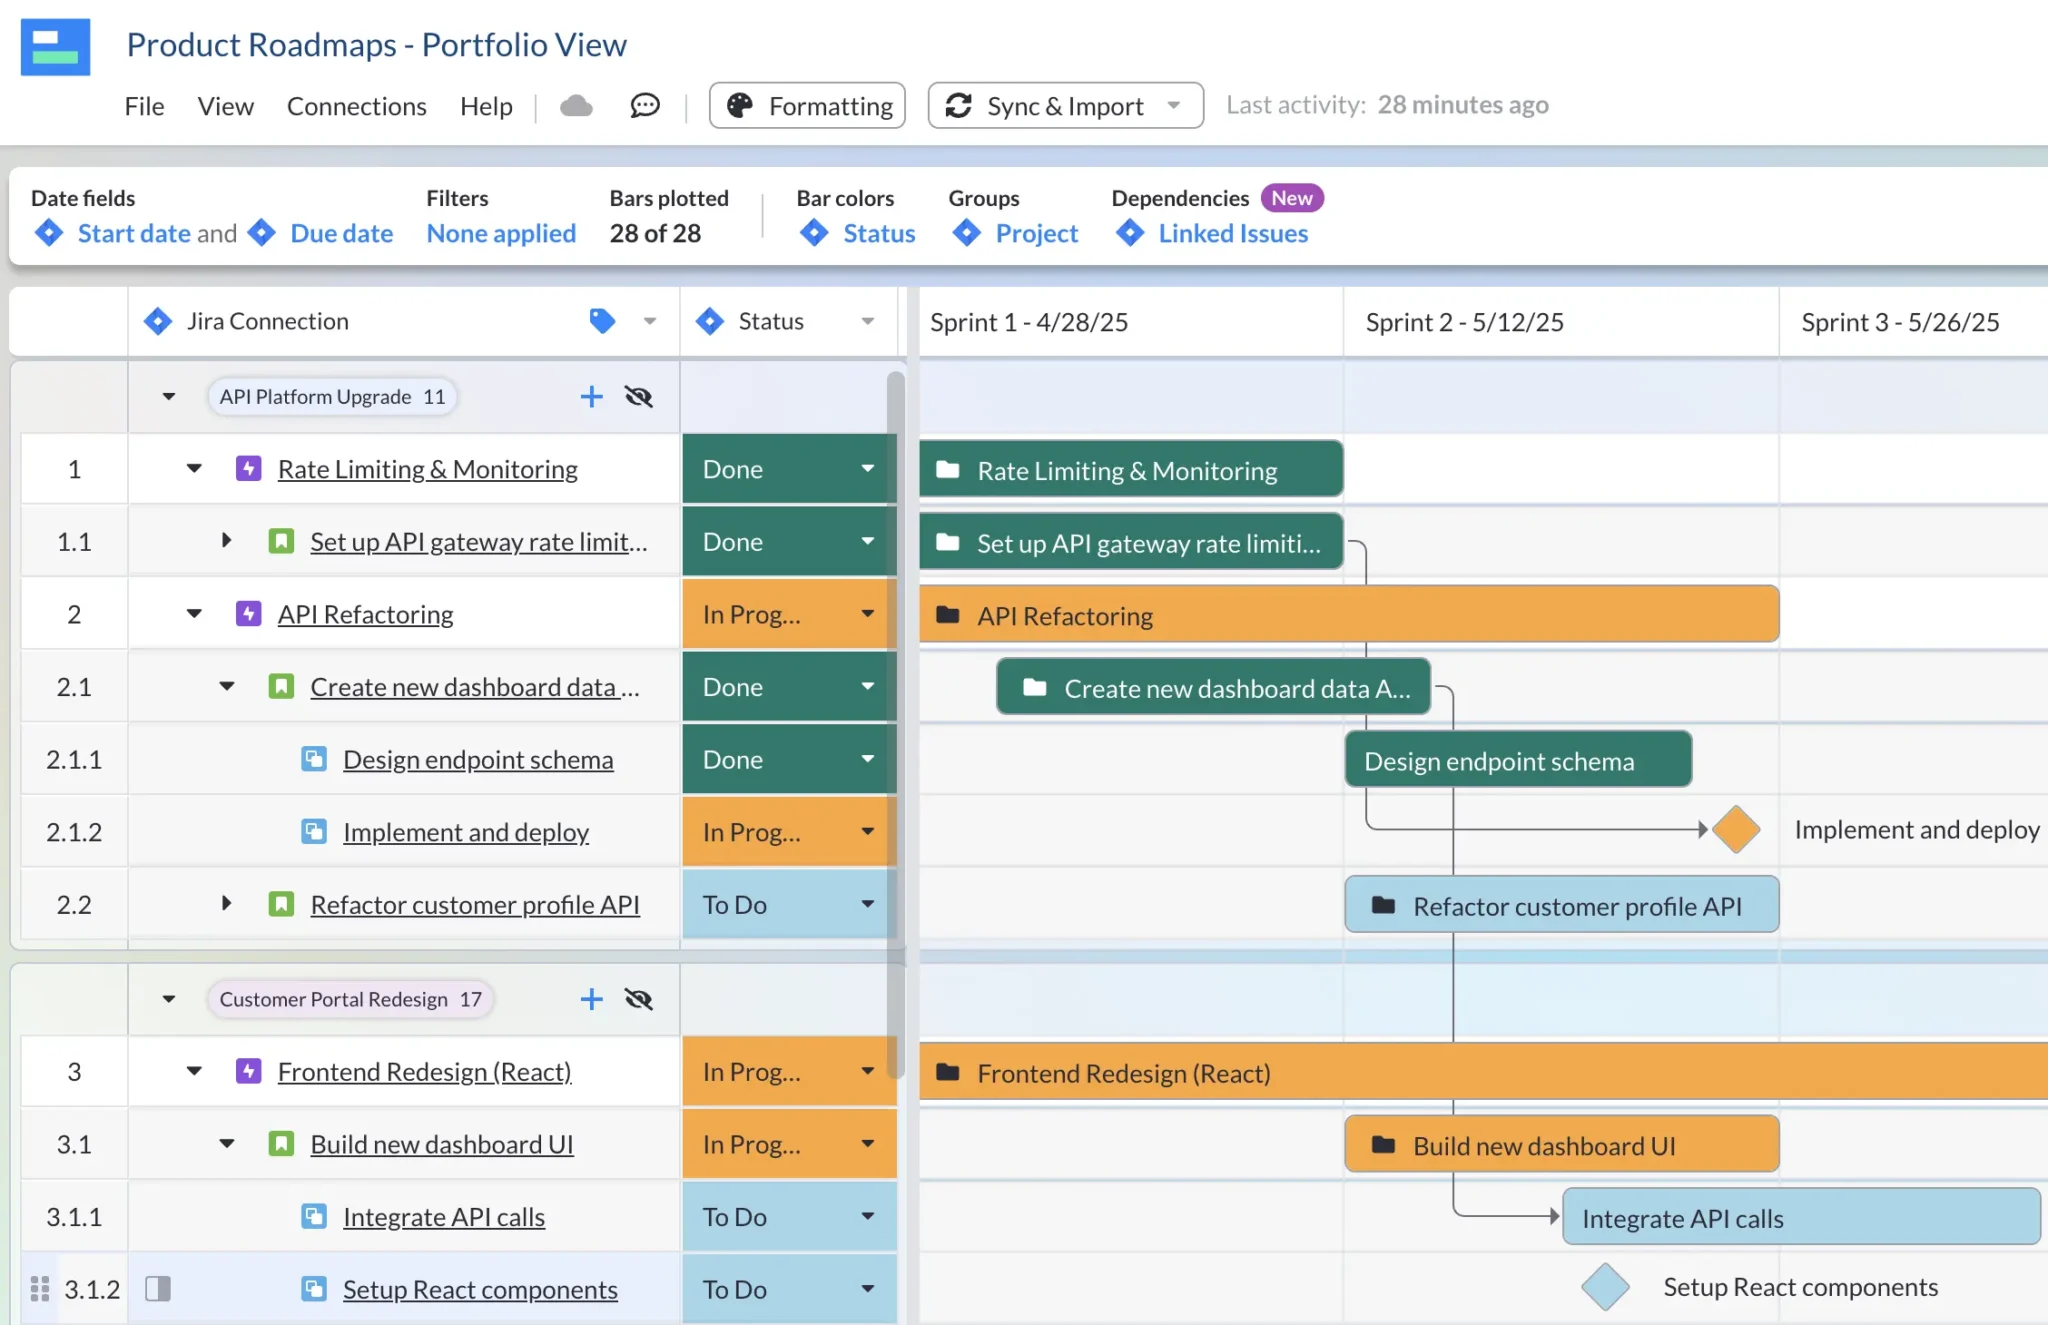
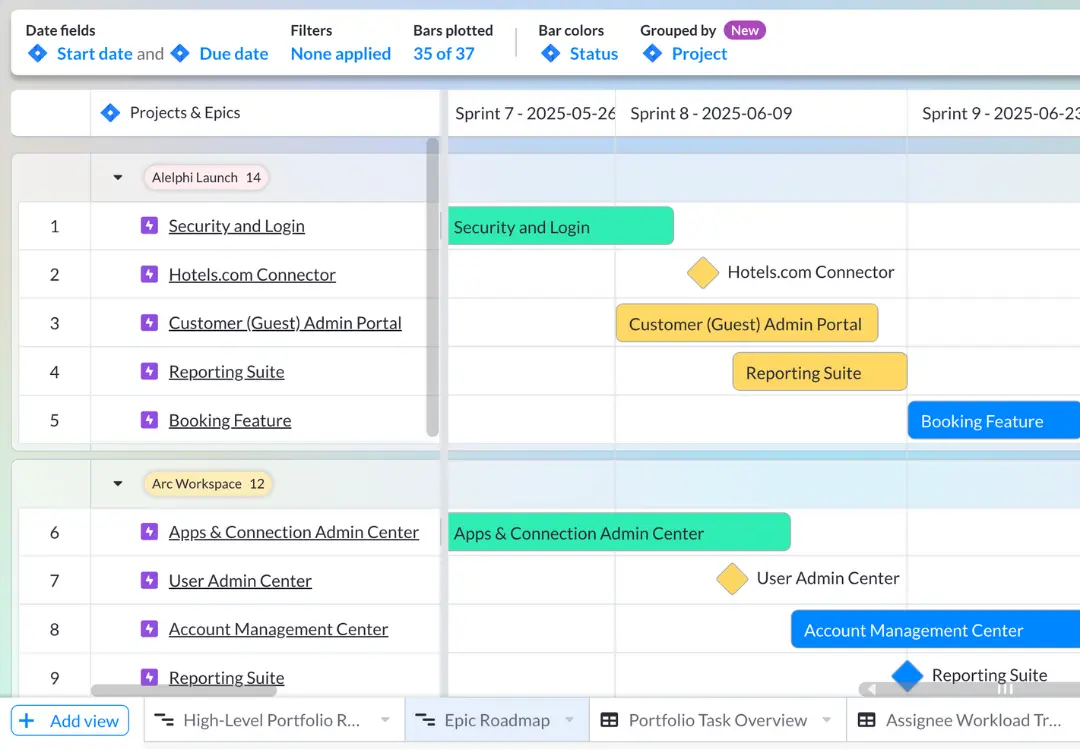
Visor stays in sync with Jira, allowing you to visualize data hierarchies (e.g., epics, stories, tasks, substasks). Add filters to help stakeholders get the right level of detail.
Visor’s filtering and formatting makes it easy to create different views for different audiences. Unlimited view-only access makes sharing easy and economical.
Create beautiful Jira Gantt charts fast with AI Smart Templates. Visor’s AI makes generating fully configured and customized Jira Gantt charts fast and easy, reclaiming lost hours that your team can reinvest into higher-value activities.
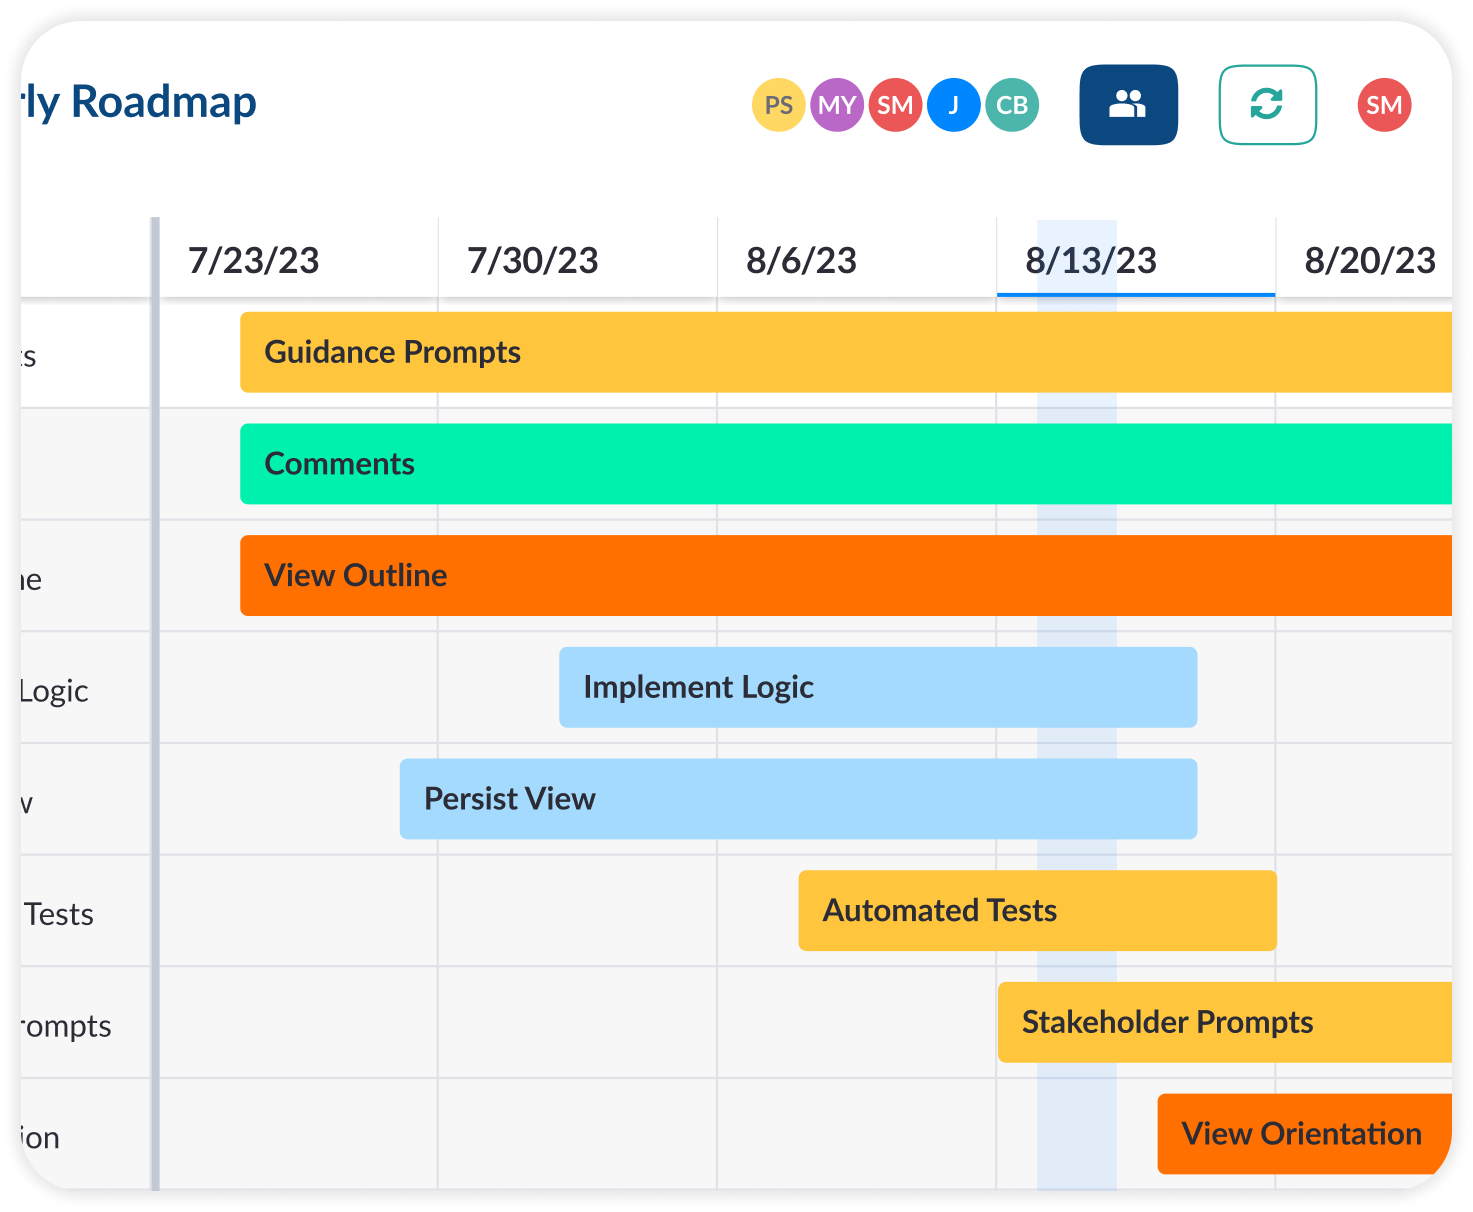
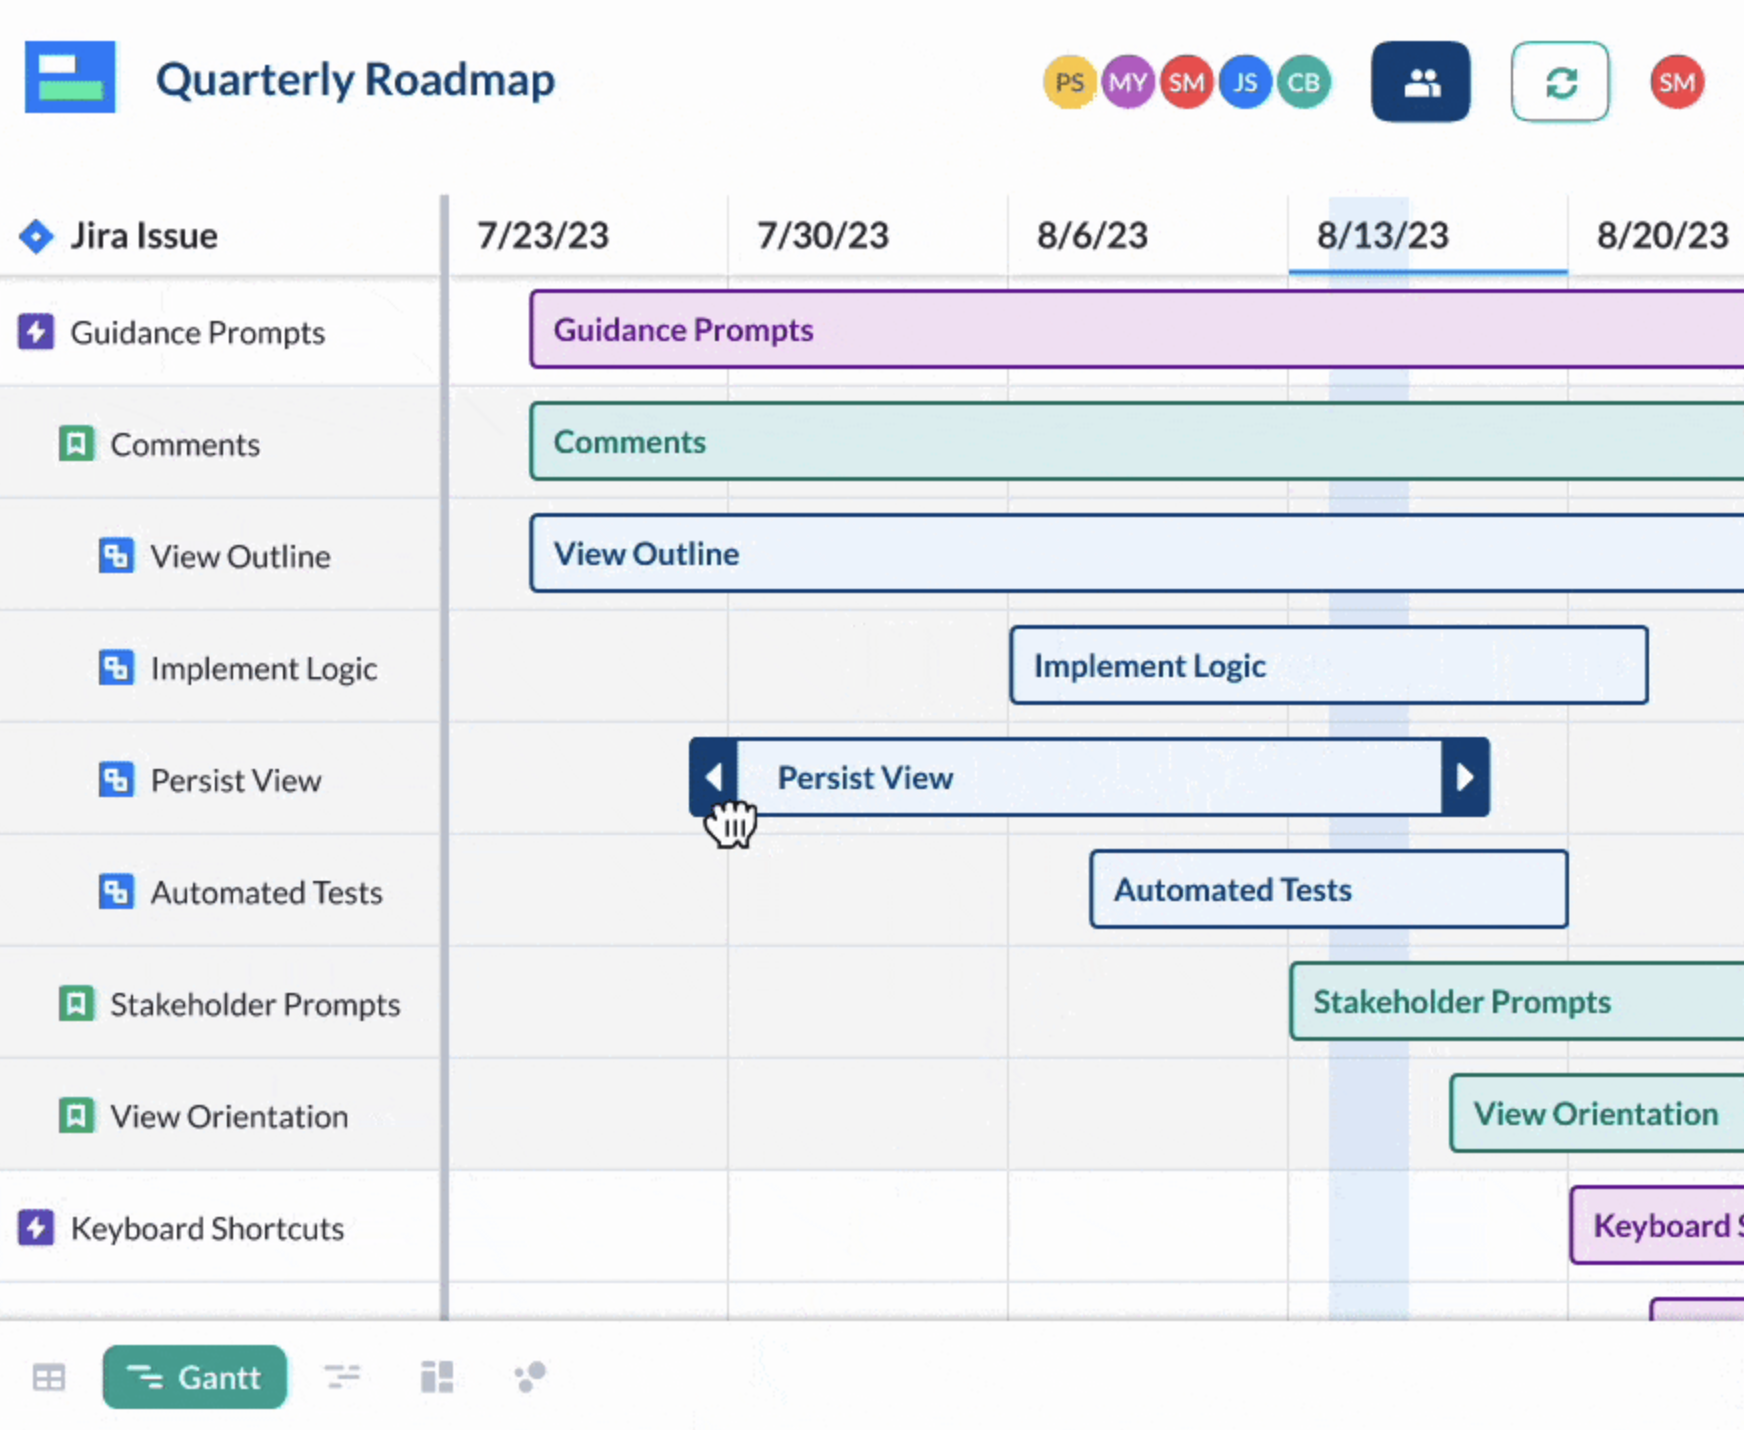
Visor provides an intuitive interface that makes creating a Jira Gantt chart easy. Add color with conditional formatting to make your chart easy to understand at first glance.
Easily import multiple Jira projects into Visor to create a Gantt chart that includes all your projects. Unlock program and portfolio Gantt charts for Jira without Jira Plans or Jira Align.
Alex gives a deep dive into our free Jira Roadmap and Jira Gantt capabilities on his popular Apetech Tech Tutorials YouTube channel.
Make Jira Gantt Charts With Data From Other Apps
Create Jira Gantt charts that incorporate data from other apps, like Asana or Salesforce. Tie together data housed in different apps for a holistic view of projects and business processes.
Use Jira Gantt charts and other Visor visualizations to provide live updates to stakeholders, teams, and clients who don’t have access to your Jira instance.
Explore the Visor features that help you create crystal clear, robust Jira Gantt charts that impress your stakeholders and help you get a clearer view of all your Jira projects in one place.
Two-way Jira Syncing
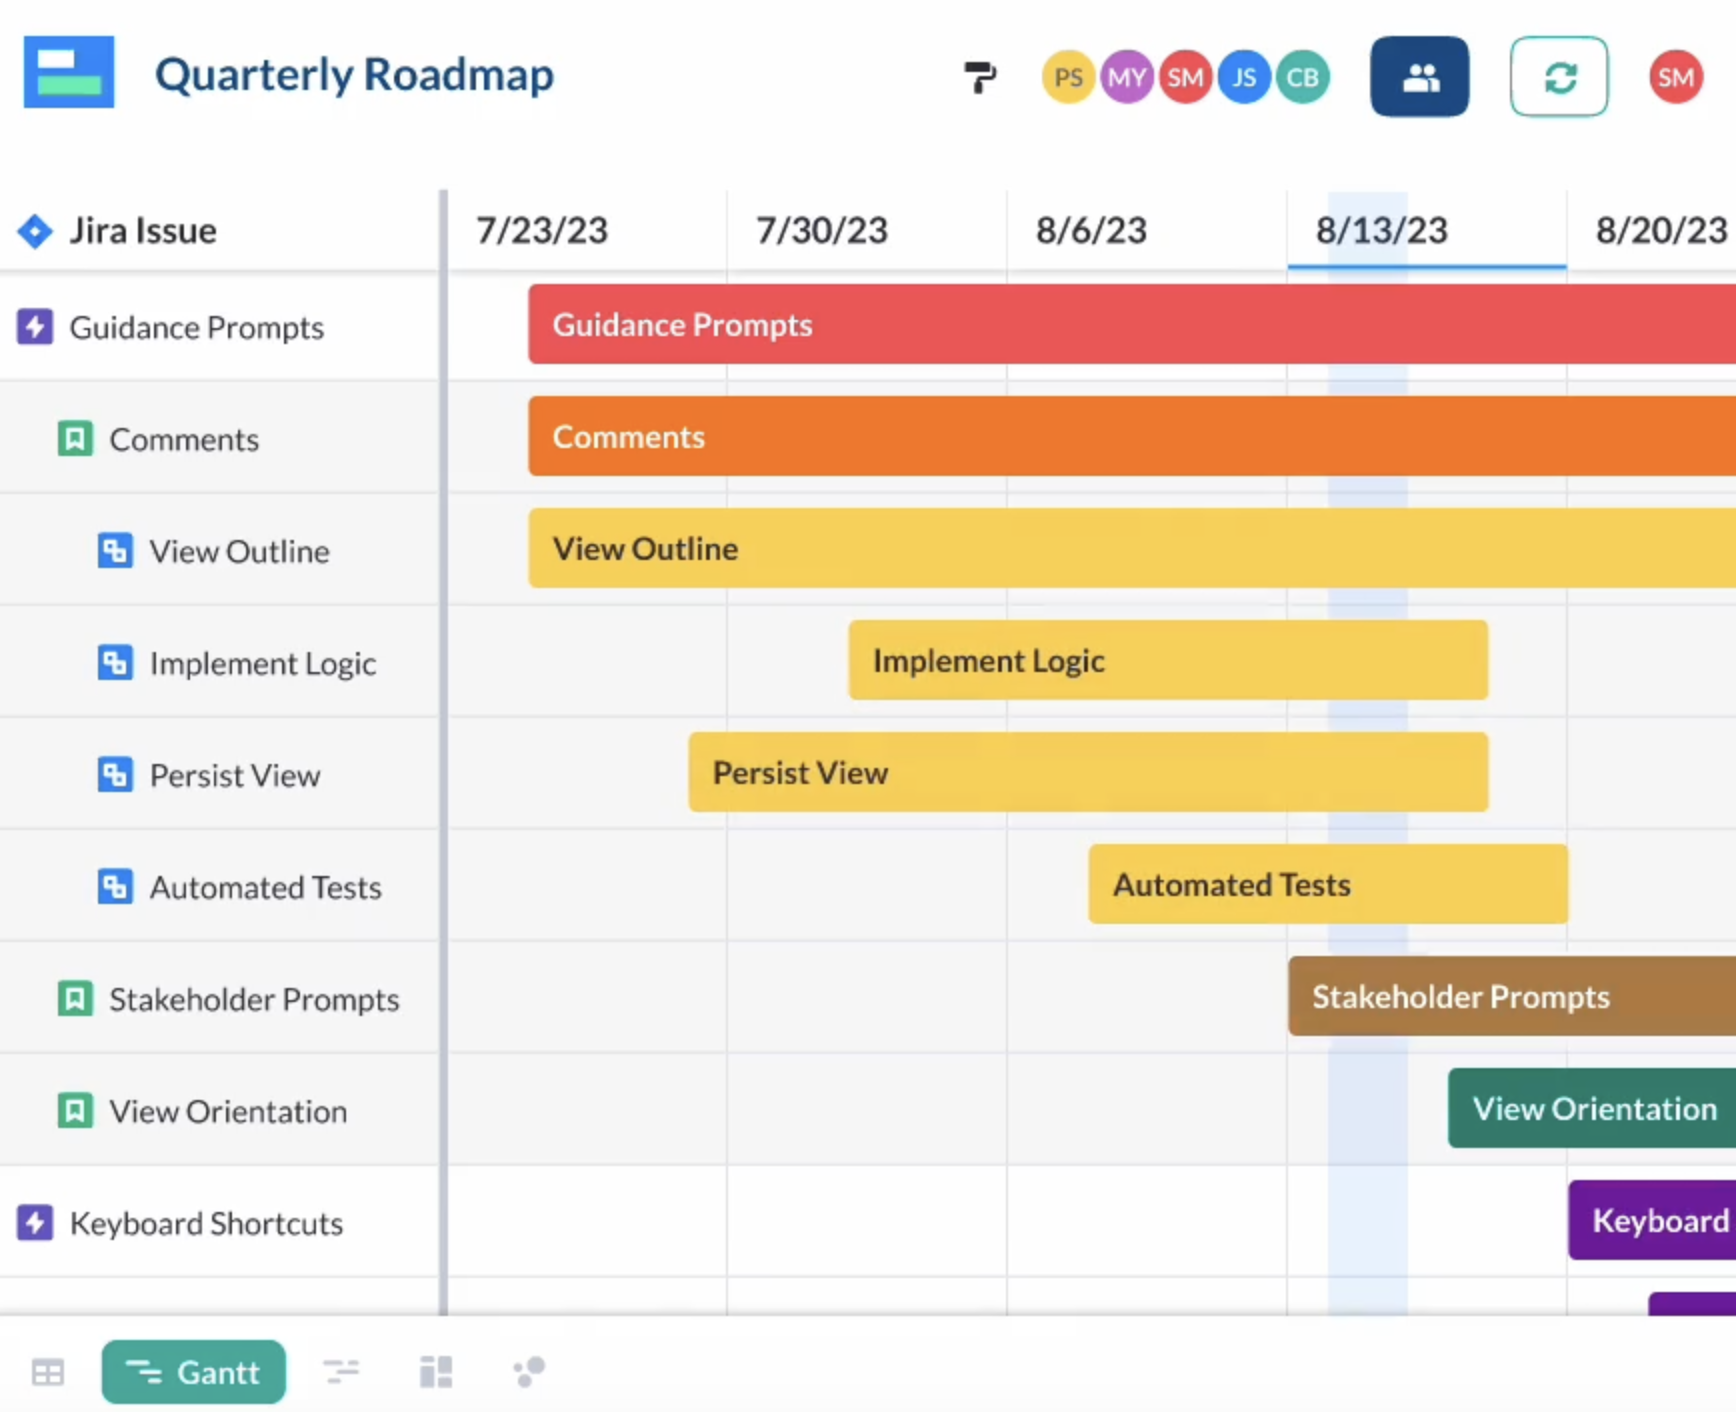
Visor honors Jira nesting, making it easy to import, visualize, and edit Jira data.
Easy To Use
Creating Jira Gantt charts is easy using drag-and-drop controls and a user-friendly interface.
Accurate Custom Views
Create spreadsheets, Gantts, and other views that stay accurate without manual work.
Jira Spreadsheets
Share, edit, and sort through project data using Visor’s table view.
Jira Gantt Charts
Create colorful Jira Gantt charts and roadmaps – share the level of detail your audience needs.
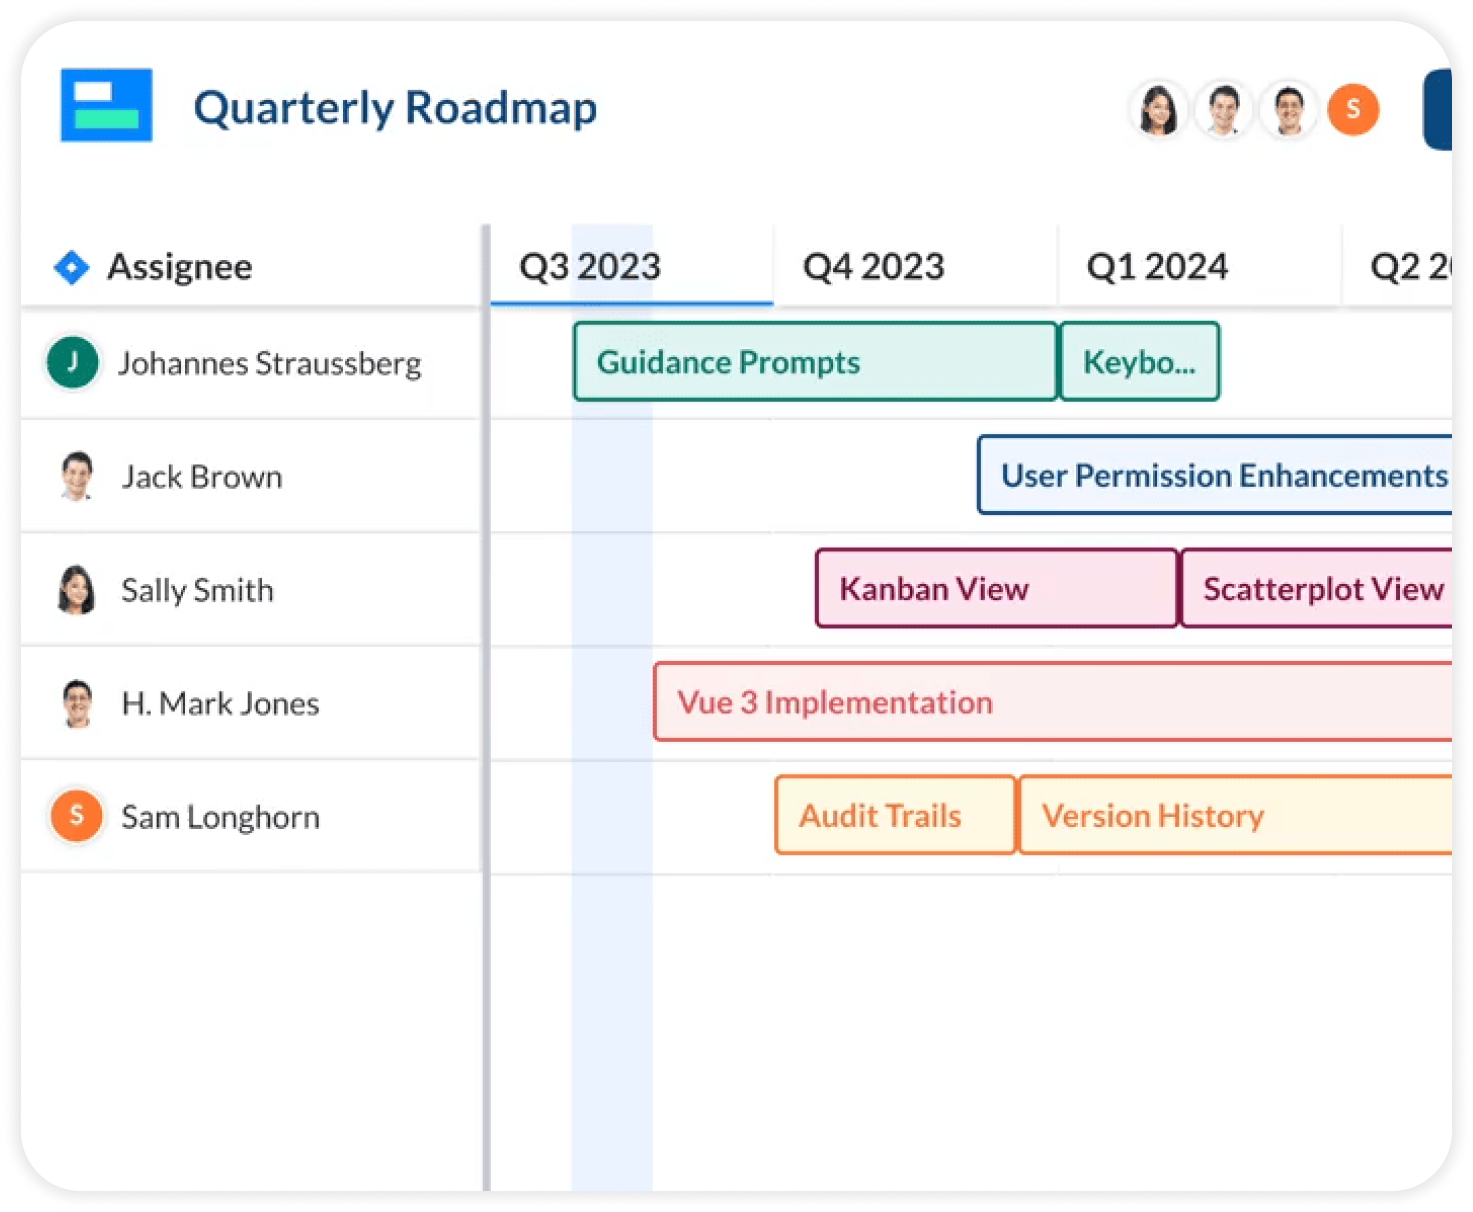
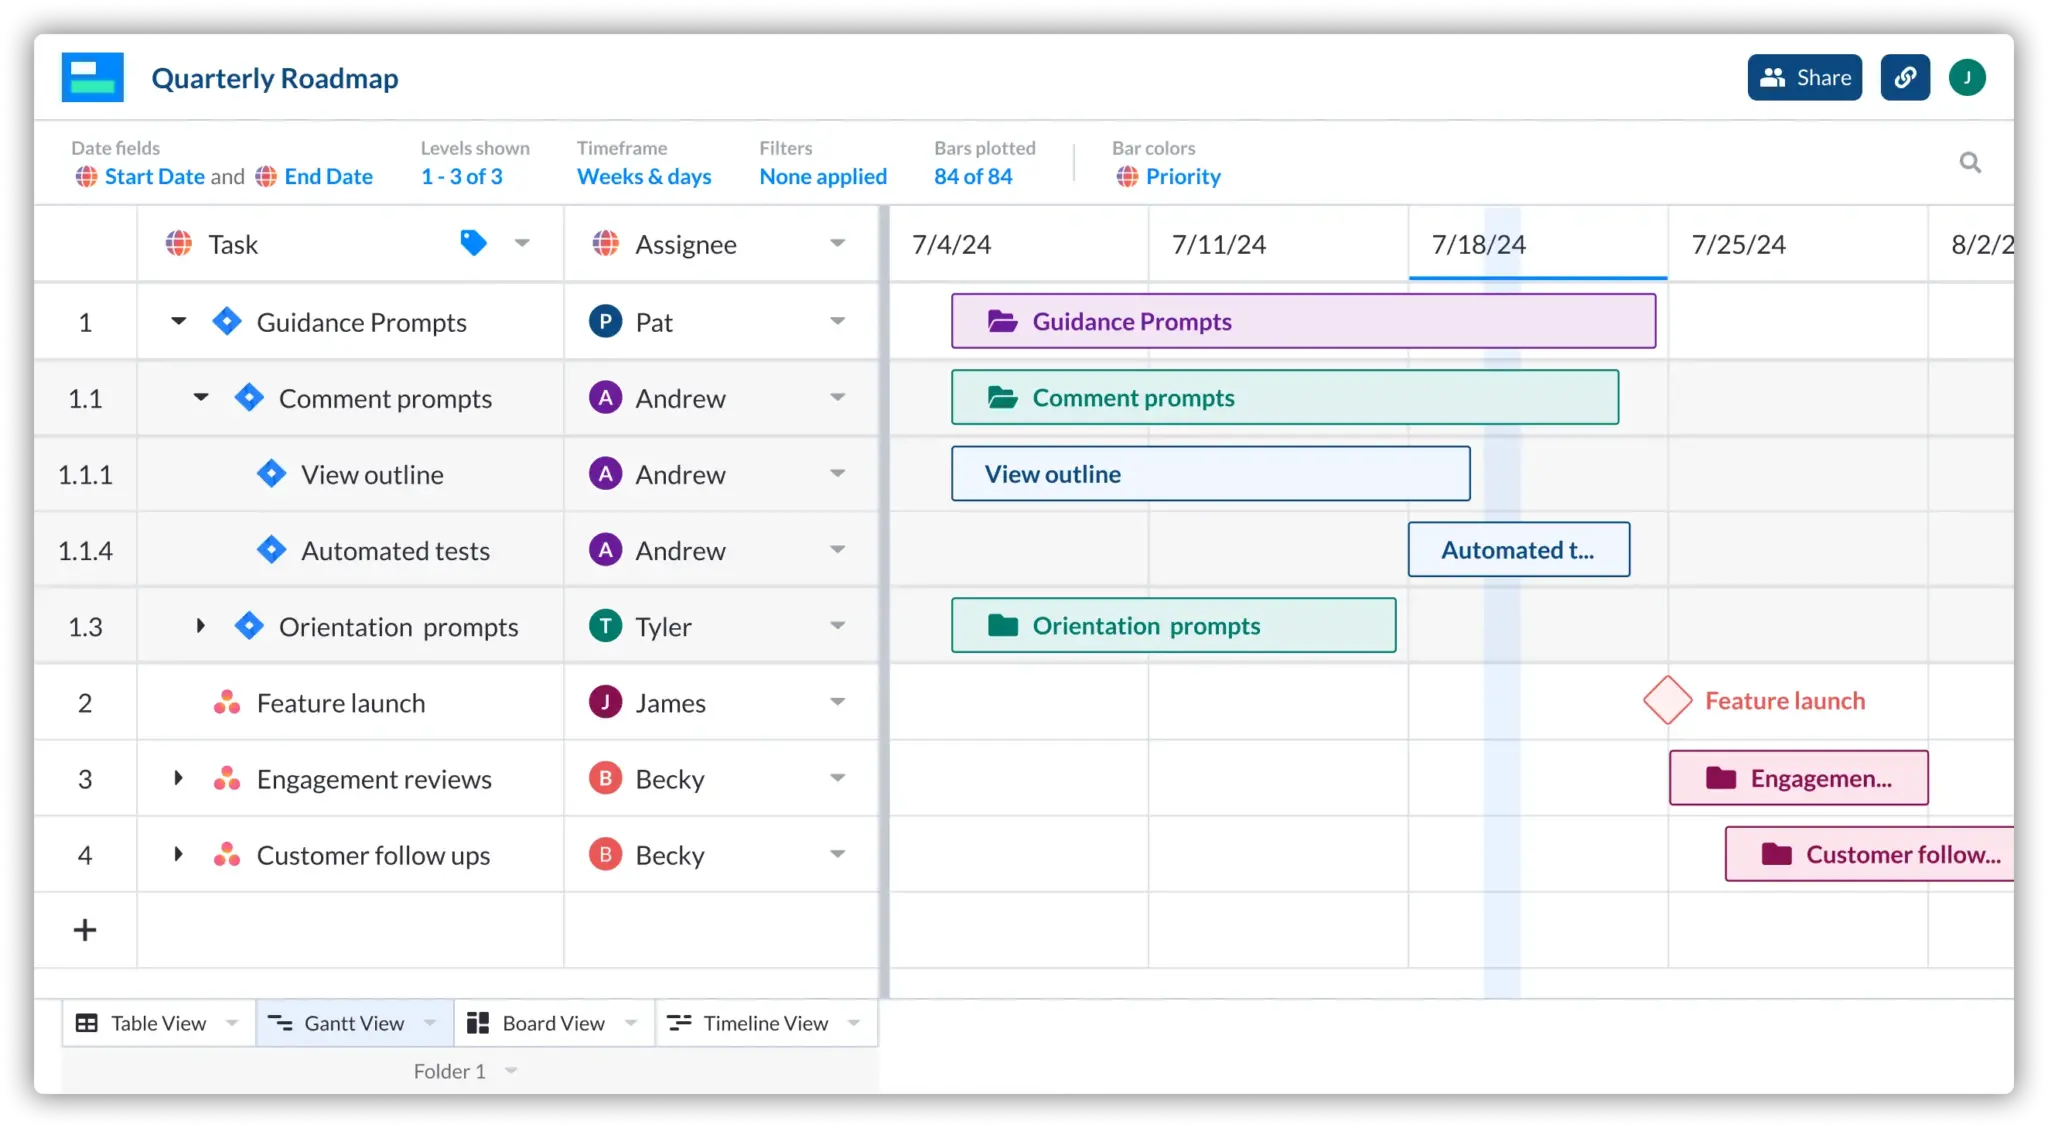
Jira Timeline Charts
Agile teams can see who is doing what with Timeline’s swimlanes and Jira Sprint fields.
Jira Connected Fields
Visor connects to 75+ types of Jira fields and Jira nesting. Import Epics, Stories, Tasks, and more.
Visor Custom Fields
Provide additional information along with your Jira data using custom fields.
Secure Jira Sharing
Decide who gets edit, comment, or view access to your data and what data is un-editable.
Verified Reviews
“Visor is so much more flexible than any other JIRA-integrated roadmapping software I’ve used.” 🤩
Kemper R., Atlassian reviewer
“Visor for JIRA has transformed our team’s collaboration and workflow efficiency.”
Verified G2 reviewer
“Excellent customization and easy to use. I can tailor Visor to my exact needs.”
Camila B., G2 reviewer
“Visor enhances collaboration and project planning with its intuitive interface and integrated Gantt chart.”
Shruti P., Atlassian reviewer
Jira Gantt FAQs for Visor
Does Jira offer a free Gantt chart?
Jira has a Timeline roadmap available in free Jira plans. However, there are limitations. For one, you can’t bring in more than one Jira project into your Timeline Gantt / roadmap; you also cannot visualize subtasks. However, you can do both of these with Jira’s Advanced Roadmaps. Both Jira Timeline and Advanced Roadmap are best for sharing your project plans with people also using Jira in your Jira instance. For an alternative way to make a Jira Gantt chart that bypasses the limitations of Jira’s free Timeline offering AND can be shared with anyone, check out Visor.
You can also see us unpack the difference between Jira’s Gantt / roadmap options here:
Is a Jira Gantt chart and Jira Roadmap the same thing?
Jira offers two roadmaps, which we compare in our Jira Timeline vs. Advanced Roadmaps article. In this article, we also go into how Gantts are more detailed project plans, while roadmaps are often more forward-looking strategy documents that go over big picture. However, both look very similar. So, a Roadmap could be a Gantt chart if it offers more granularity.
Can I view dependencies and linked issues from Jira in Gantt charts in Visor?
Yes, your links and dependencies between Jira issues are shown in perfect clarity and detail when you import your Jira projects into the Gantt chart tool in Visor.
Can I choose which type of Jira issue links to show in Gantt charts in Visor?
Yes, there is a simple filter you can use to select which types of Jira issue links to show in your Jira based Gantt charts in Visor. For example, you may only want to show issue links for blocking tasks, or you may only want to show issue links between blocking tasks and related tasks. The choice is yours, giving you the ability to fine tune your Gantt charts to show exactly the kind of relationships and issue links that you want to see and to share.
Can I show Jira issue links between issues that are in different projects?
Yes, you can import multiple projects and visualize them in a single Gantt chart, including the issue links between issues in different projects.
Jira issues in your Visor Gantt charts can be nested, collapsed, and grouped by any criteria in any dropdown menu (such as assignee, project, initiative, team, status, priority etc.).
This gives you a high-level, big picture view of projects and tasks that would otherwise be out of reach unless you purchase an enterprise level project portfolio management tool (such as Jira Align) or another high-cost offering.
Can I add my Jira Gantt chart to Confluence?
In our Ultimate Guide to Confluence Gantt Charts, we go over how easy it is to create Jira Gantt charts in Visor that you can embed into Confluence. We also go over other Atlassian options for creating Confluence Gantt Charts.
Can I add Milestones to Jira Gantt Charts in Visor?
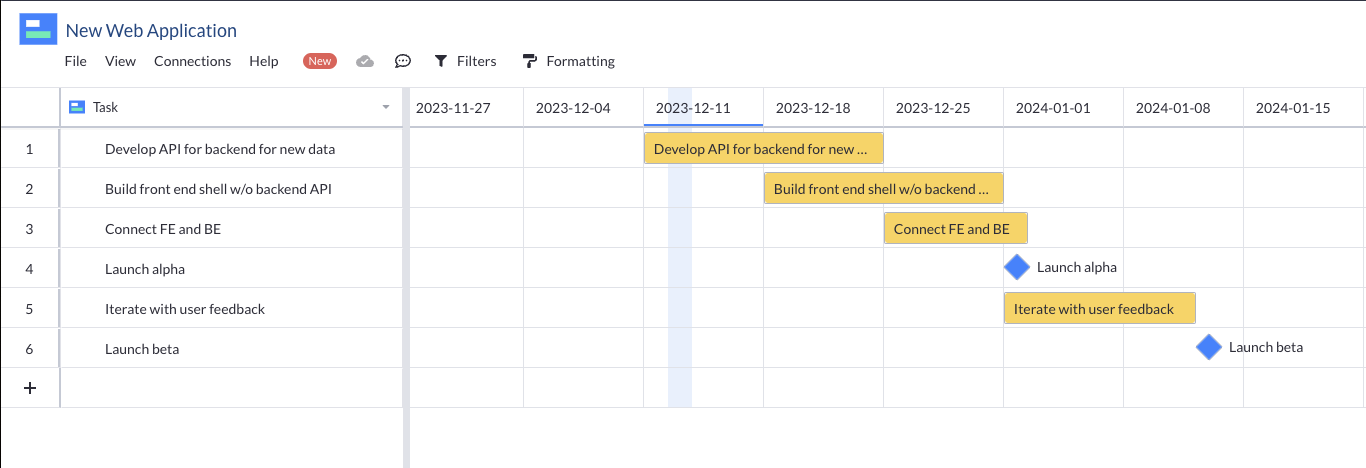
While Atlassian doesn’t offer a milestones feature in their built-in roadmap / Gantt chart options, Visor does allow you to create a colorful Gantt chart with milestones using your Jira data.
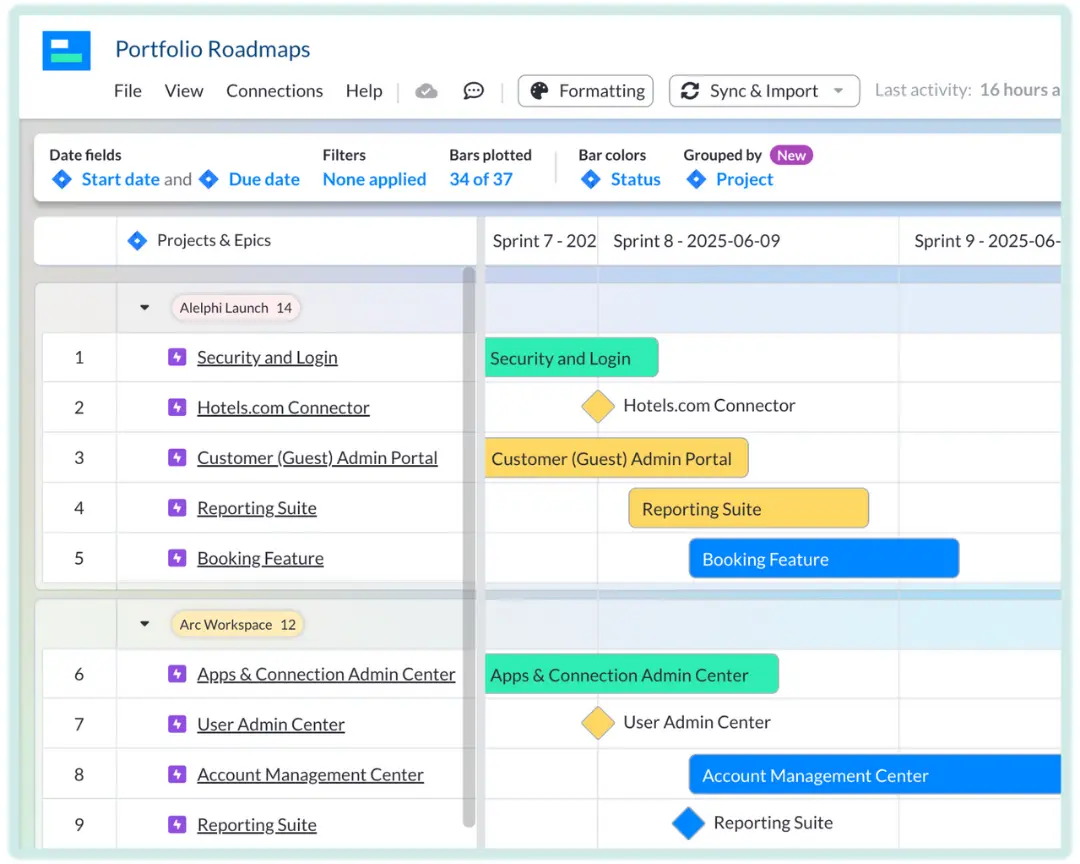
To add Jira milestones in roadmaps, you just have to create a free Visor account. Below, you’ll seen an example of a Jira roadmap with milestones (the blue diamonds).
Free Jira Gantt chart with Milestones made in Visor:
Are there limits when creating a free Jira Gantt chart in Visor?
Visor has a 14-day free trial. You can import up to 1,000 records from Jira and transform your data into a Gantt that you can share with anyone. You can add milestones, format / color-code your data, add filters so that you’re showing the right level of detail, and more.
If, after your trial you decide to stay on the Free plan, the main limits to Visor are how many workbooks and views you can have, along with the access you can give to others after you make your Jira Gantt chart. But if you want to just create one Jira Gantt chart, then the only limit you’ll encounter is the 1,000 record limit and an export limitation.
If you want to see how to create a Jira Gantt chart in Visor, watch the tutorial below:
What is a Jira Gantt Chart plugin?
A Jira Gantt chart plugin is a tool that you purchase which is then accessed directly through the Jira app. It is like an extension of functionality within Jira, rather than an integrated or connected app.
Is Visor a Jira Gantt Chart plugin?
No, Visor is not a plugin. Rather, you connect Jira data with a Visor workspace. From there, you can create Gantt charts, Timeline charts for capacity planning, a Board view, dashboards and more.
Because Visor is not a plug-in, it’s more cost effective and you can share your Gantt charts and other visualizations easily, even if your stakeholders don’t have access to your Jira instance.
Why is Visor Better Than Jira Gantt Chart Plugins?
Visor is better than Jira Gantt plug-ins because like a plugin it enables you to visualize, work with, and update live Jira data, but unlike a plug-in it sits outside Jira itself. This has two key benefits.
You can share your Gantt charts with stakeholders that don’t have access to Jira
It’s more cost effective: You only pay for users that actually create Jira Gantt charts in Visor. Whereas Jira Gantt plugins charge you a license for every Jira user you already have, and add in the future.
Visor also has a range of additional features and functionality that is missing from Jira Gantt chart plugins.
If you or your organization also uses apps like Asana, Salesforce, or Hubspot, you can create Gantt charts and other visualizations that combine data from all these apps.
Visor is a modern app for creating beautiful, crystal clear Jira Gantt charts, and other visualizations too. You can even import multiple Jira projects to create portfolio Gantt charts with your Jira data in Visor.
Does Visor support JQL?
Yes, you can use Visor’s JQL importer to bring in more than one Jira project into your Visor Gantt chart. If you have more basic needs for your Jira Gantt, then Visor’s basic importer will work just fine for you.
Can I create other view types in addition to Jira Gantt charts in Visor?
Yes, in addition to creating Gantt charts in Visor you can also create timelines, Kanban boards, dashboards, and spreadsheet views, all using real-time Jira data, from a single project, multiple projects, and portfolios of projects.
Can I create Jira Gantt charts in all of Visor’s pricing plans?
You can create Jira Gantt charts using Visor’s Starter, Team, and Business plan. You can also create Jira Gantt charts using the no-commitment free trial of the Visor team plan – Try it now.
Can I add “rollup” calculations to Jira Gantt charts I create in Visor?
Yes, you can create rollup fields for any date or number field in Visor, including fields that have been imported from Jira using Visor’s bi-directional Jira integration.
Rollup fields in Visor enable you to add a field that calculates all the values for child issues under a parent, and rolls these up to the parent level.
For example, if you imported a Story Points field into Visor from Jira, you could add rollup fields for “Total Story Points” and “Average Story Points”. These fields would calculate the total and average story points for each story under each epic, enabling you to instantly see the total and average story points for each epic.
Which kind of fields can be “rolled up” using calculated rollup fields in Visor?
You can add a rollup field based on any date or number field in Visor. You can add rollup fields for multiple date fields in the same Gantt chart, in addition to the date fields you use for scheduling.
Which kind of rollup calculations (operators) can be used in Visor?
You can currently use the following rollup calculations in Visor :
Date fields:
Earliest
Latest
Number fields:
Sum
Average
Median
Maximum
Minimum
What is the difference between rollup calculations for number fields in Jira Plans/Advanced Roadmaps and Visor?
In Jira Plans/Advanced Roadmaps rollup calculations can only be used on a very small number of preconfigured fields. This means you cannot apply rollup calculations to many standard Jira fields and all custom fields.
In Visor you can apply rollup calculations to any number field, including custom fields. These rollup fields can be added as columns to your Gantt chart, and can be easily shown or hidden as you require.
Jira Plans only allows you to use “sum” as your operator. In Visor you can use a full range of operators, including:
Sum
Average
Maximum
Minimum
Median
What is the difference between rollup calculations for date fields in Jira Plans/Advanced Roadmaps and Visor?
In Jira Plans/Advanced Roadmaps you can only use rollup calculations on the two date fields used for scheduling your timeline (typically Start Date and Due Date).
In Visor you can apply rollup calculations to any date field. This means you can calculate the earliest and latest dates for a wide range of “secondary” date types, for example:
Review dates
Approval dates
Planned start/end dates
Transition date
Compared to Jira Advanced Roadmaps/Jira Plans, Visor enables you to create Jira Gantt charts that are richer, and more tailored to your specific needs and workflows.
How do you add rollup calculations to Jira fields in a Gantt chart in Visor
Once you have imported you Jira projects into Visor, simply click the arrow in the header row for the field you want to rollup, and select “Rollup in new field”.
Then select the operator you want to use (e.g. Sum, Average) and whether you want to include the parent values in the rollup calculation.
Can I add Visor custom fields to supplement the data in my Jira Gantt charts in Visor?
Yes, you can add Visor custom fields to supplement and augment your Jira data. These Visor fields do not sync back into Jira, so they’re perfect for adding additional context for stakeholders or information that is specific to a single project or task or for project portfolio management purposes, which you don’t want to include (or that won’t fit) into your Jira instance itself.
Do Visor’s Jira Gantt charts maintain my Jira hierarchies and relationships?
Yes, when you import data from Jira into Visor, your existing hierarchies and relationships (for example, the nesting of epics, issues, and subtasks) are maintained. Visor keeps your project data perfectly organized and in sync with Jira, so you can easily create high-fidelity Jira Gantt charts without any extra work to reconstruct and properly nest your data.
You can also import data and decide to ignore Jira nesting, for those rare scenarios where you need to create a visualization without Jira’s restrictions on task hierarchies.
Have another question?
If you have any more questions, they may be answered in our Knowledge Base. Otherwise feel free to reach out to us. Our email is support@visor.us. We’d love to hear from you!
Are you ready to begin?
Visor is secure, free, and doesn't require a credit card.
To provide the best experiences, we use technologies like cookies to store and/or access device information. Consenting to these technologies will allow us to process data such as browsing behavior or unique IDs on this site. Not consenting or withdrawing consent, may adversely affect certain features and functions.
Functional Always active
The technical storage or access is strictly necessary for the legitimate purpose of enabling the use of a specific service explicitly requested by the subscriber or user, or for the sole purpose of carrying out the transmission of a communication over an electronic communications network.
Preferences
The technical storage or access is necessary for the legitimate purpose of storing preferences that are not requested by the subscriber or user.
Statistics
The technical storage or access that is used exclusively for statistical purposes.The technical storage or access that is used exclusively for anonymous statistical purposes. Without a subpoena, voluntary compliance on the part of your Internet Service Provider, or additional records from a third party, information stored or retrieved for this purpose alone cannot usually be used to identify you.
Marketing
The technical storage or access is required to create user profiles to send advertising, or to track the user on a website or across several websites for similar marketing purposes.
To provide the best experiences, we use technologies like cookies to store and/or access device information. Consenting to these technologies will allow us to process data such as browsing behavior, to improve the performance of this website.
Functional Always active
The technical storage or access is strictly necessary for the legitimate purpose of enabling the use of a specific service explicitly requested by the subscriber or user, or for the sole purpose of carrying out the transmission of a communication over an electronic communications network.
Preferences
The technical storage or access is necessary for the legitimate purpose of storing preferences that are not requested by the subscriber or user.
Statistics
The technical storage or access that is used exclusively for statistical purposes.The technical storage or access that is used exclusively for anonymous statistical purposes. Without a subpoena, voluntary compliance on the part of your Internet Service Provider, or additional records from a third party, information stored or retrieved for this purpose alone cannot usually be used to identify you.
Marketing
The technical storage or access is required to create user profiles to send advertising, or to track the user on a website or across several websites for similar marketing purposes.