Roadmap Visualizations That Your Stakeholders Will Love

Start using Visor today
- Visualize all your projects and data

- Roll up multiple projects into portfolio views
- Try Visor for FREE
Roadmap visualizations can make or break how your plans are perceived, and potentially how invested important stakeholders are in the projects that you’re leading.
Getting roadmap visualization right is extremely important, yet frequently overlooked by project managers and product managers. Some teams ignore visualizations and lean on text heavy descriptions. Others settle for nondescript screenshots from their project management system.
Those that do put a high value on roadmap visualization can improve their reputations, as well as their team’s, and their project’s.
If you think your projects deserve to be seen in their full glory then help is on hand. Read on to discover how to create roadmap visualizations that inspire, inform, and engage, without breaking your budget or depleting your time.
Create free roadmaps that stay in sync with apps like Jira and Asana.
Try Visor for free today.
What Are Roadmaps and Why Are They Important?
A product roadmap, like a regular map, is a way of plotting out your route from your current position, to the destination you want to reach, with all the steps, turns, and maneuvers along the way.
In product development and management, this means displaying what you need to build, when you will build it, and for what purpose, as part of the journey to building a better and more successful product. More generically, it fits as one type of “technology roadmap” along with several other more nuanced takes on plans for product and project development.
Example of Visor Roadmap using our Agile Roadmap Template:
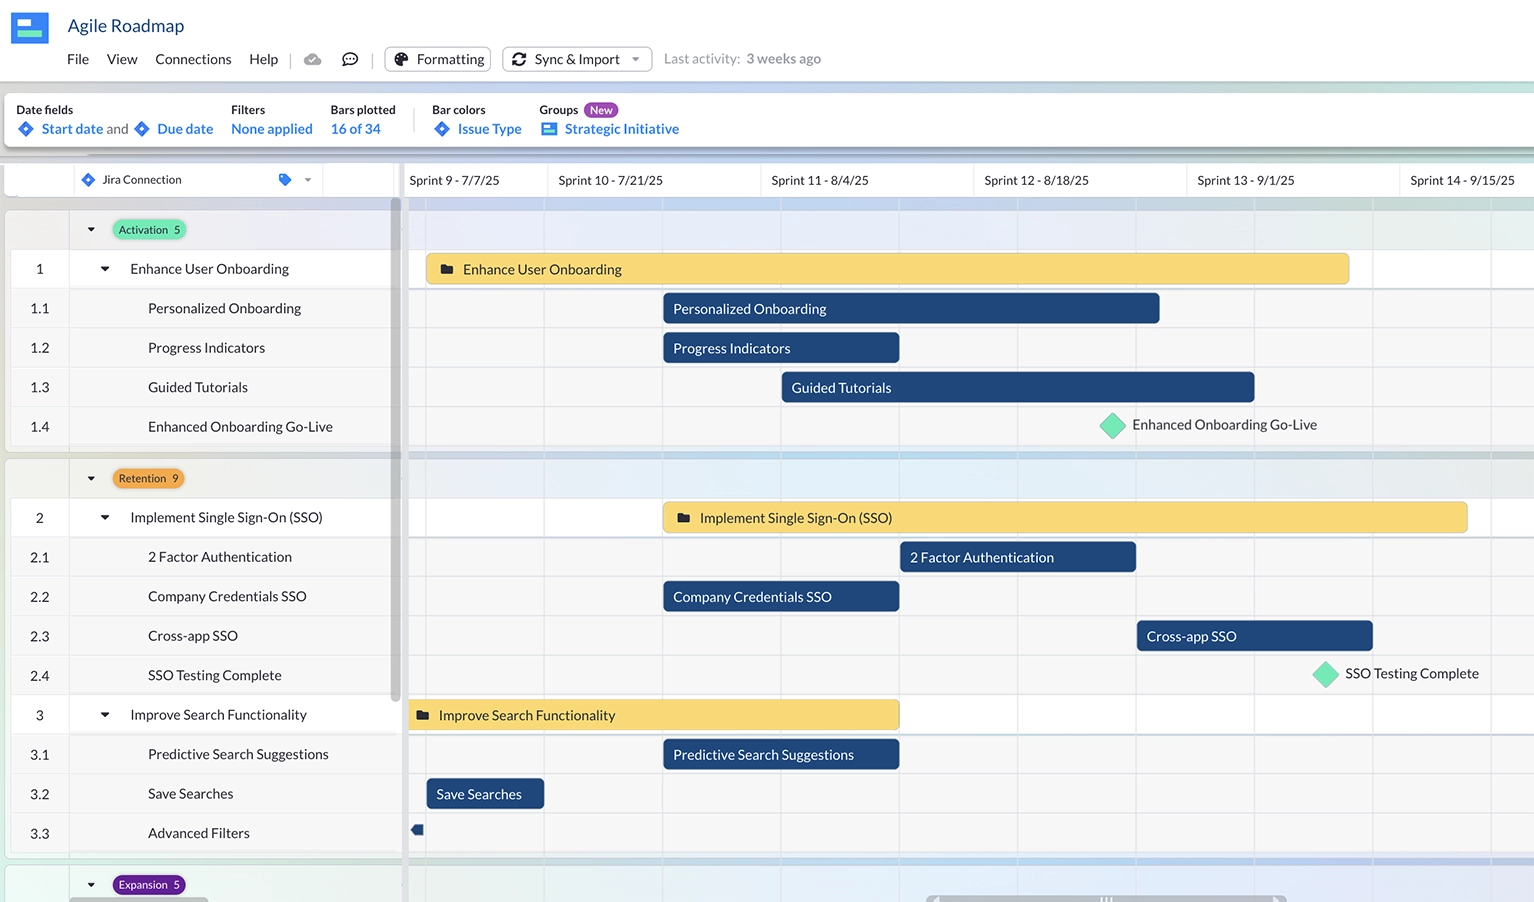
If you do this (and do it well), then your product roadmap should offer viewers both a high level view that conveys your overall strategic direction and key initiatives, and enable people to drill down into greater detail, seeing each step along the way if necessary.
Product roadmaps are important because they communicate the strategic vision and goals for your product, the work you will do to achieve those goals, and help align various stakeholders and team-members on these points. They’re a key part of any effective stakeholder engagement strategy.
Product Roadmap Visualizations – Different Approaches
Teams will use different roadmap structures and visualizations according to their industry, style of work, organizational structure, and other influential factors.
For example, a team with very linear processes, such as a company producing physical goods, will typically opt for a timeline based roadmap.
A Jira epic roadmap built in Visor, using a two-way integration with Jira
Agile teams typically use either a scrum or Kanban based roadmap. In a scrum roadmap, work is broken down into sprints, roadmap milestones, and releases. These are often grouped into functional areas, such as features, operations, design, and so on.
Example from our Release Roadmap Template:
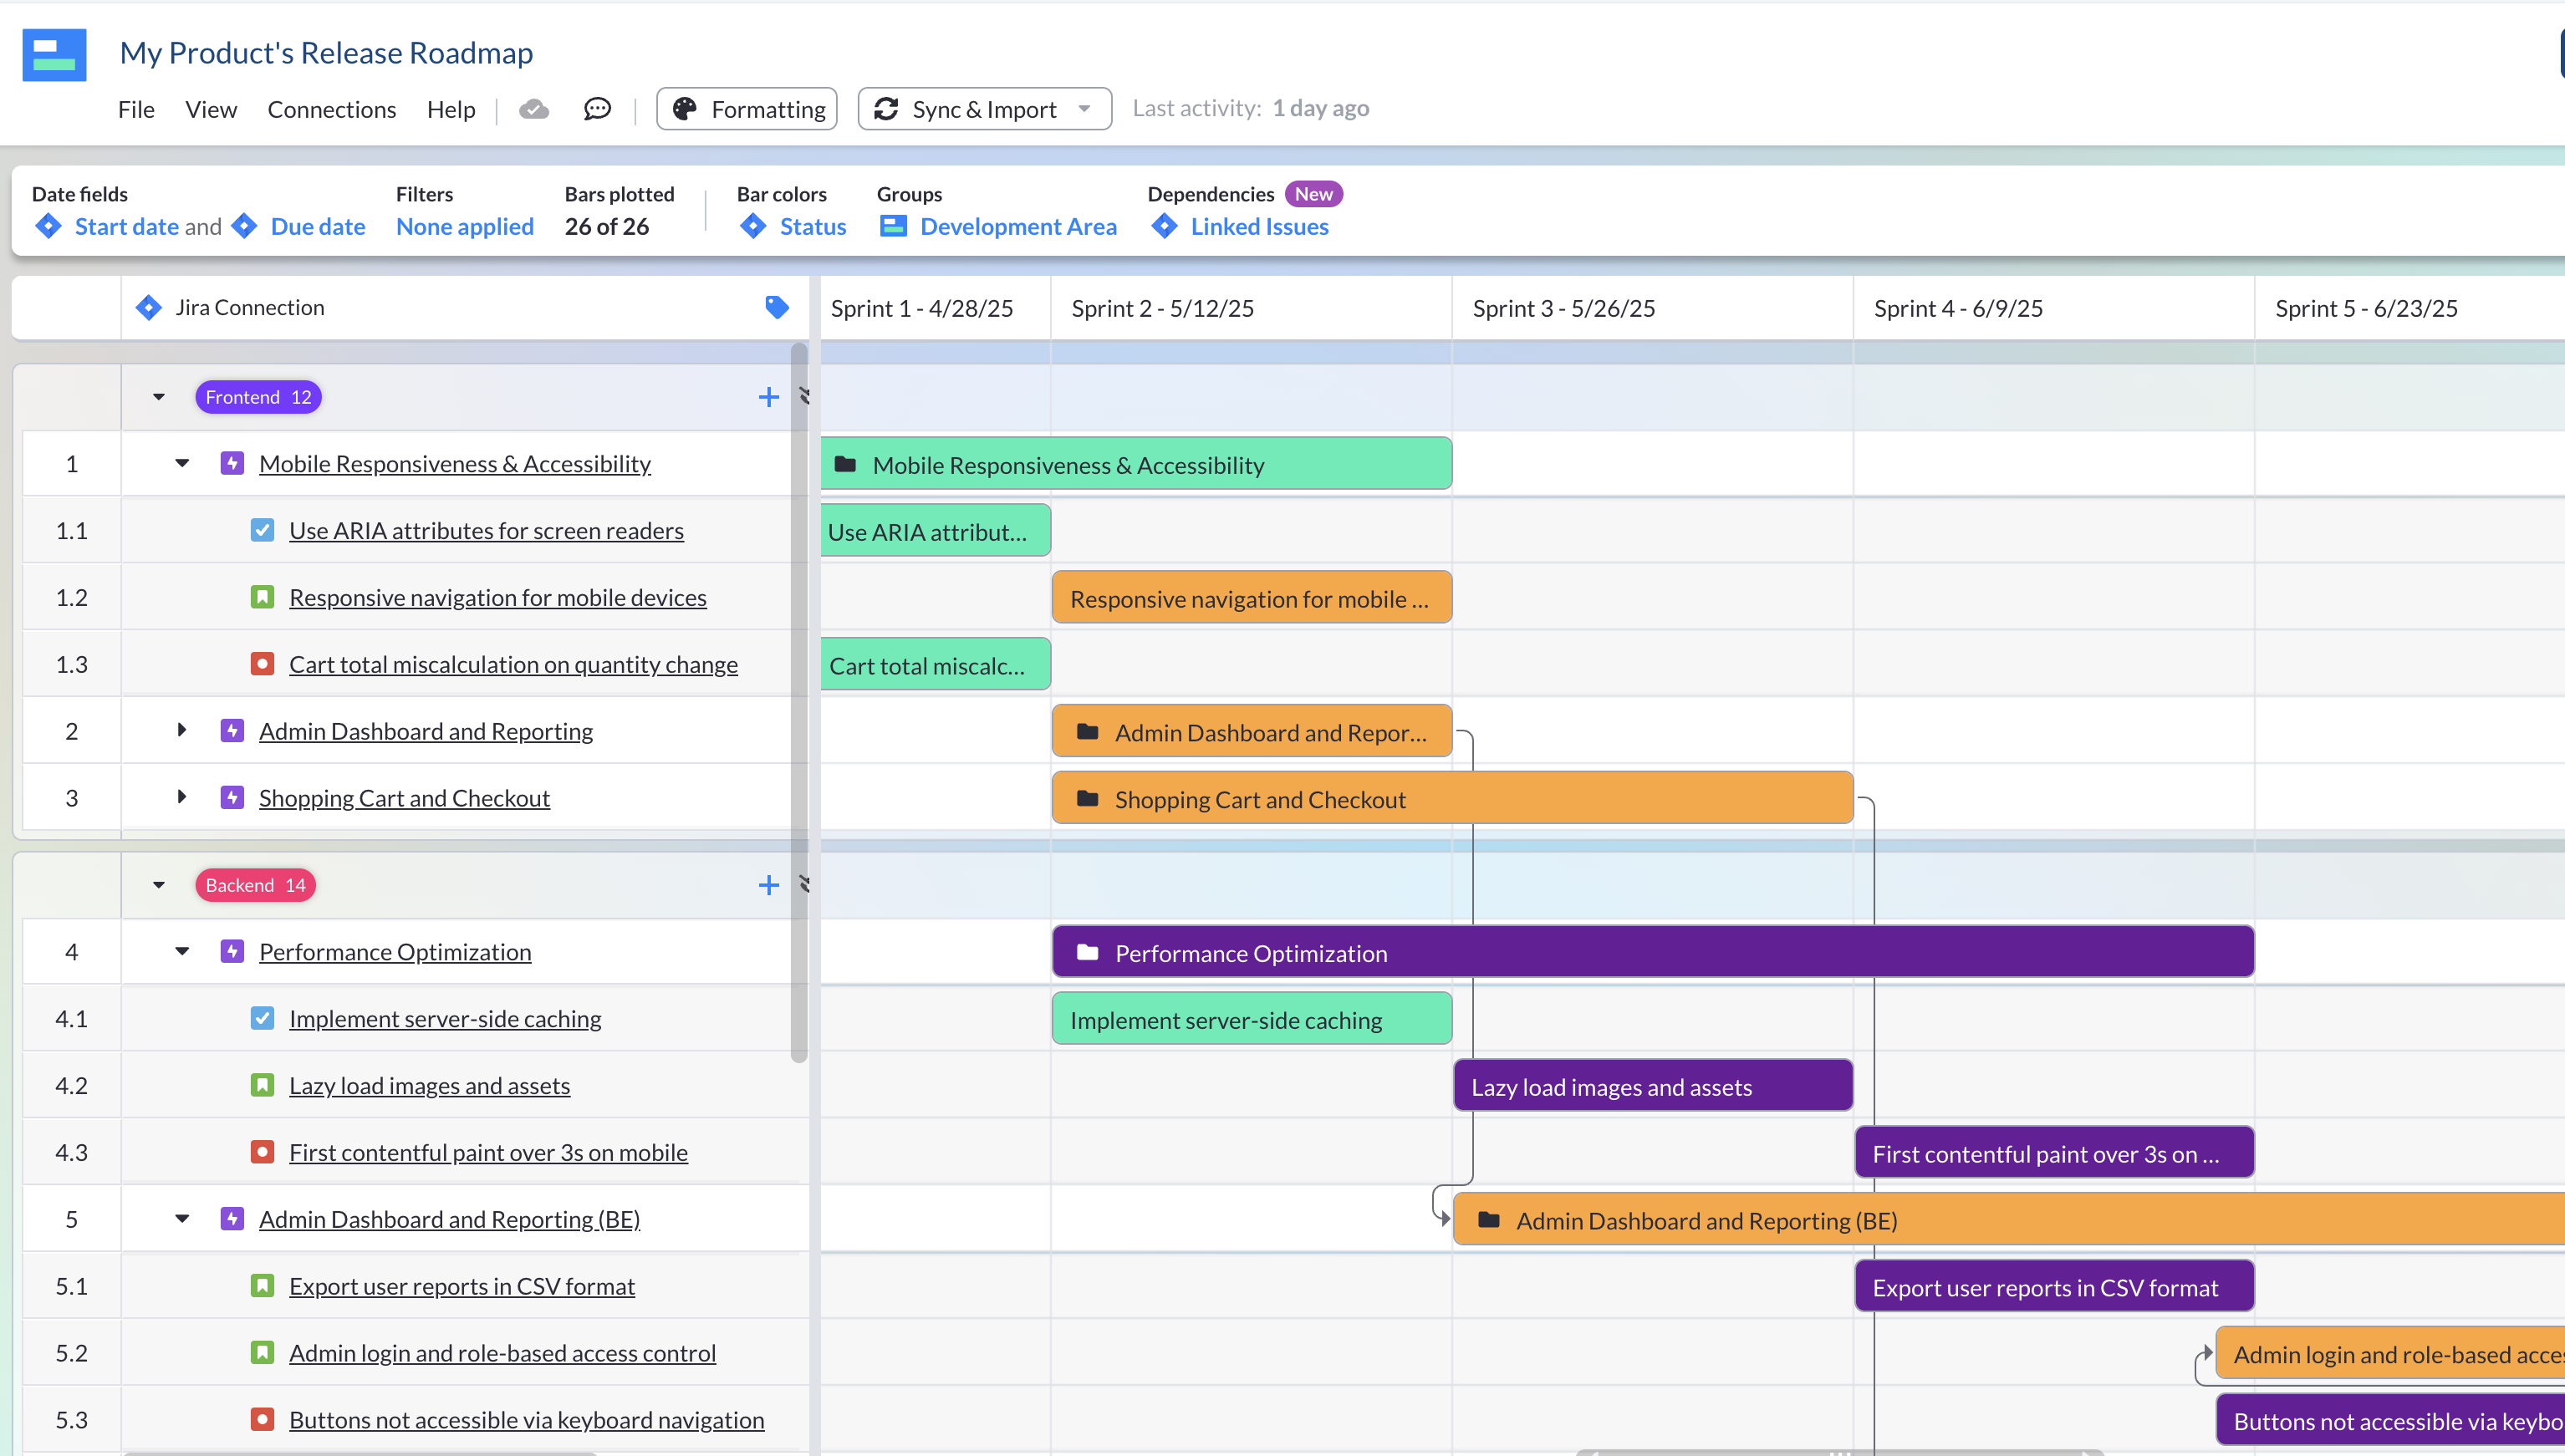
Kanban and other board-based roadmaps are hugely popular across a wide range of disciplines. Many product and development teams utilize them for roadmapping. They provide a visual, tactile, digestible way to see the status of tasks and progress them from stage to stage.
Solving Demands for Different Views
Regardless of which roadmap style you choose, you can bet that it won’t be a perfect fit for everyone.
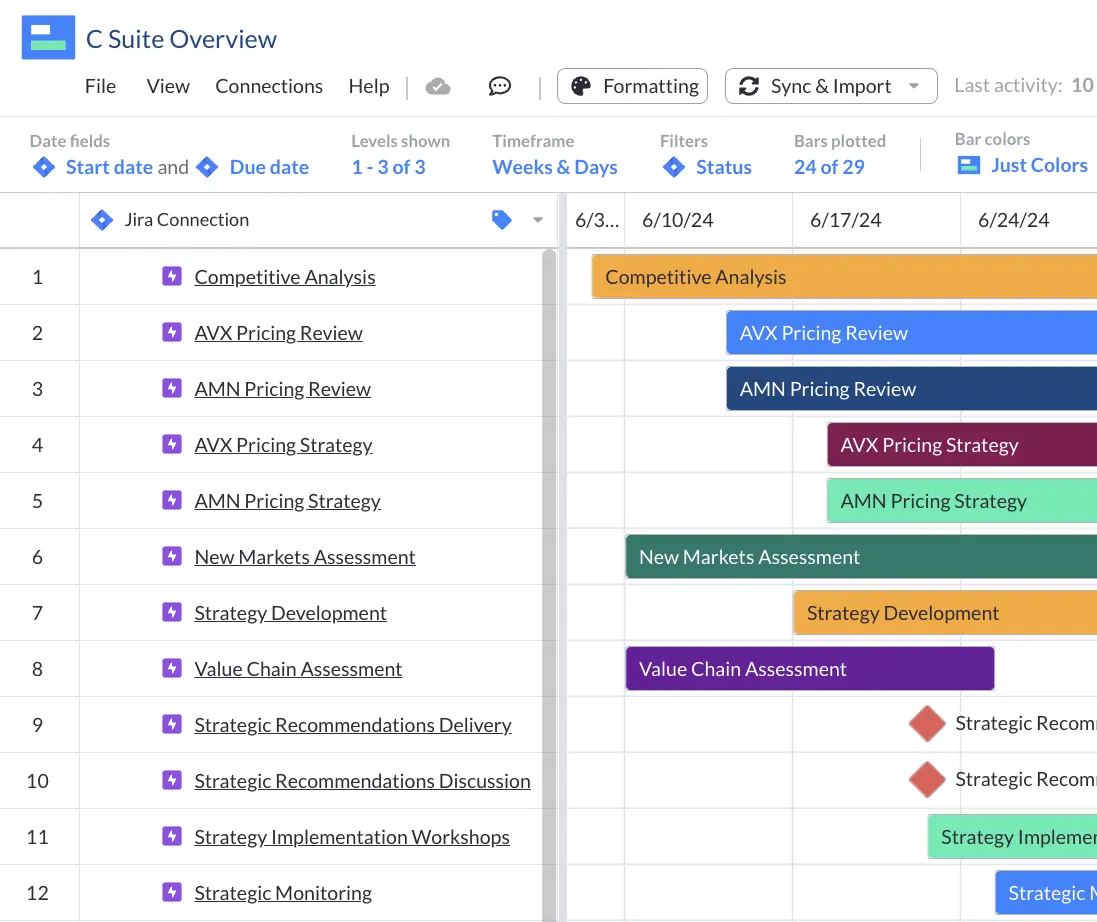
Your executive team will probably want to see a timeline roadmap. It gives them the high-level view they prefer, with just enough detail, and clear dates of what will be delivered when. From this view, they can see the overarching plan quickly and make strategic calls without getting bogged down in the details.
You will often want to see all the projects in a particular program, to do this you’ll need to be able to combine those projects into a higher-level program roadmap.
Sometimes you’ll want an even higher-level view of all the projects across your organization. This will typically take the form of a portfolio roadmap, which is focused on the highest-level details alongside details like ROI, risk, and investment.
Managing actual production and sprints in a timeline is impractical because it is too high-level. Your dev team will probably prefer a sprint, kanban, or lean roadmap, to see work organized into more manageable chunks.
If you handle these competing demands poorly, you could be left with a hybrid that no-one likes. Or you might spend hours creating and updating timelines for your exec team and anyone else who thinks that board views don’t give them “the big picture.”
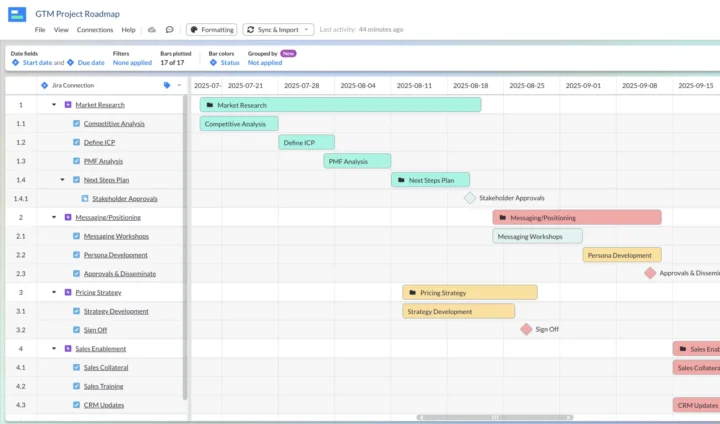
Roadmap using our Project Roadmap Template in Visor:
Solution: Multiple Roadmap Views That Sync As One
The ideal solution to the various demands for different views, styles, and levels of detail in your roadmap is to have multiple formats or visualizations of your roadmap that are synchronized, and use the same source data.
This means when your developers ship a new feature and log its status in their project management tool, it automatically updates on the detailed team roadmap, and on the higher-level program or portfolio roadmap view you’ve created too. Everyone stays aligned with the same information, but they see this information through their own specific lens which is attuned to their needs and priorities.
Roadmap visualization tools handle this scenario in different ways, with varying degrees of effectiveness and reliability.
Visor has been built specifically to perfect handling multiple formats using shared data. It has four fully customizable views (timelines, Gantt charts, Kanban boards, and spreadsheets) that stay in perfect sync regardless of where and how you make changes.
It also has a sophisticated, two-way integration with tools like Jira which you control, so that even when you’re making changes in different systems everything stays fully synchronized.
Key Steps in Creating a Roadmap Visualization
- Determine your audience/s: Who will be viewing this and what do they care about?
- Select the right format: Does a Kanban, timeline, Gantt chart, scrum, or other roadmap format best suit the audience and aim of this roadmap?*
- Select your system: Where will you create your visualization (e.g. project management system, Excel, visualization or roadmapping software)?
- Create your visualization skeleton: Determine what swimlines or buckets you will use to group your roadmap parts, and what labels, tags, or fields you need.**
- Put the meat on the skeleton: Add your product vision and goals, milestones, initiatives, features, and so on to the roadmap, with the appropriate level of detail.**
- Add formatting: Color code by criteria to make your roadmap more appealing and to communicate elements (such as status or priority) visually
- Filter to tailor: Use the tags/fields you added in step five to filter information and create custom views for different audiences
- Share and present: Use the different views you’ve created to deliver your visualization to your audiences
- Receive adulation: Humbly accept the pats on the back and nods of respect from all those senior stakeholders and team members alike
*If you’re using a tool like Visor you can switch between different roadmap formats without modifying the underlying data.
**Steps 4 and 5 will vary depending on whether you use a system that is integrated with a tool where you already have this information. For example, many Visor users create roadmaps using their Jira data, via its two-way integration.This means they don’t need to manually populate, organize, or tag the information and so on.
Product Roadmap Visualizations – Best Practices
Whether you use Excel, specialized roadmapping software, or a box of crayons to create your roadmap, you should follow the tips below to ensure it aligns, engages, and informs anyone that sees or interacts with it.
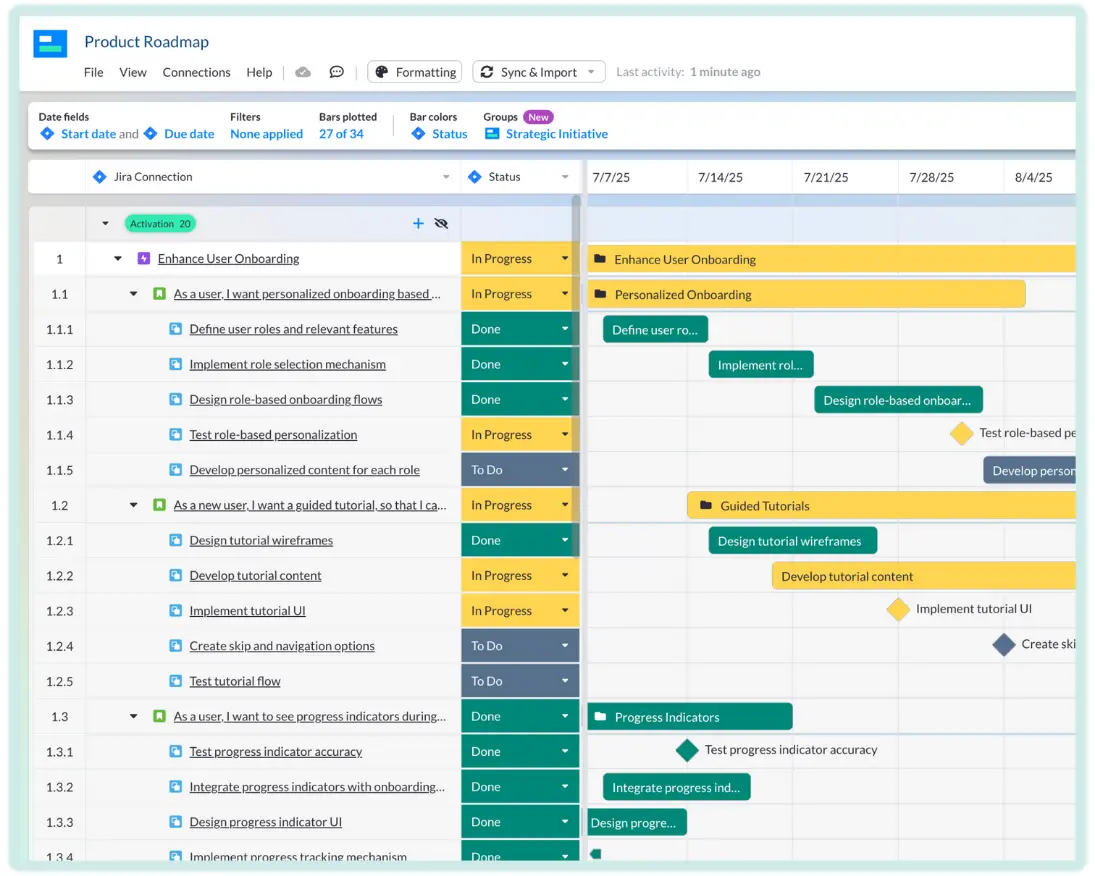
Roadmap using our Product Roadmap Template in Visor:
Use Colors and Shapes to Communicate
The best visualizations of product roadmaps use color to convey information visually, without being overwhelming or messy. This might sound simple but it’s a delicate and difficult balance to strike.
The use of color can be extremely effective when executed thoughtfully. It can enable viewers of your roadmap to instantly understand key areas without needing to read written information.
Common examples of how color coding can be used in formats like Gantt charts include communicating status; green typically being complete, orange in progress, red not started or late. Another is using color, shapes, or icons to associate roadmap tasks to overarching themes, such as a padlock for security and login features.
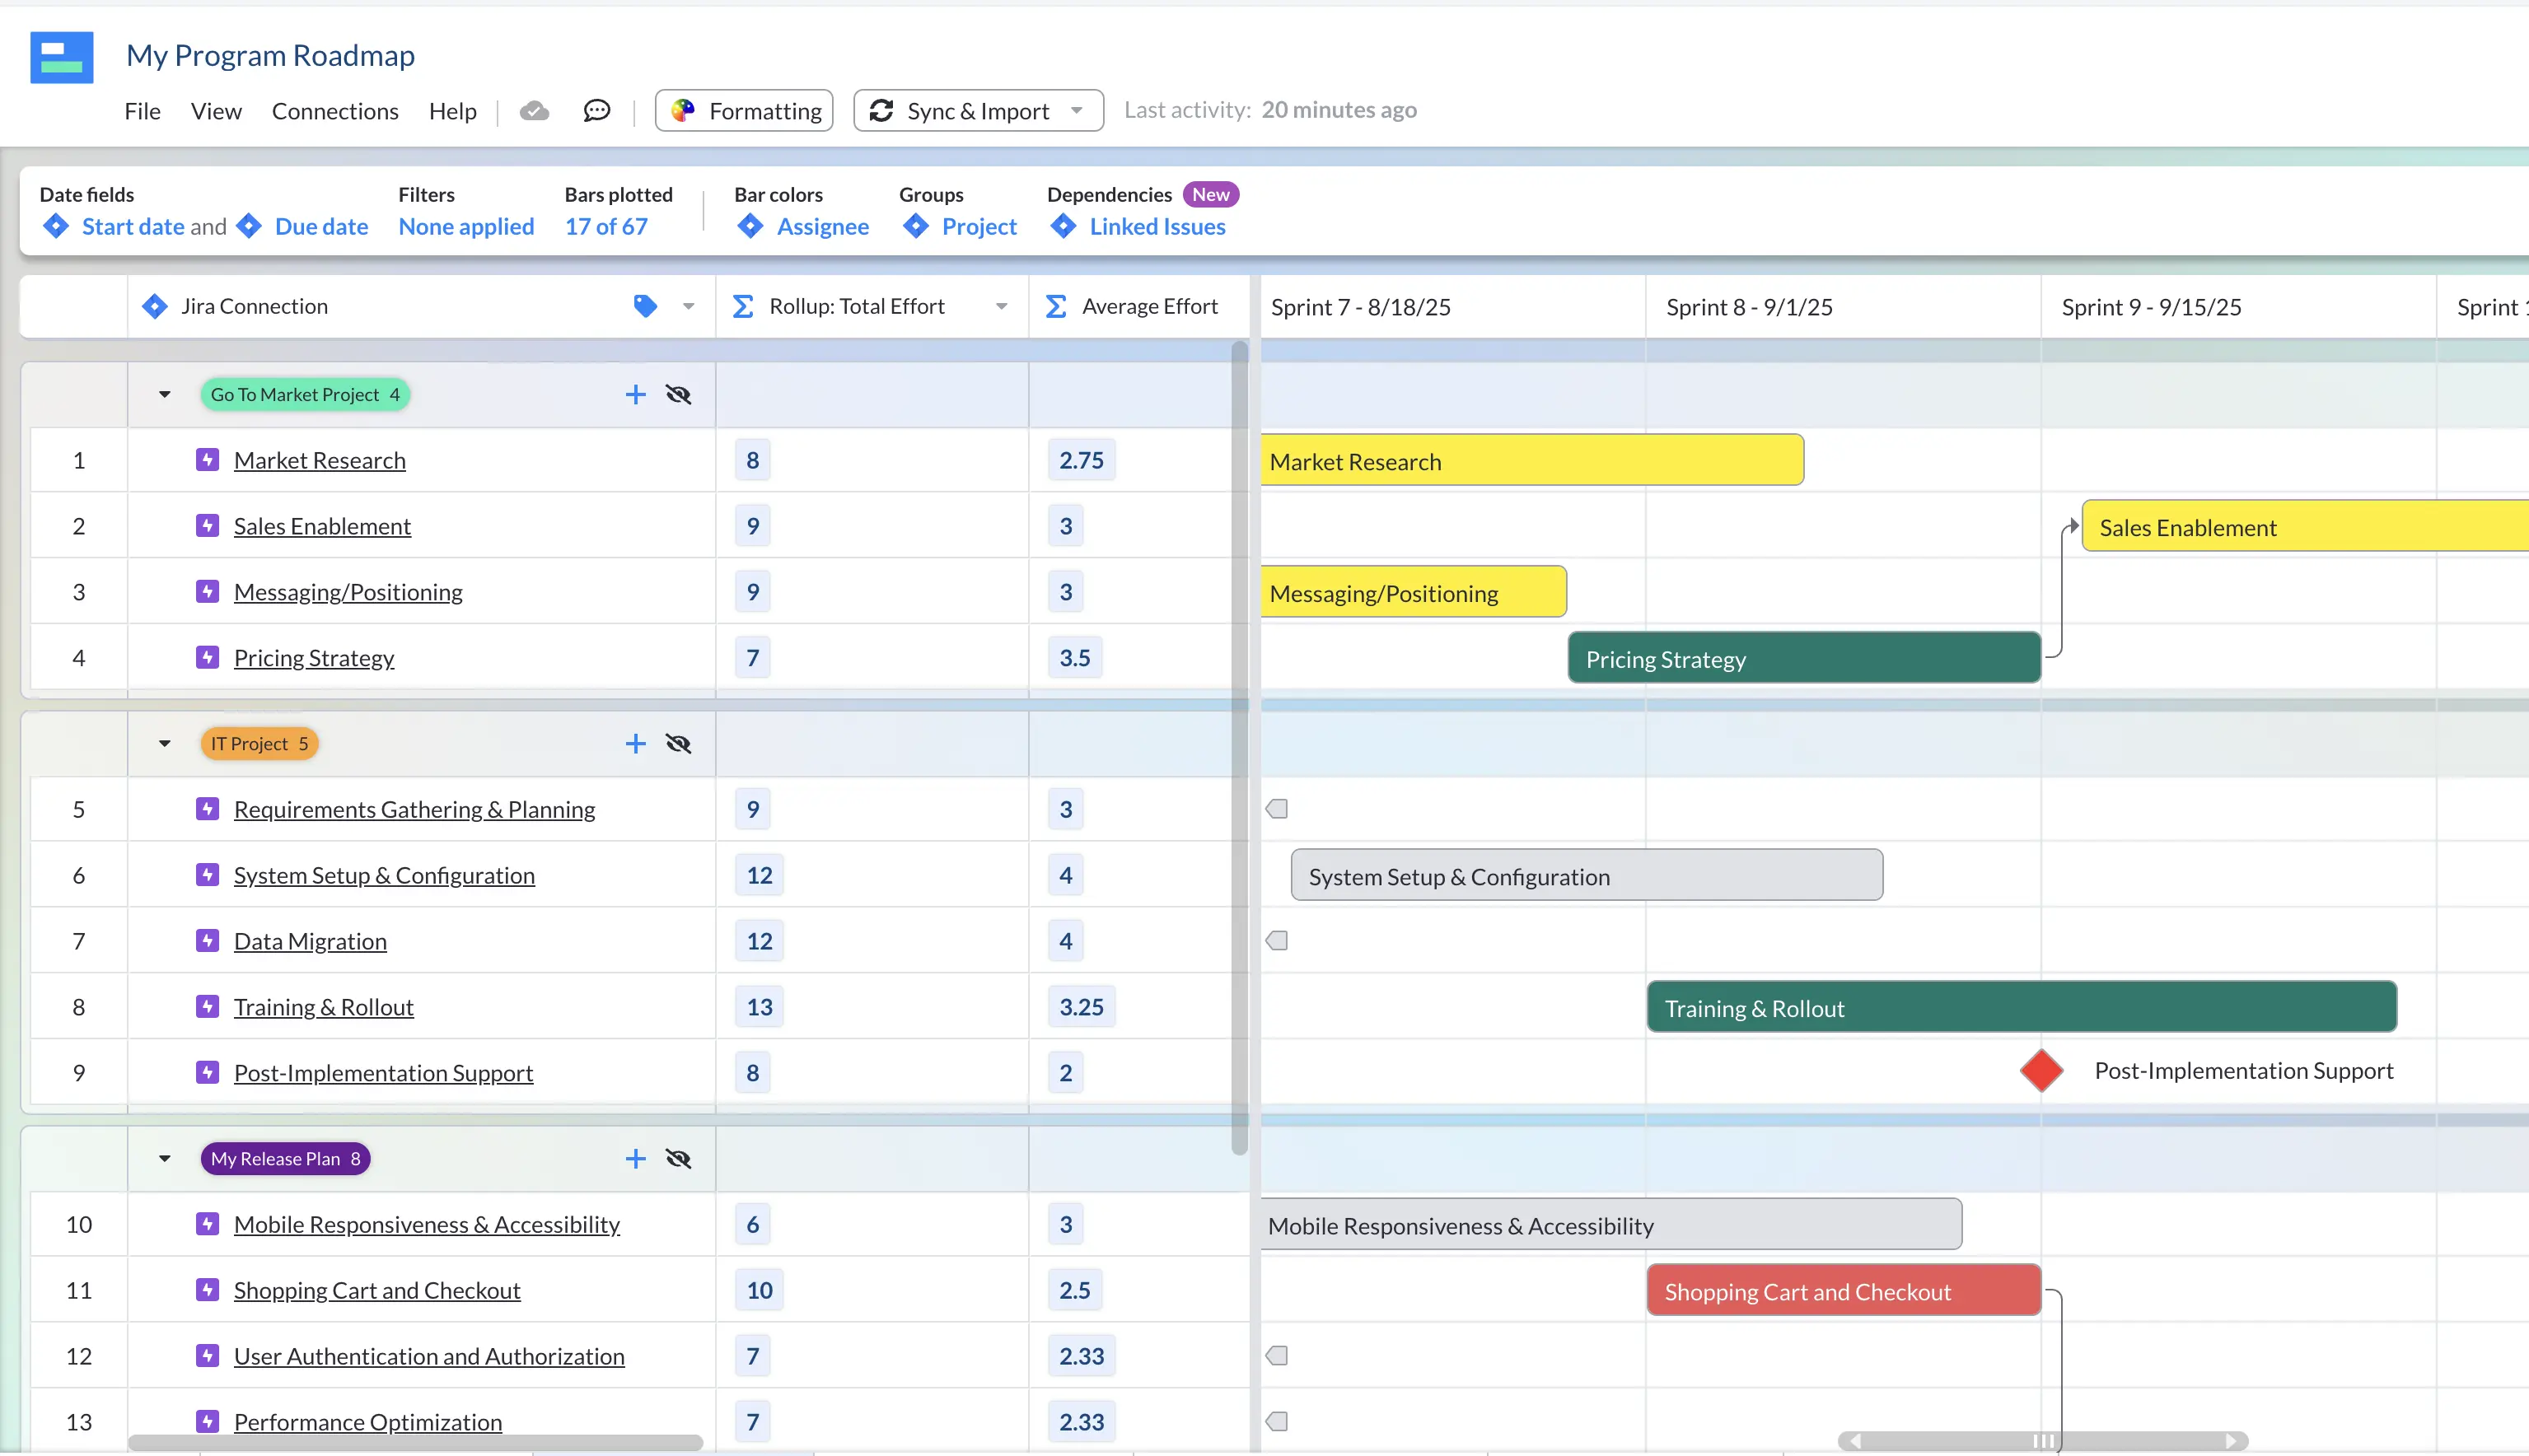
Visor’s Program Roadmap Template example using a Gantt view, with bars color coded based on Jira assignee:
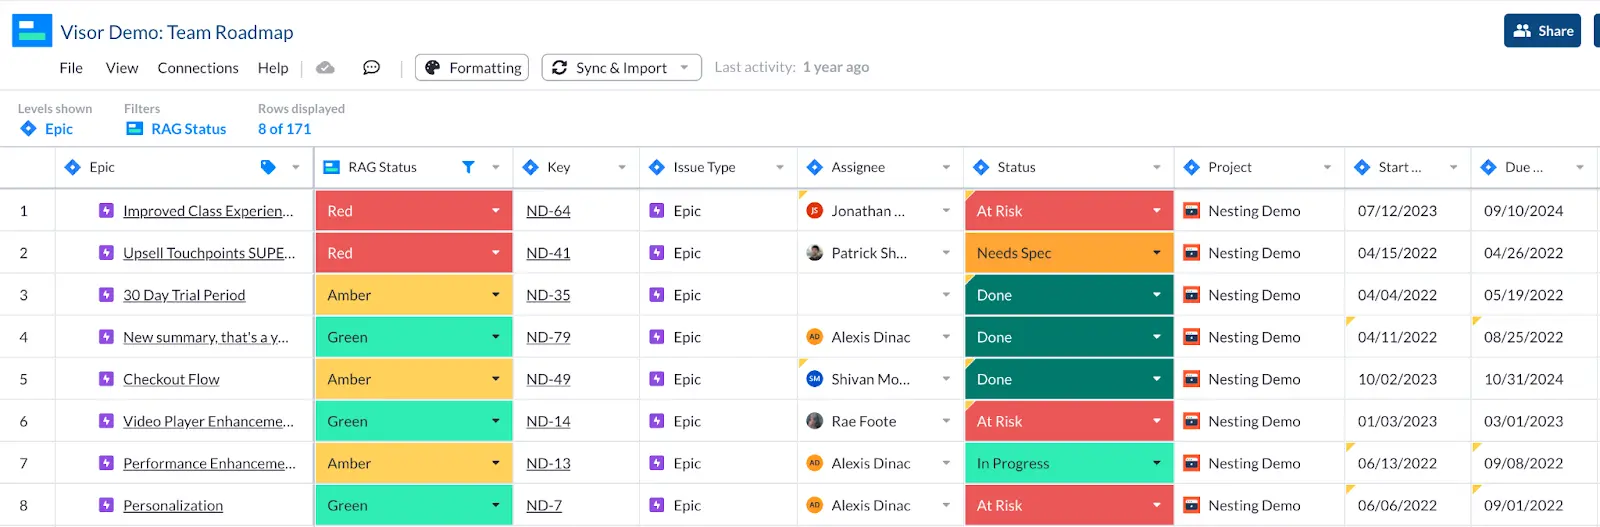
Here’s another example, again from Visor, where the user has colored both the RAG Status and Status fields to indicate how each issue is progressing:
These uses of color can sound simple, but simple is effective. Simple applications of color can make viewing your roadmap a refreshing and engaging activity for stakeholders, instead of provoking a deep intake of breath, a sigh, and a series of confused raised eyebrows. Learn more about Gantt chart color coding.
Link Tasks/Features With Strategy
Strategic roadmap visualizations should be able to show how each feature and task fits with your product strategy. Some roadmaps should link items of work with wider company goals too.
You can achieve this in different ways depending on your roadmap style. In an agile scrum-based roadmap you can create swimlanes or headers to group activities according to the element of your strategy they support.
On a timeline roadmap you create lanes for different objectives or initiatives and then add releases into the lane for the objective they support.
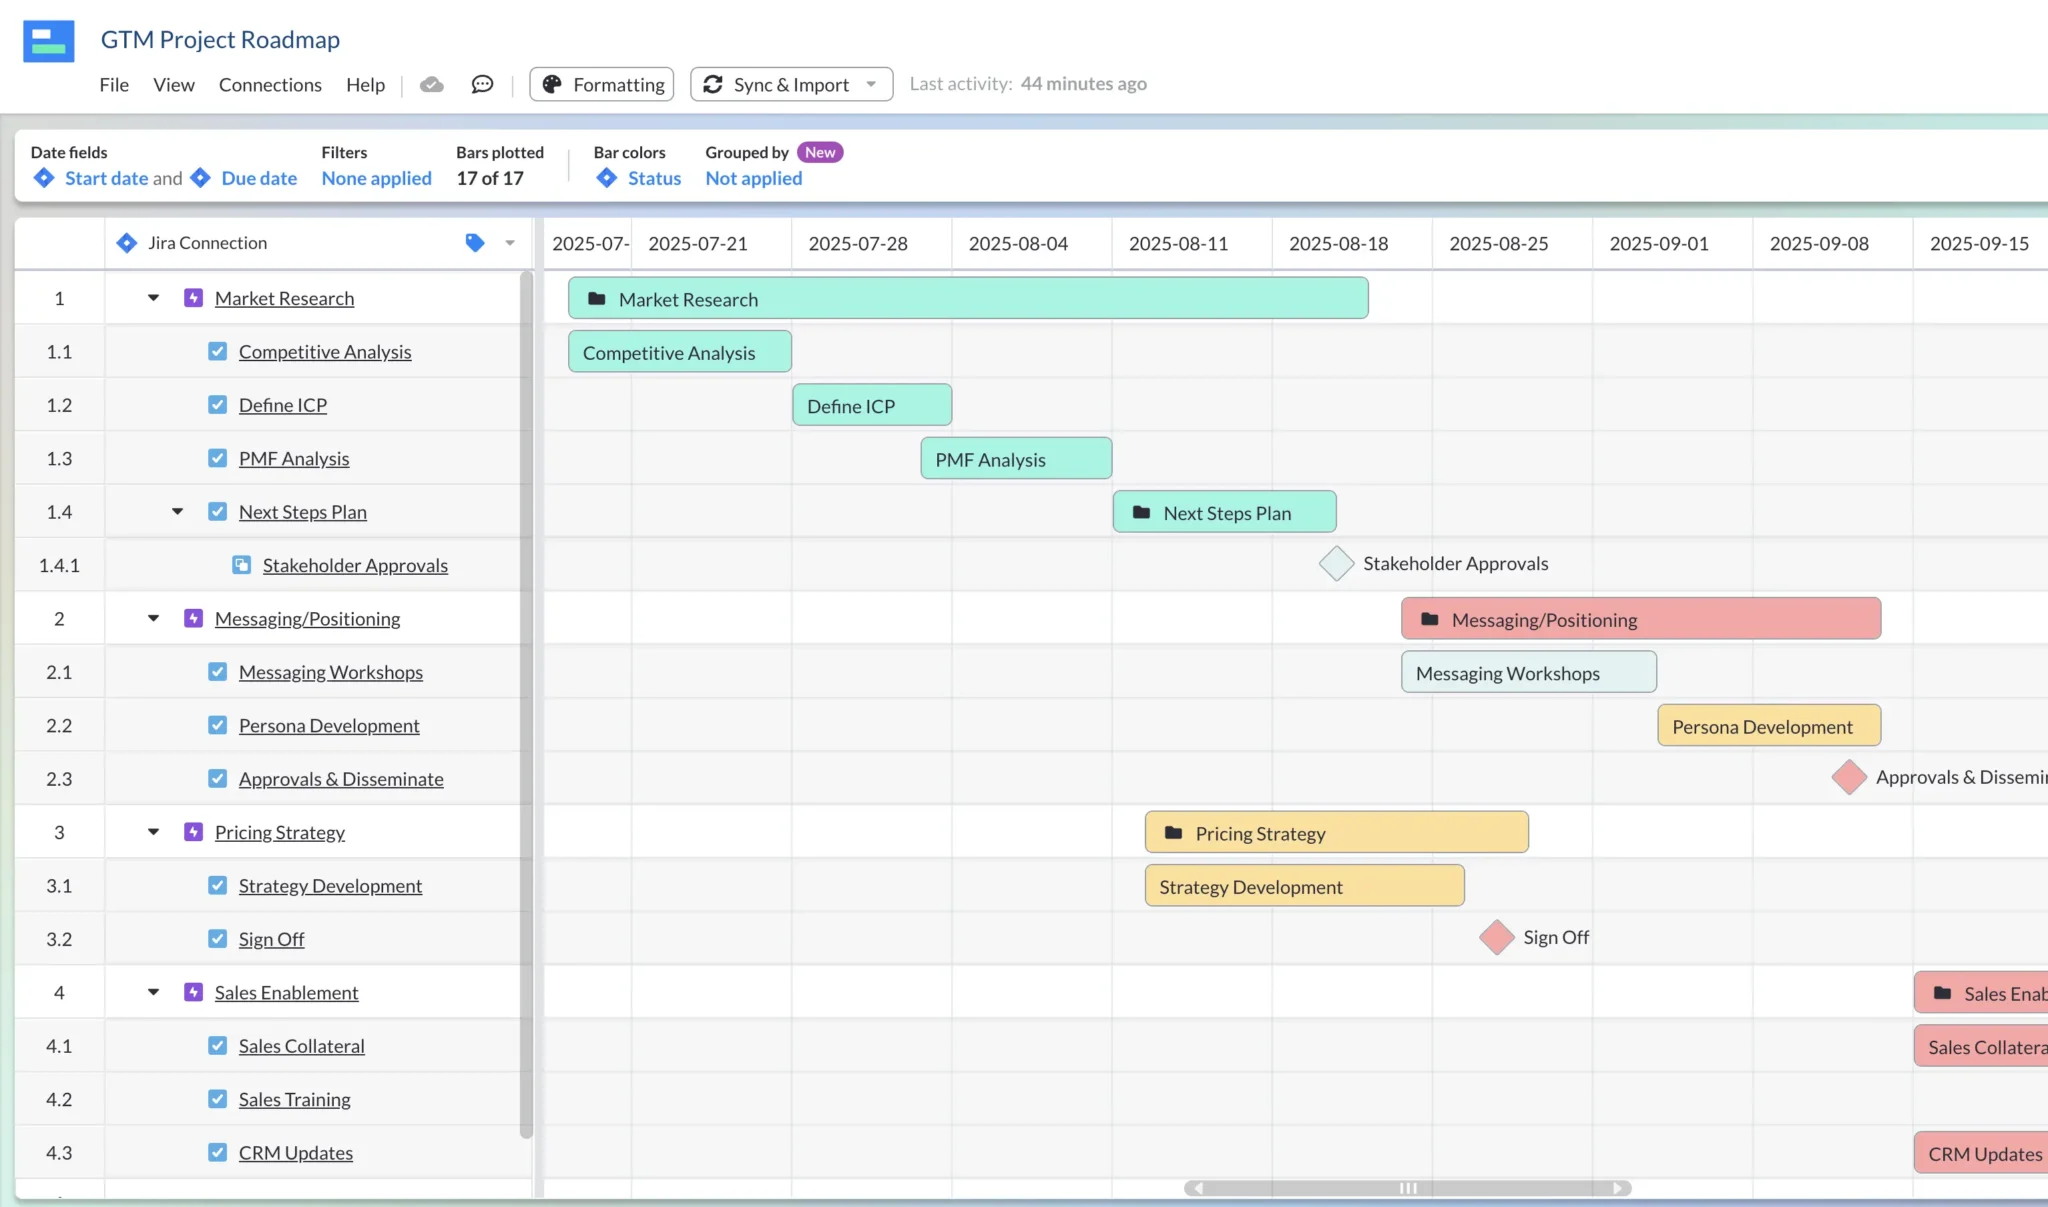
If you’re using a Gantt-style roadmap you can create rows for objectives with releases and features nested beneath them.
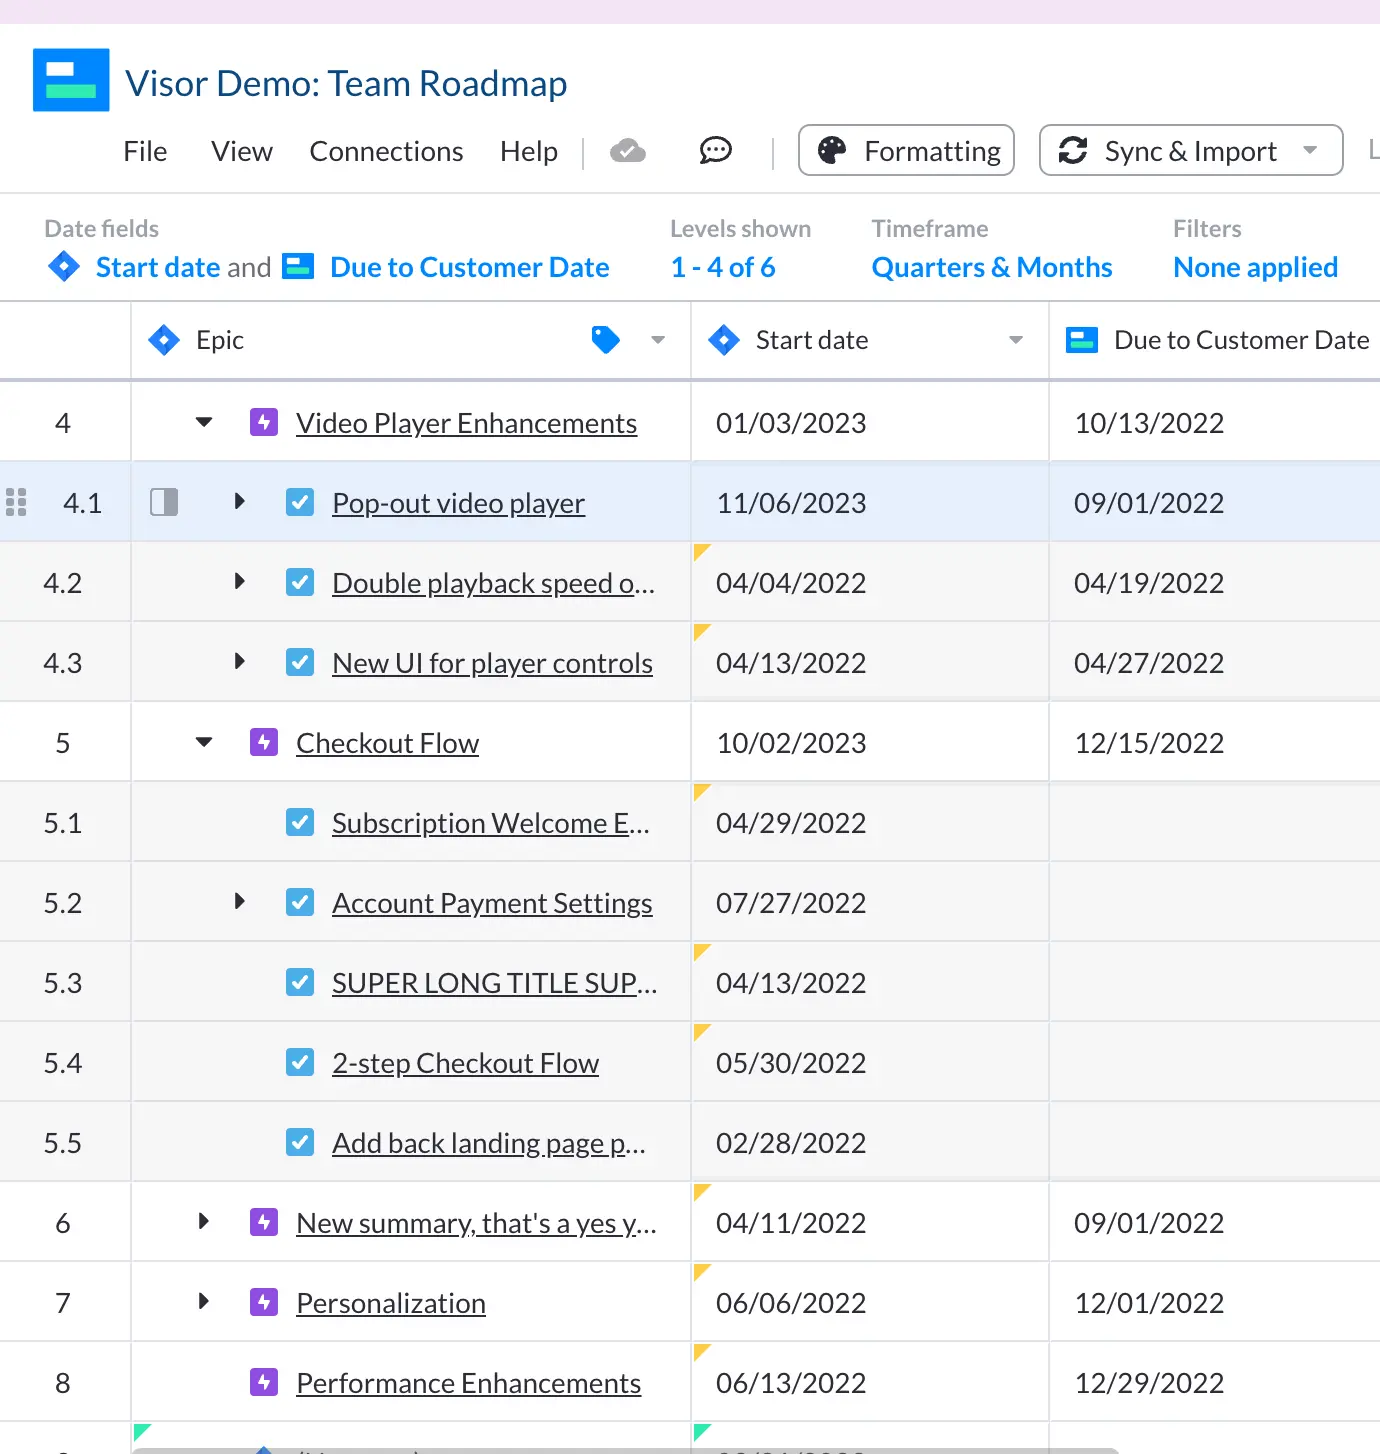
Below you can see an example I’ve created in Visor, using my Jira project. Epics, issues and subtasks are automatically nested as they are in Jira. Using the small arrow icons I can toggle which level of issue type I want to show:
Here’s a roadmap built in Visor, which I’ve filtered to just show epics and their issues:
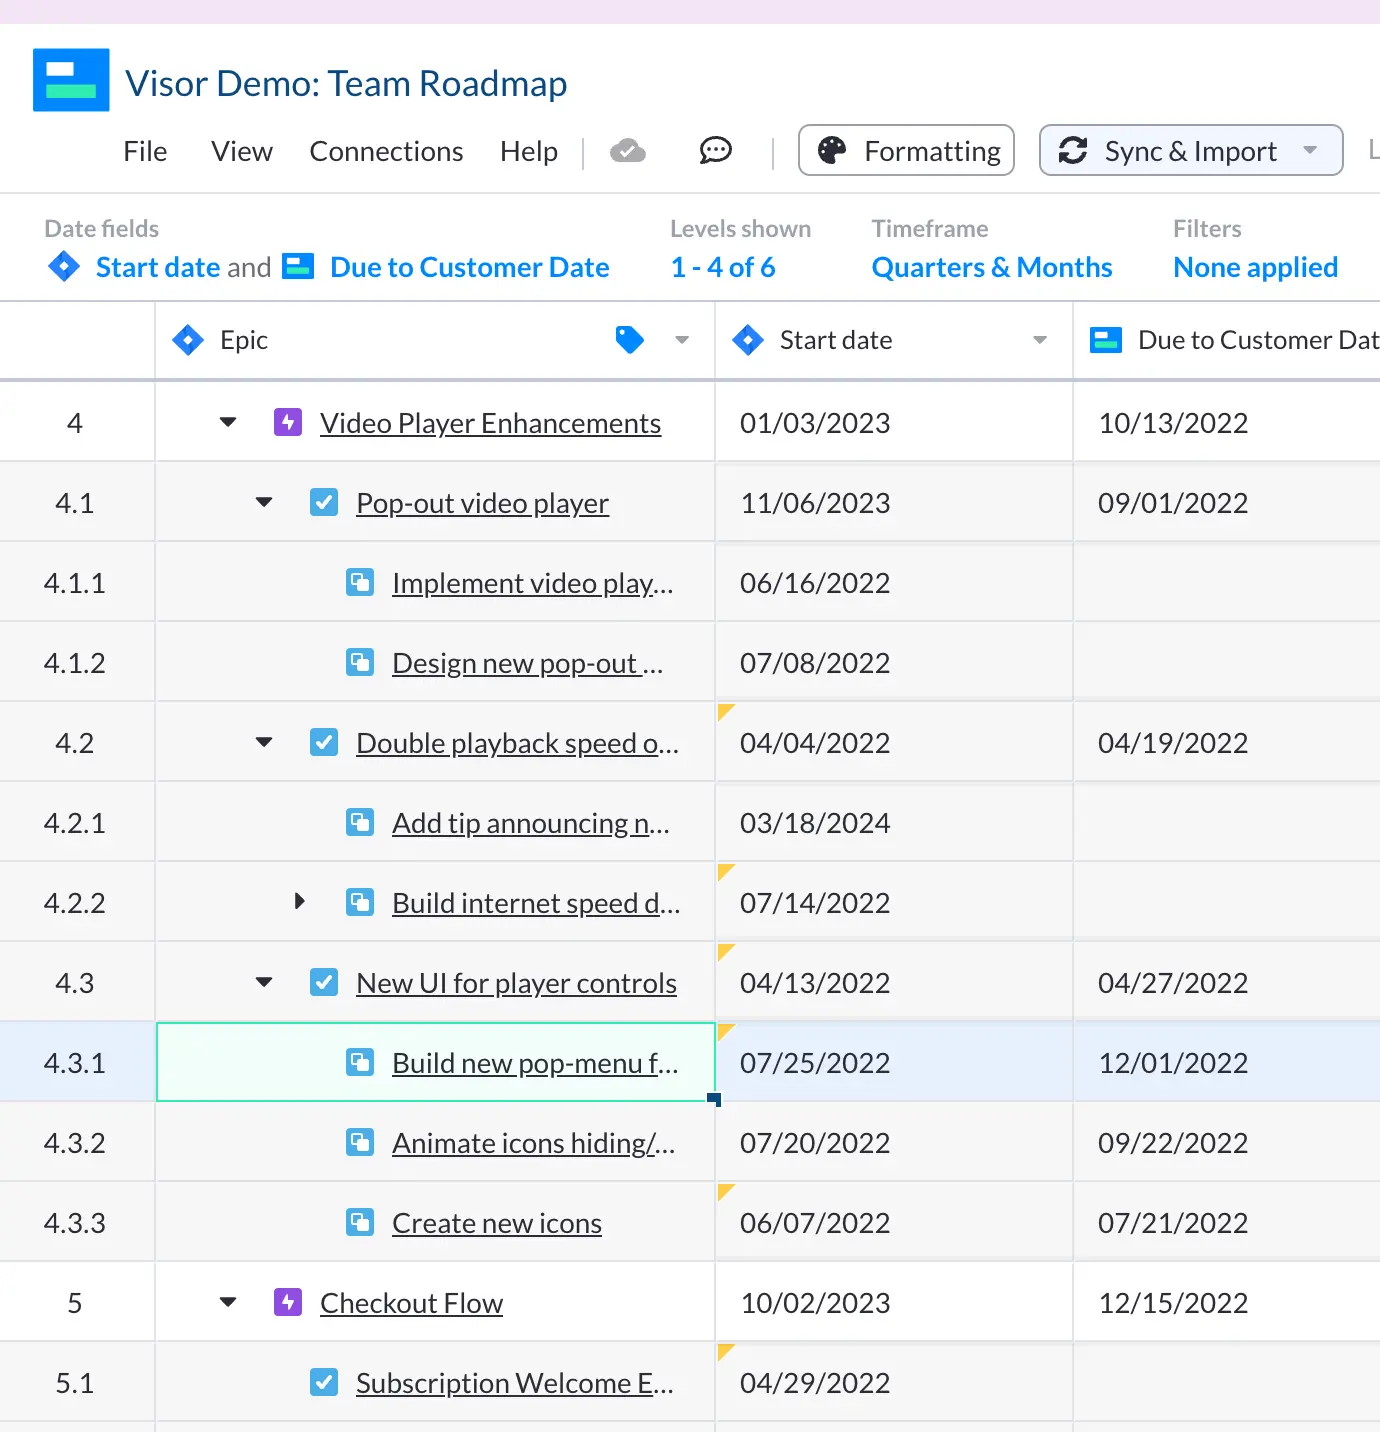
Here I’ve created another view in Visor, based on the same roadmap, but toggled the filters to show epics, their issues and subtasks:
I can then save these toggled views and share with different stakeholders, who require different levels of detail. Visor keeps these views in sync, and in sync with my Jira project too.
Build In Responsiveness To Your Roadmap
Most people create visualizations of their roadmap using some form of software. This could be something as simple as Excel, or PowerPoint (which I would not recommend by the way)., or something more specialized.
Whatever you’re using to build your roadmap, you should use its features to make your roadmap responsive to different questions people have. What this means in practice is using fields, tags, and labels on each roadmap item. You can then filter by any criteria to create a view of your roadmap for any person, team, task or scenario.
This transforms a roadmap from a static object into a scope that can be zoomed in, or out, and pointed to focus on different areas.
For example, you can filter your roadmap to show only the highest status initiatives. Or to show people only the tasks they or their team are responsible for. You can use tagging and filters to show just those features that are especially significant for enterprise clients. I’m sure you can think of many more examples too.
It’s crucial you think ahead and add these tags or fields from the outset. You can add them in later, filling in the details for each roadmap item, but that’s a rather laborious and boring activity for anyone to undertake.
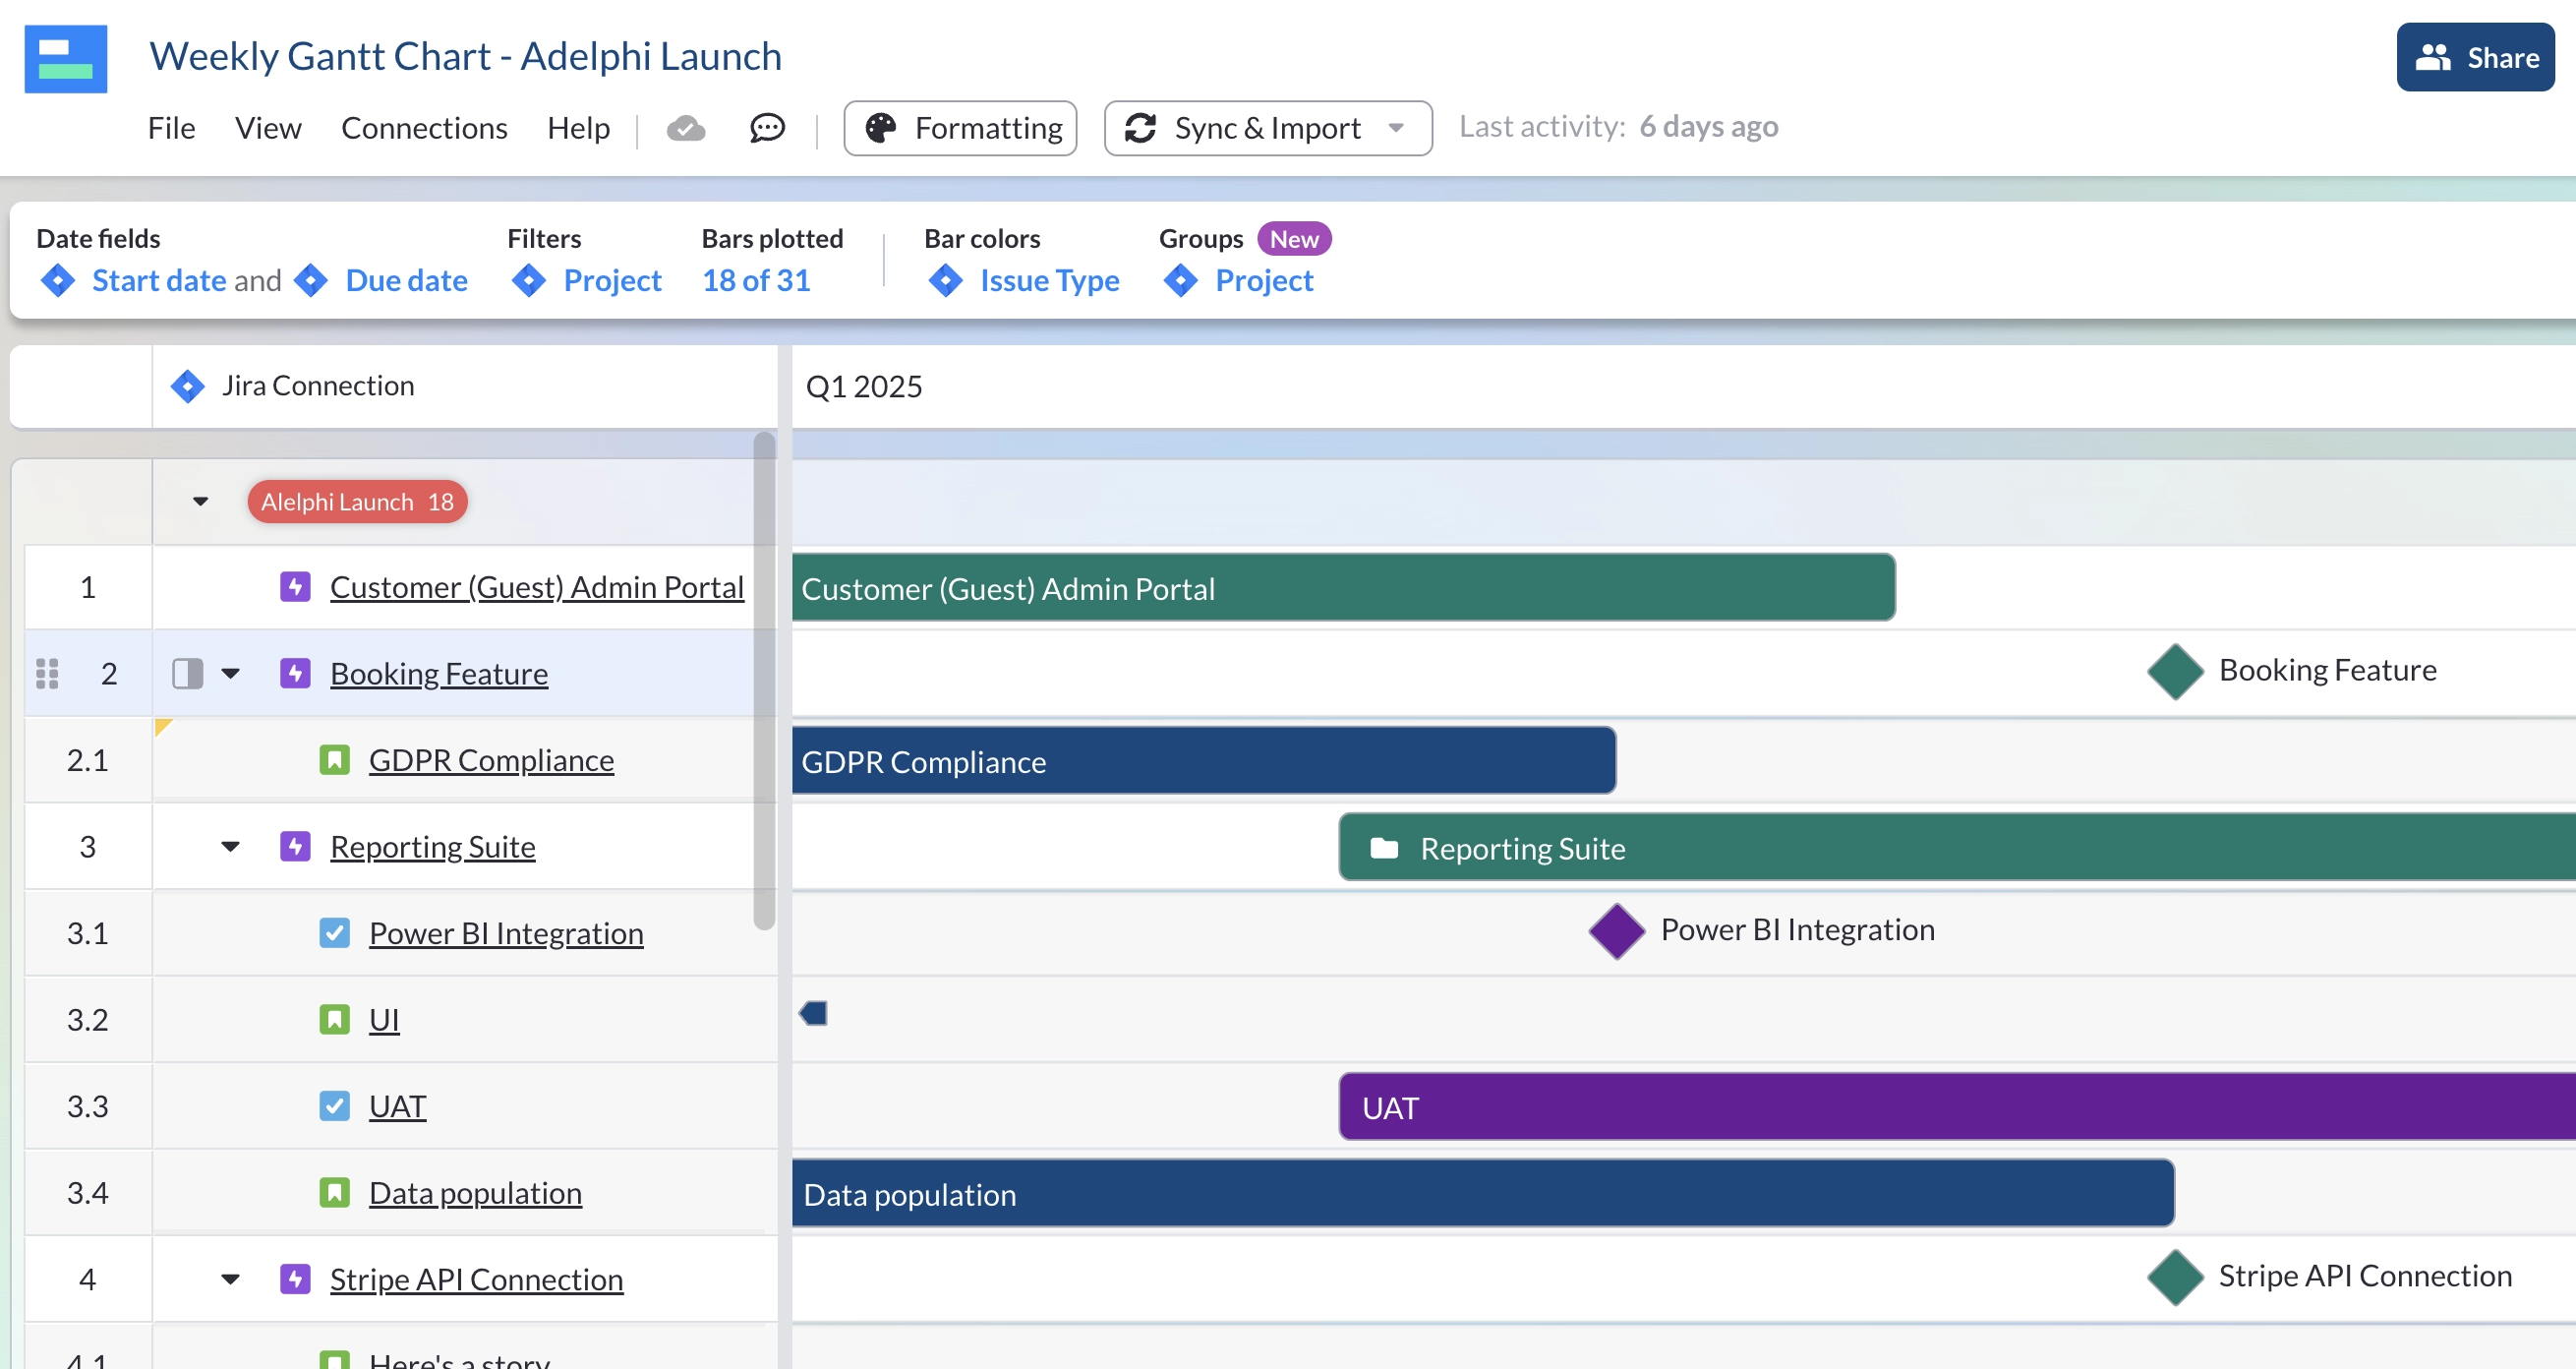
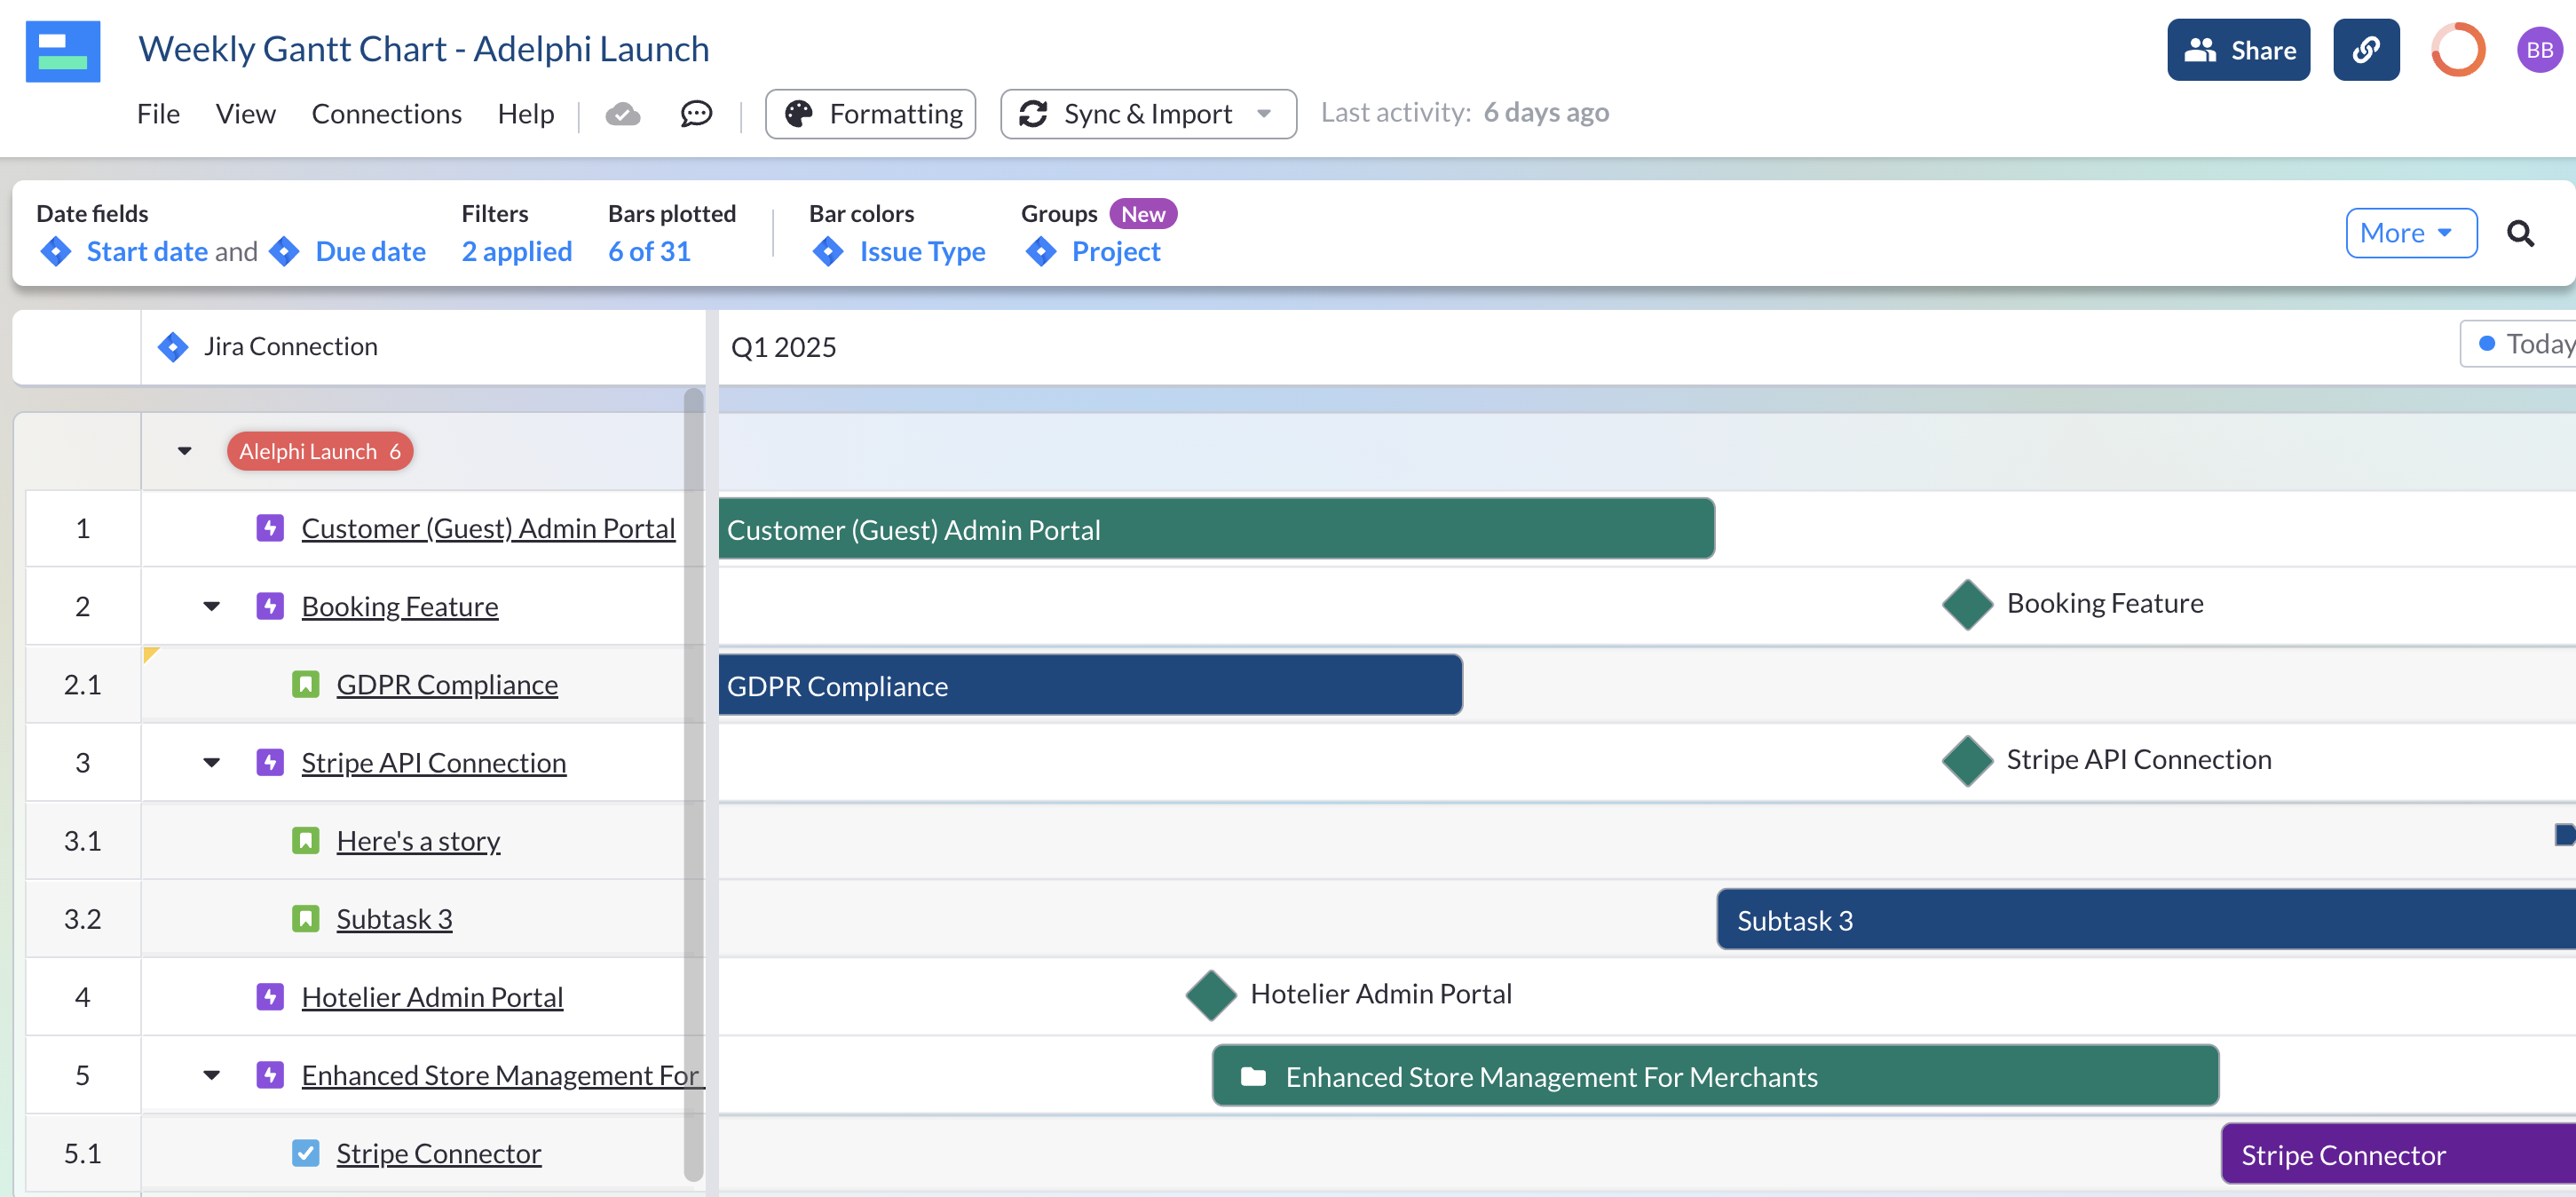
For example, here I’ve used the filtered by Visor roadmap to just those tasks that are labeled with “Adelphi Launch” project:
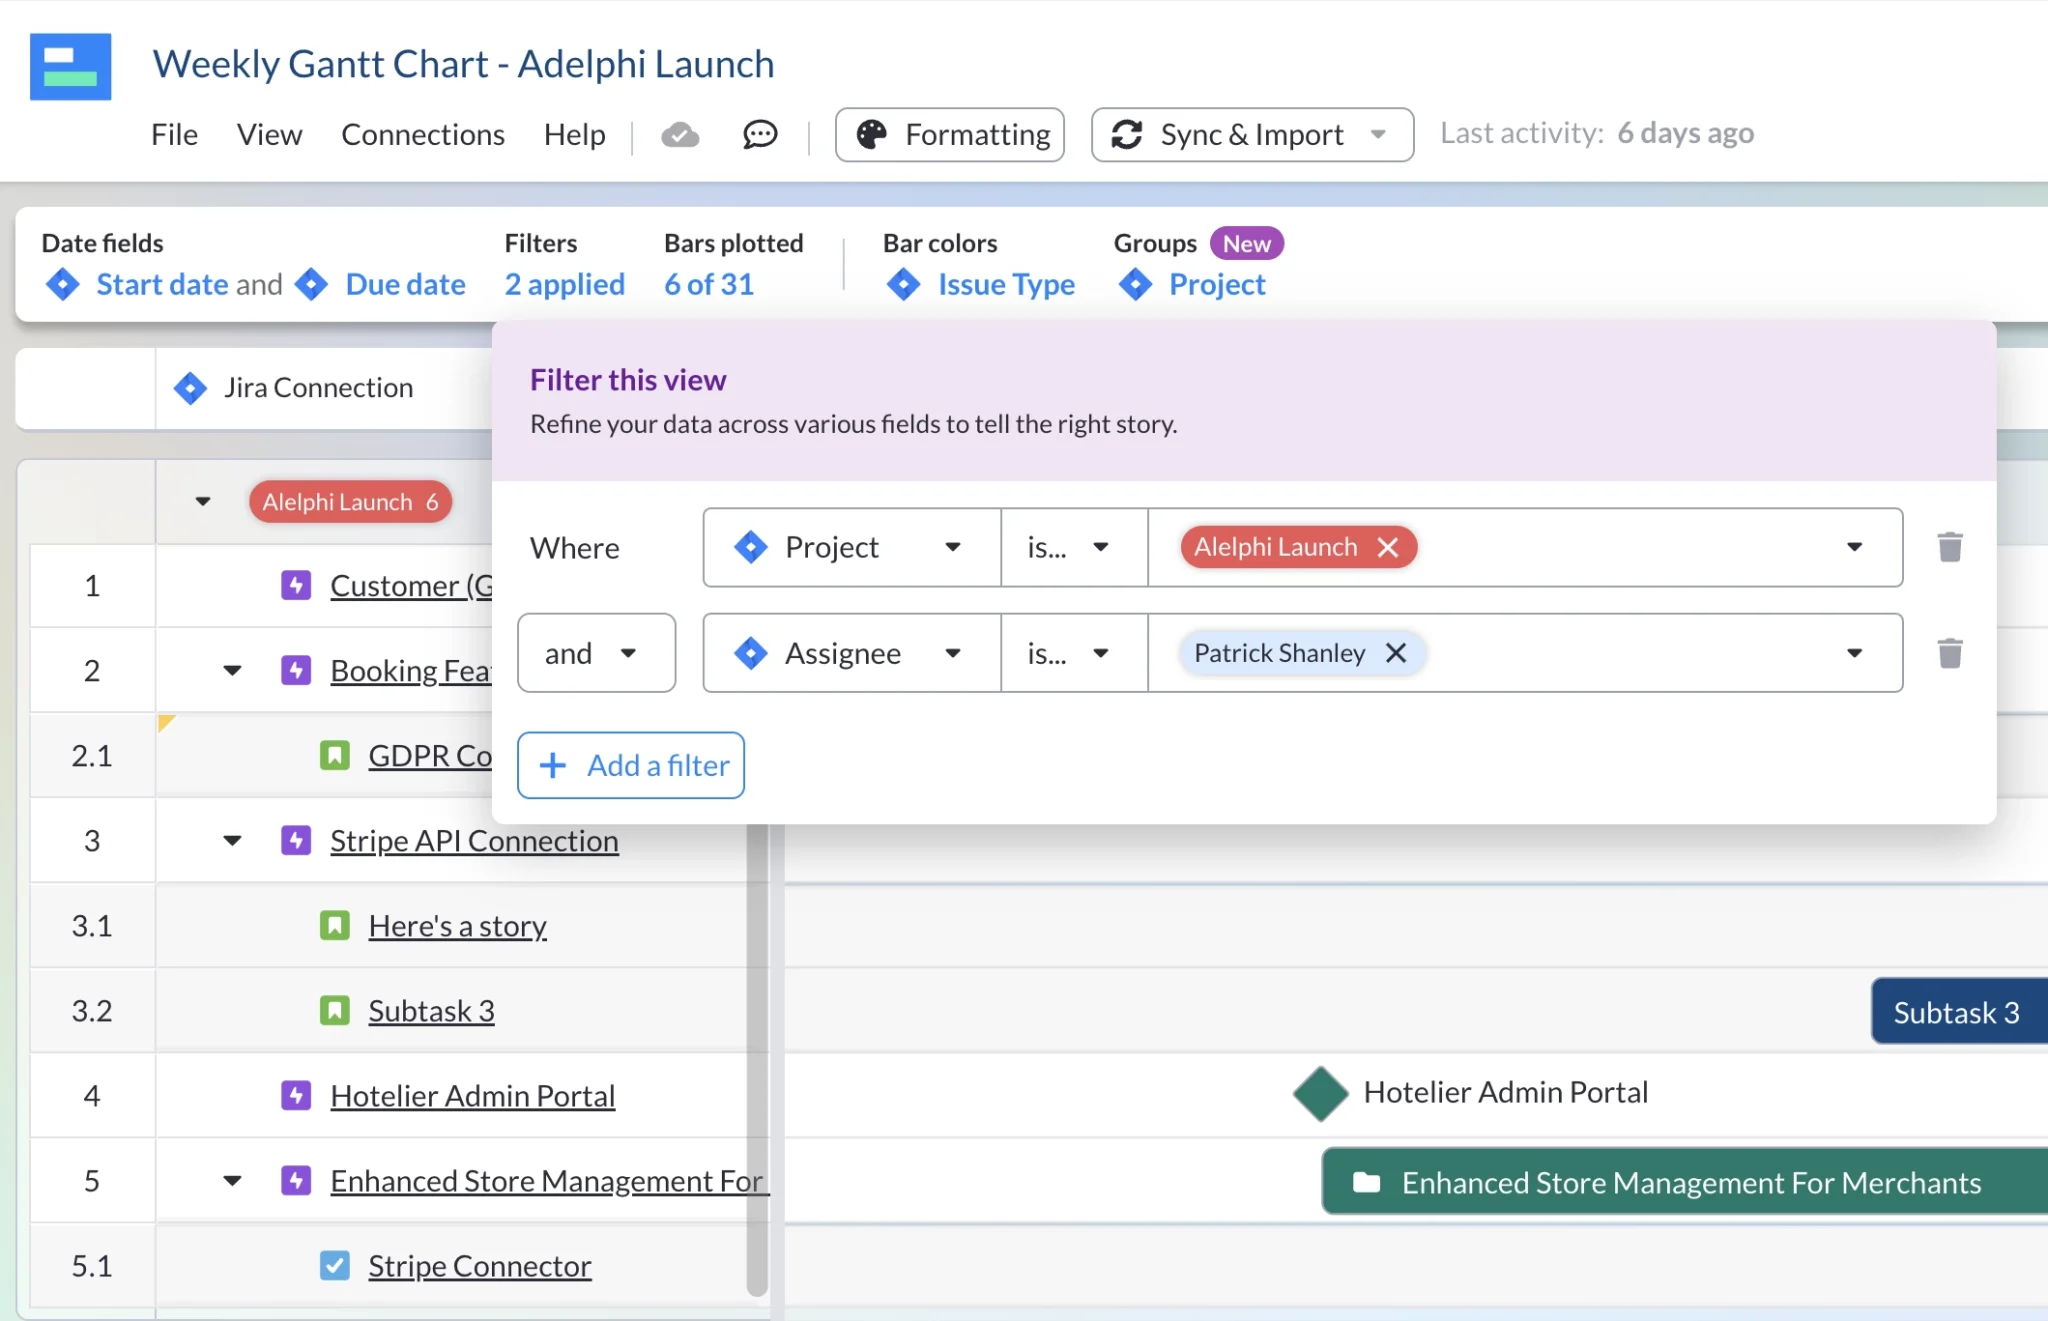
Next I’ve applied another filter to create a view for Patrick, so he can see the tasks he is responsible for as part of the July launch. I can then save and share this view with Patrick:
Visor allows you to include multiple filters in a roadmap:
Here’s the view I created for Patrick in Visor showing just his tasks:
Keep It Accurate and Up-To-Date
You want the information in your roadmap visualization and project management system to match up, even if they’re used to view objectives, projects, and tasks at completely different levels. This is especially true as projects progress and you need to keep your roadmap up-to-date.
At first sight the easiest way to do this is to build your roadmap within your project management system. However many project management systems have basic, or difficult to use roadmapping functionality, if they have that functionality at all.
You can create roadmaps that are disconnected from your project management system, but this creates admin burden and risks information becoming stale, or errors creeping in when the data is entered manually.
Most teams will branch out into some form of roadmapping or visualization tool. If you do this, too, you need to ensure you have a robust two-way integration between the two tools. This will ensure both tools stay in sync.
Improving Roadmap Visualization Skills Video Tutorial
If you’re looking for ways to uplevel your roadmap visualization builder skills, there are a few way to make it happen.
First, understanding which tools are the best ones for the job is crucial. We’ve used Visor as our example throughout this article, but you can always do more with the tools you’re already using.
Make better roadmaps in:
- Asana – A flexible system can lead to messy, overcrowded roadmaps. Learn to keep your Asana roadmap visualizations sleek and simple.
- Jira – A big downfall is the missing milestone functionality in Jira. But if you’re savvy, you can learn to work around Jira milestones.
- Roadmunk – Fine if you’re using it on its own, but the tricky integrations might throw you off. Decide if you can live with the expensive Jira integration, or if you need a Roadmunk alternative.
- Productplan – Focused on making roadmapping fast, this is a great tool if you’re in a pinch. You may need some workarounds to share the way you like with Productplan.
- Other tools – There are a wide variety of roadmapping tools on the market. Learn to understand product roadmapping tools to pick the best one for you.
Using the best tools for the job also means getting a good grounding in when to use a Gantt chart, timeline, or some other view for roadmapping. Do your homework to make sure you understand the difference between different roadmapping views.
This video can help you learn even more tips and tricks for roadmap visualizations.
Project & Product Roadmap Visualization Tools
Roadmapping visualization tools enable you to build roadmaps and present them in a wide range of views and formats. Many general product management systems include roadmapping functionality, too.
Every roadmap visualization tool, whether it’s standalone or part of a bigger system, has strengths and weaknesses. The experience of using each can vary wildly, and the best one for you will depend on your needs, what’s important to you, your team and organizational setup, and the systems you use already (e.g. Jira, Azure Devops etc.)
To help you sort through the morass and find the best tool for your specific needs and preferences I’ve written this guide to the best product roadmapping tools.
If you’re short of time here’s some key tips:
- Consider the types of roadmaps you need to build and see if each system accommodates them.
- Check the pricing, look for hidden or escalating costs.
- Check out these agile product roadmap templates
Visor is one of the best product roadmapping tool for Jira users due to our two-way integration with Jira.
Even if you don’t need a roadmap that syncs with Jira, Visor still makes it easy to create roadmaps for different audiences. Whether you use our sharing functionality and templates for onboarding new customers to share roadmaps with external audiences or our spreadsheet views and our Mutual Action Plan template, it’s easy to configure Visor to our specific needs.