4 Risk Assessment Matrix Templates with Examples


Start using Visor today
- Visualize all your projects and data

- Roll up multiple projects into portfolio views
- Try Visor for FREE
In project planning, risk management is a key factor in how successful your project will be. This is where risk matrix templates come into play.
A risk matrix is a visual tool that helps you prioritize risks based on their likelihood and potential impact.
In this blog post, we’ll explore the ins and outs of using a risk matrix template, including:
- What a risk assessment matrix is
- Why you should use them
- How to write a risk assessment matrix
- Risk assessment matrix templates you can download
- Managing risk with Visor
Want to effortlessly keep an eye on risk? Visor can help by giving you a bird’s eye view of all the projects in your portfolio, while allowing you to share beautiful, modern views with stakeholders. Try it for free today and make sure your risk is always managed.
What is a risk assessment matrix?
A risk matrix is a tool that helps you visualize and prioritize risks based on their likelihood and potential impact. By plotting risks on a simple grid, you can quickly see which threats require immediate attention and which ones can be monitored over time.
When you think about risk, what you’re really considering is uncertainty. So when you create one of these matrices for a project in your portfolio, you’re trying to create certainty enough that you can move forward with your project with confidence.
“Risk is the lack of certainty about the outcome of making a particular choice.” – Wikipedia
These matrices show up a lot in project management, safety management, and other fields that demand risk assessment and mitigation planning. For instance, you can use it for:
- Project management: A risk matrix lets you analyze the risks associated with timelines, budget, resources, and scope to ensure project success. It’s also a good way to prioritize high-risk areas on a project that may need extra attention.
- Health and management: You can use it here to identify and mitigate potential hazards to workers as well as make sure your organization stays in compliance with regulations by identifying risks.
- Information technology: In terms of cybersecurity, a risk matrix can help assess risks related to data breaches, hacking, and system failures. It can also be used to identify potential risks in deploying new software or hardware systems.
- Financial management: When you’re investing, you can use the matrix to assess financial risks or look out for operational risks, like fraud, compliance breaches, or operational failures.
Those are just a portion of the ways these matrices can be used. They can be customized to fit a wide variety of use cases, so if you don’t see your particular industry above, that doesn’t mean the info below can’t still apply to you.
What else can help me avoid risk in a project?
Risk matrices are just one facet of a robust risk management system. Anything that enables you to have high-level oversight of your project portfolio is a great addition to
Another good method might be dashboards, which consolidate the most important information to you for each project into one easy to navigate place.
A dashboard in Visor
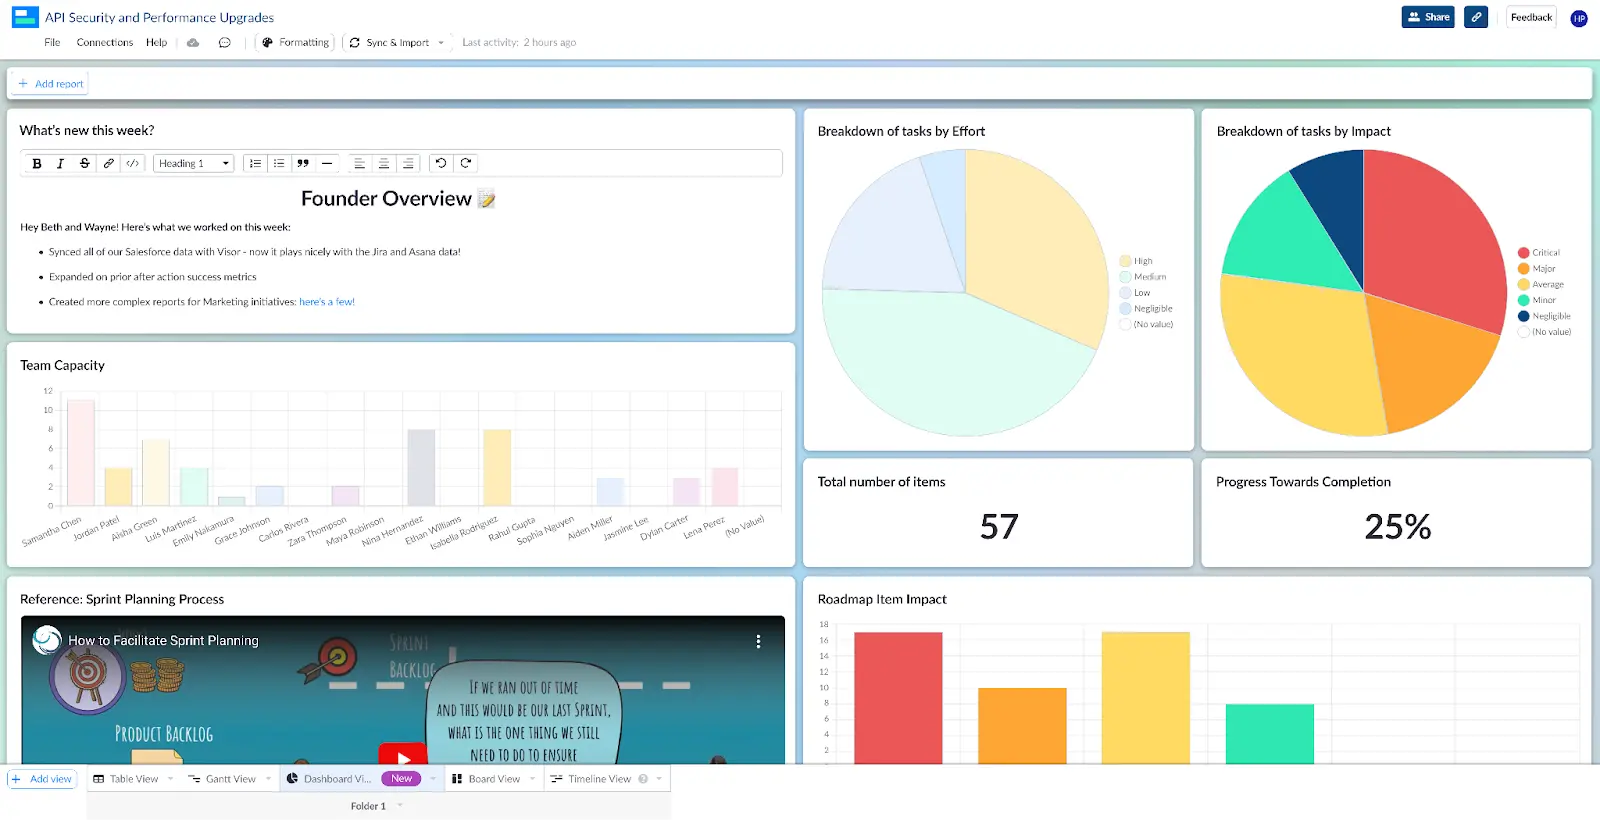
Look for ones that offer high levels of customization and detail, so that you can get as pulled-out or as zoomed-in of a view as you need while offering at-a-glance clarity.
Here’s a video with more information on creating dashboards like these.
Why should I use a risk assessment matrix?
There are multiple reasons the risk assessment matrix is so popular across multiple industries:
- You can create clear visualization of risk: A risk assessment matrix takes complex risk data and puts it into an easy-to-understand visual format.
- It makes it easier to prioritize: The matrix helps focus attention and resources on the most significant risks.
- It allows you to communicate risk clearly: You can foster discussions among stakeholders about the most critical risks, using the matrix as a jumping off point.
- You have an additional tool for decision making: In other words, it provides a structure for making risk management decisions.
How do I write a risk assessment matrix?
When you create a risk assessment matrix, you’re basically comparing two things: the likelihood something will happen and the impact that risk might have. By cross referencing them, you can determine how much energy you should put into mitigating that risk.
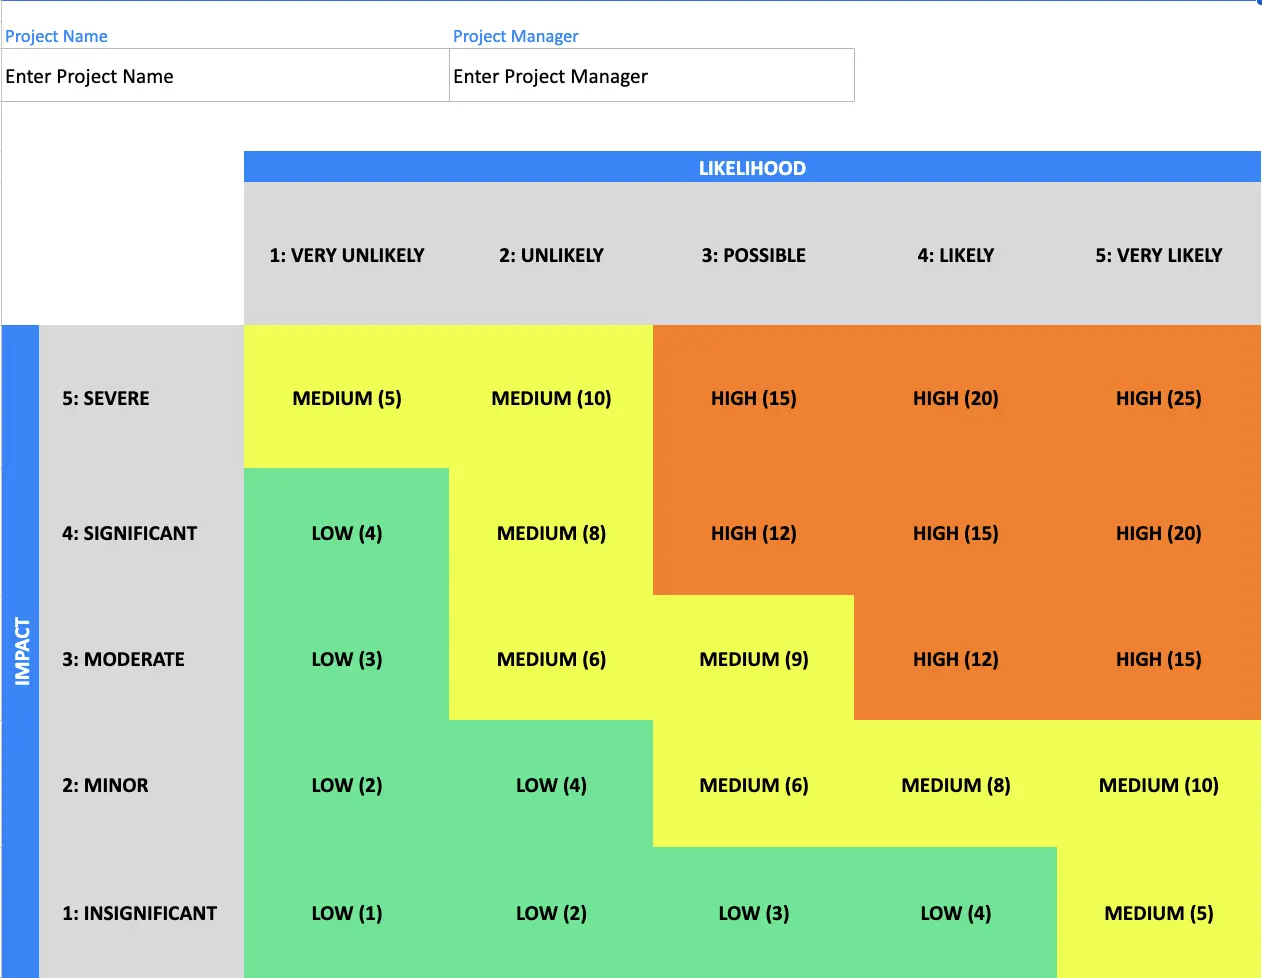
You can create a risk matrix of different sizes, but one of the most common is a 5×5 risk matrix, so let’s start there.
First you lay out the likelihood something will happen, with a list like the one below. Each likelihood has a point value, which we’ll explain in a little bit:
- 5- Very Likely: This risk is almost certain to happen
- 4- Likely: There is a good likelihood this will occur
- 3- Possible: There is a moderate possibility this risk could occur
- 2- Unlikely: This probably won’t happen
- 1- Very Unlikely: This is extremely unlikely to happen.
Next, let’s tackle the impact. This is how serious a problem you’d have if this risk actually happened.
- 5- Severe: This risk could have a catastrophic impact and be extremely difficult to recover from
- 4- Significant: This risk could create major problems and take a long time to recover from
- 3- Moderate: It may take some time to recover.
- 2- Minor: There will be little impact here and recovery will be quick.
- 1- Insignificant: This risk will have minimal impact (if any) and shouldn’t affect normal operations.
To determine the overall risk, you multiply the likelihood of a risk by its impact. For example, a Severe risk that’s considered Possible would be 5×3 for a risk score of 15. An Insignificant risk that’s Likely would be 1×4 for an overall risk score of 4. You can determine what you consider a high or low risk based on your organization’s preferences, but we’ve broken down our 5×5 matrix as follows:
- 12-25- High Risk: These risks are likely and can have a massive, even disastrous, impact on projects. Therefore these are the elements that must be prioritized in project planning.
- 5-11- Medium Risk: If you can mitigate these risks during project planning, you can limit the effect they have. However, they’re not top priority if you’re putting out fires from the High Risk category.
- 1-4- Low Risk: You can address these risks if you have additional time and want to streamline processes. However, these risks are unlikely to impact project planning and can be safely deprioritized.
Managing Risk with Visor
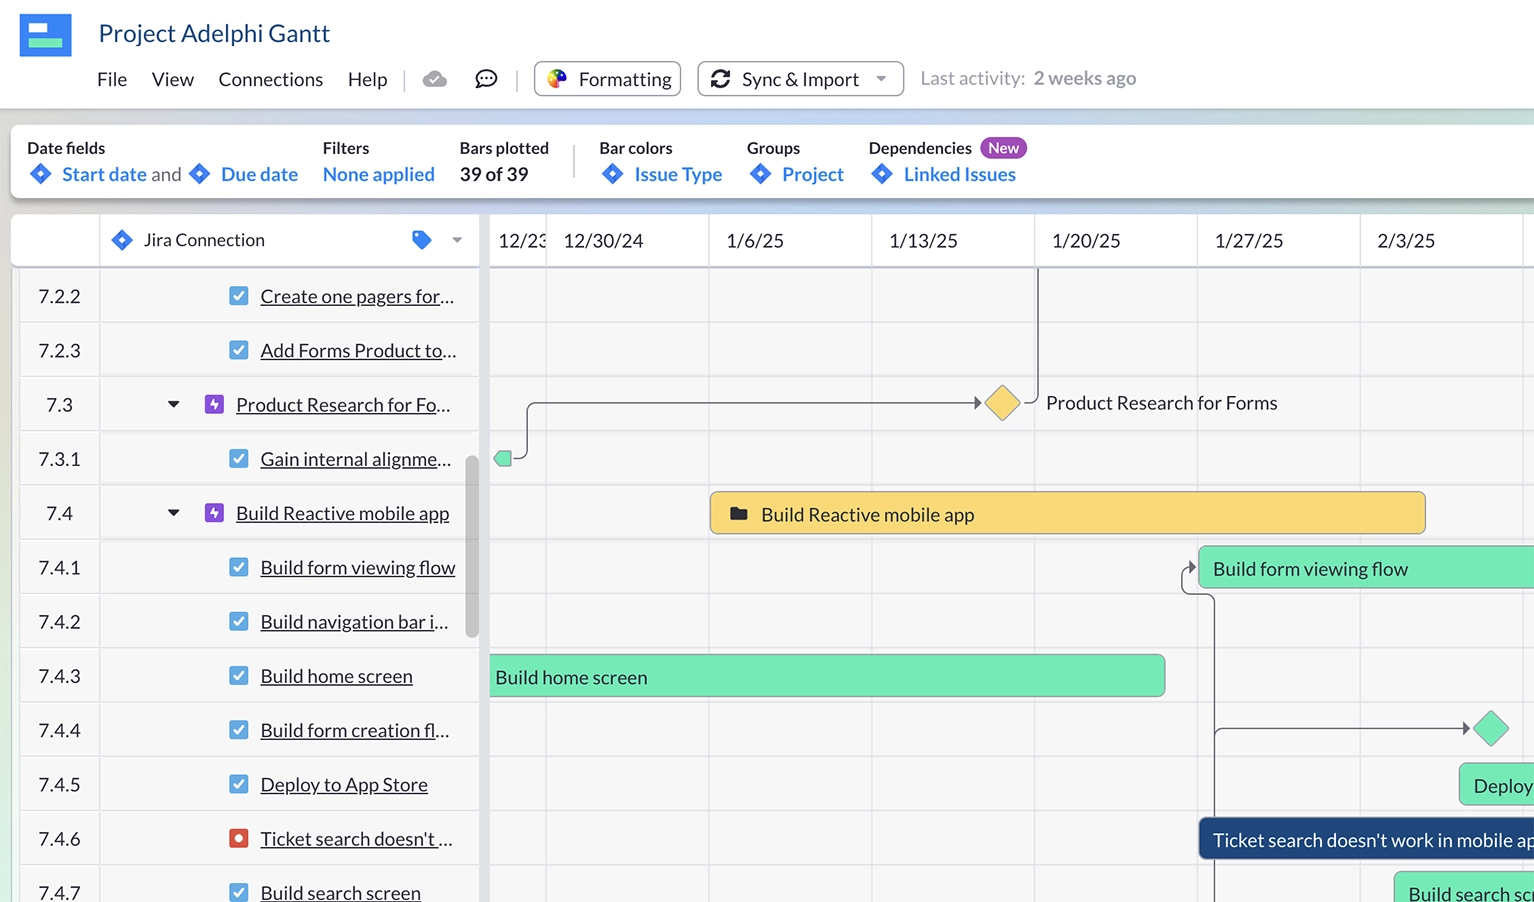
One of the easiest ways to judge whether a project is at risk is by checking out a visual project plan, like a Gantt chart. Visor lets you make your project plan crystal clear for all stakeholders, no matter what tools they’re using.
A Gantt chart in Visor
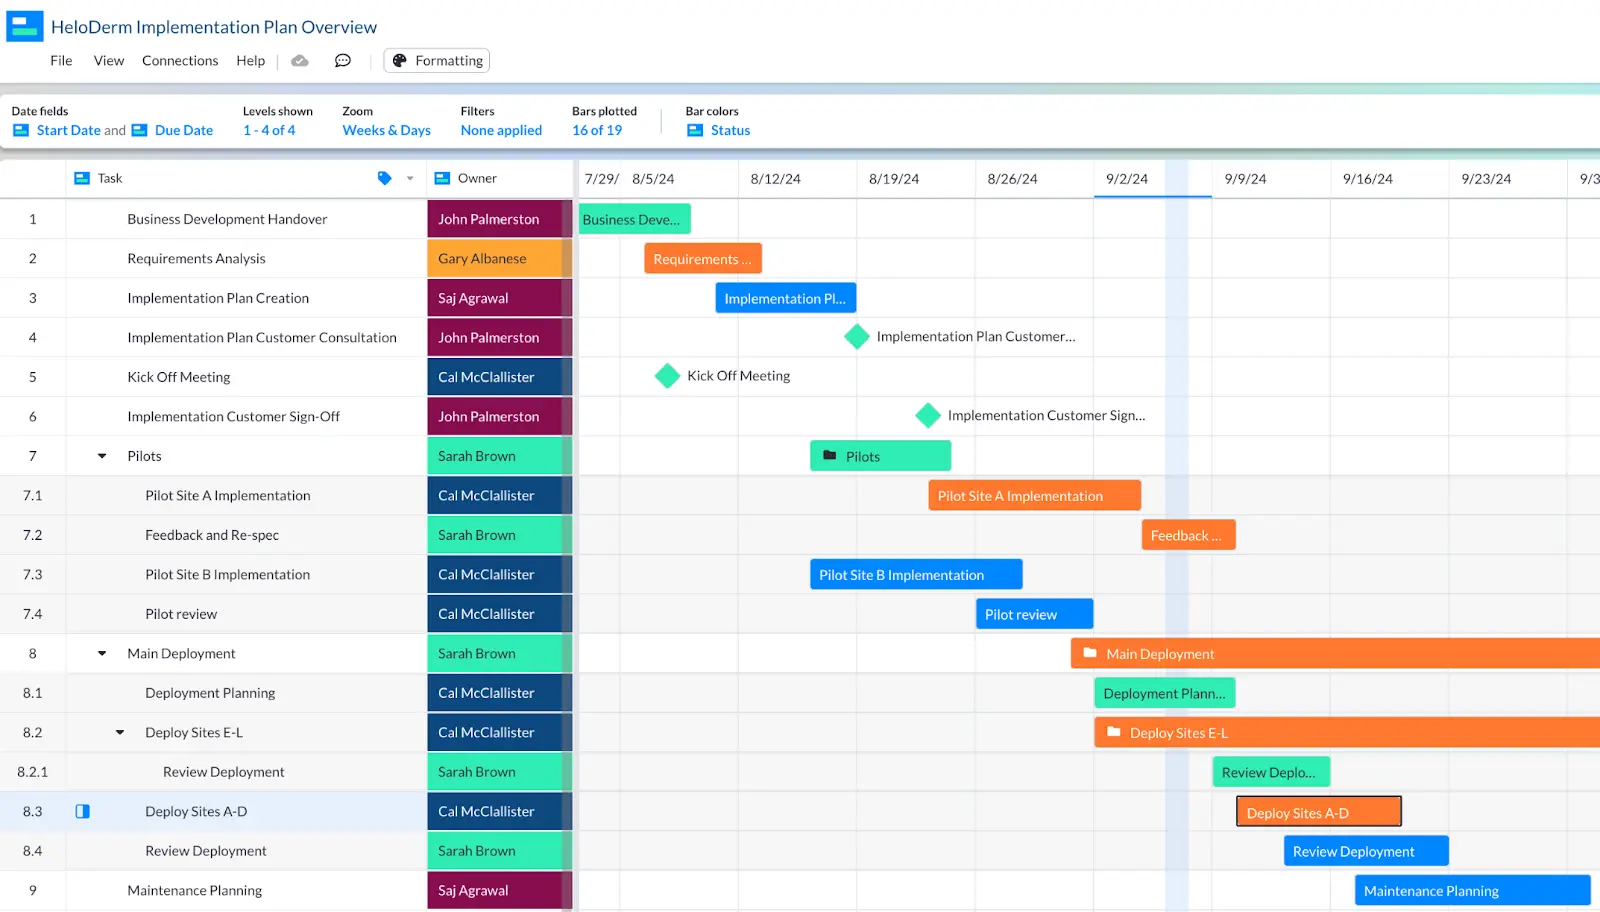
Visualizations let you quickly see whether or not tasks are on target – for example, you can check to see if you’re meeting project milestones on time. Then, you can enter the risks as issues in either Visor or Jira and have the issue tracked in your Visor data.
Unlike a traditional spreadsheet, Visor is always up to date, letting you adjust and adapt to changes in your project plans. You can use it to create Gantt charts that incorporate multiple projects, and other portfolio-wide visualizations to track risk at the level of portfolio or group, rather than at the level of each individual project.
Create Gantt charts, Kanban boards, dashboards, and tables that are connected to your Jira project management data, then share it with stakeholders on and off your team – no difficult-to-maintain systems required.
You can represent your Jira issues as milestones, and create views that just show the critical tasks from your project management apps, for example your Asana milestones, to cut through the noise and focus on what’s most important.
Watch this video to learn a little more about how Visor can help you manage every project in your portfolio.
4 Downloadable Risk Assessment Matrix Templates (and When to Use Them)
We’ve put together a series of risk matrix templates, along with a couple of general risk assessment templates for listing and analyzing individual risks. They’re designed to be adapted to your particular organizational needs, so feel free to adjust them as needed.
5×5 Risk Matrix Template
The 5×5 risk management template gives you room to dig into the degree of risk a situation presents, allowing you to score risk on a scale of 1-25. It’s a larger array than the 3×3 matrix, so you can add some nuance to your risk scores.
The template can be adjusted based on your organization’s needs. For instance, you could scale back the risks labeled as High Risk or label some of the Low Risks as Medium and so one.
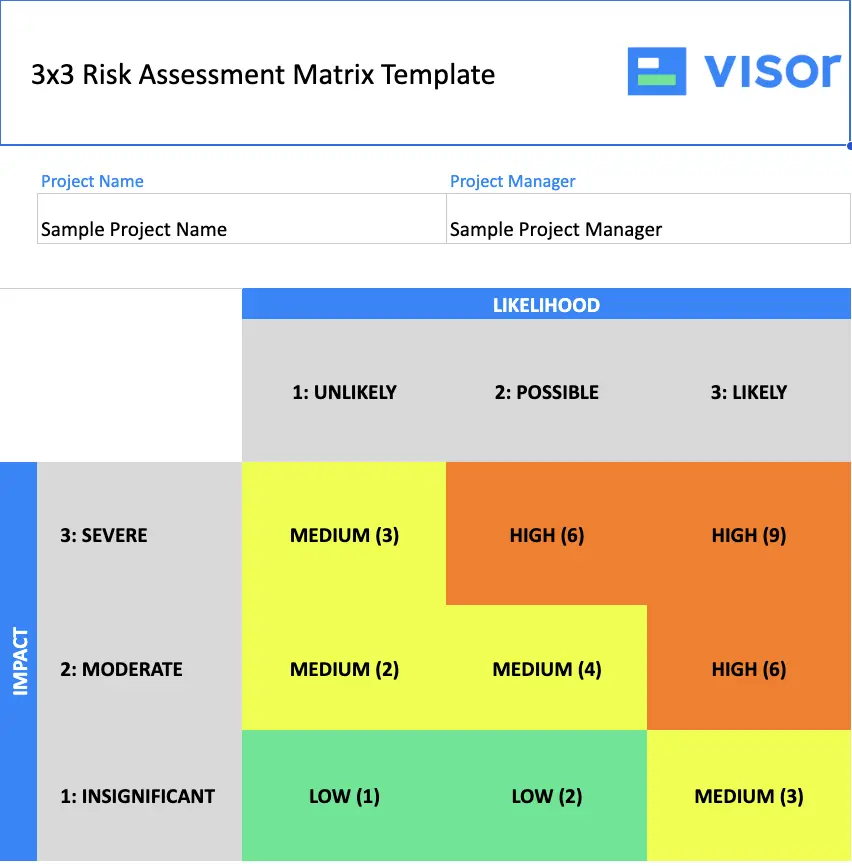
3×3 Risk Matrix Template
If you need a simplified risk management template, this 3×3 model may be the right choice for you. It works the same as the 5×5 model, though risk scores only run from 1-9. However, with a smaller grid, it may be easier to assess risk (if you don’t need granular detail). This can also be used with the Risk Management Assessment Template to review potential risks.
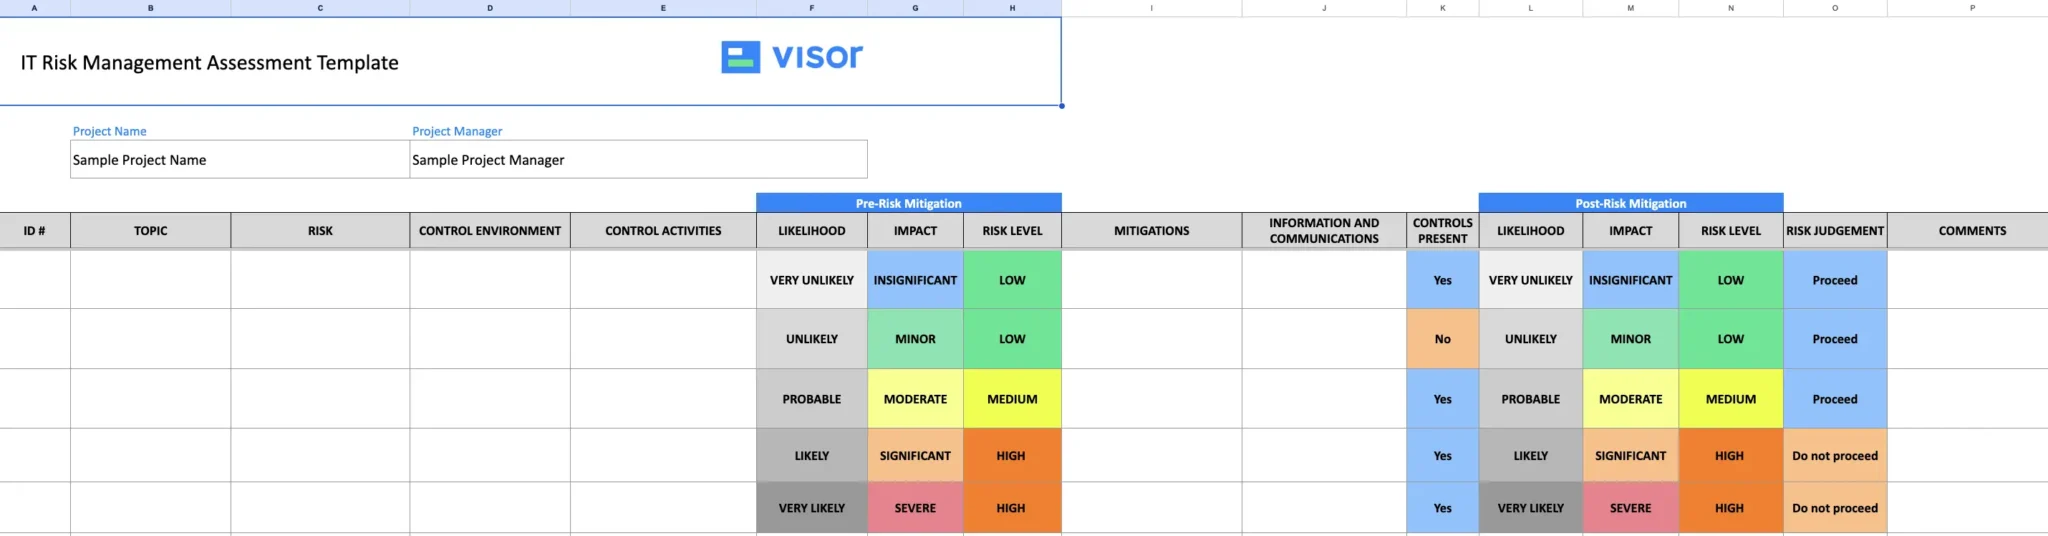
IT Risk Assessment Template
If you’re assessing risk for an IT project, the template below is designed for you. In addition to an attached risk matrix, you can also list out your risks, discuss how you’re handling them in control settings, review mitigation strategies, and review the effect those mitigation strategies have on the outcome.
This could be a good chart to include in project status reports or other reports that need to be shared with stakeholders.
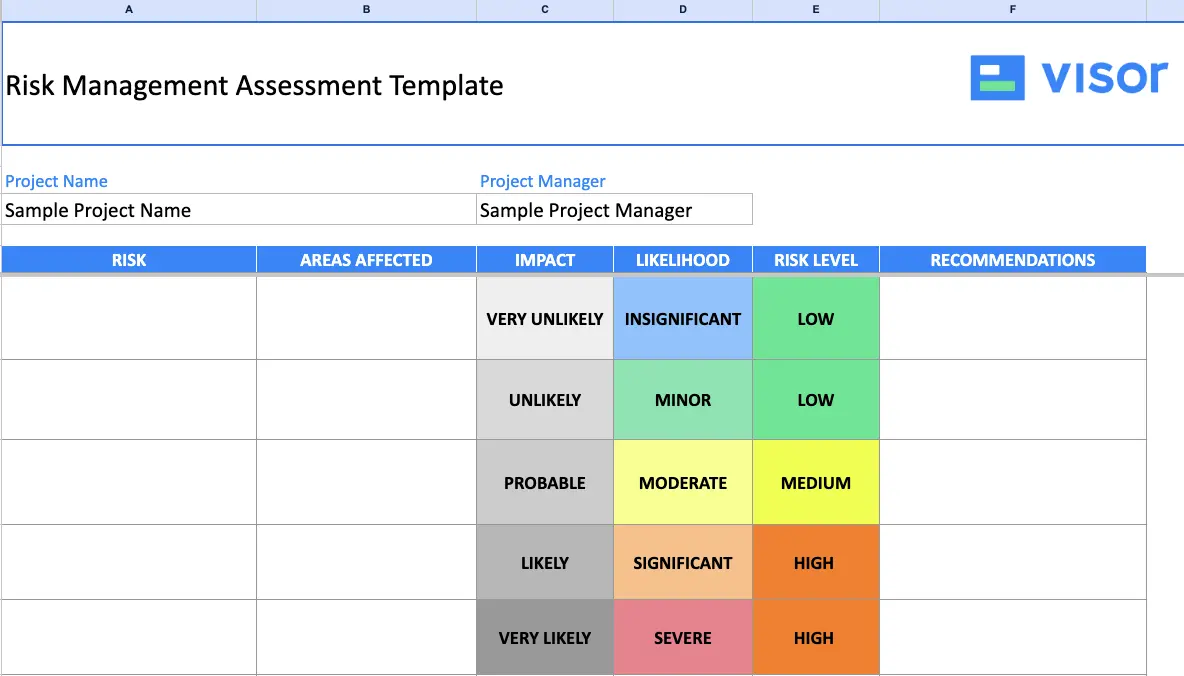
Risk Management Assessment Template
If you want a simple way to review potential risks, check out the risk assessment list below. It gives you a straightforward way to detail the risks for your project, the areas that will be affected, and your recommendation. The risk matrix is attached, so you can review and adjust it as needed.
Use this chart when reviewing risks with stakeholders to offer a solid overview of potential pitfalls for your project and how you plan to address them.
Empower your Risk Management
Effectively managing risk is essential for the success and resilience of any project or organization. Risk matrix templates offer a straightforward yet powerful way to identify, assess, and prioritize risks, enabling you to take proactive measures to mitigate potential threats.
But if you want to avoid the fuss of a spreadsheet template, try Visor. By managing your project portfolio in Visor, you’ll have the high-level insight you need to track risks in real time, and share relevant and beautiful charts and dashboards with your teams.
Visor also offers a lot of templates that help project managers beyond risk assessment matrixes. You can explore our templates, such as our project milestone template and templates for agile release plans.
You can even create custom views designed for different groups of stakeholders, so that everyone has exactly the info they need to analyze and mitigate risks. It’s free to get started, no credit card needed.