Kanban Board vs Gantt Chart: Pros and Cons
Kanbans and Gantts. Two of the most popular ways to visualize, plan, manage, and monitor your projects.
If you’re new to project management, you may be running into a lot of unique terms for the first time. Two of the biggest of these are “Kanban boards” and “Gantt charts.” What are these, what do they have to do with project management, and when do you need to use each one?
If you’re a project management veteran, you may be eyeing up that next project and are not quite sure what would be best to use, a Gantt chart vs. a Kanban board.
We have this helpful guide to get you started if you’re new – or help you improve your knowledge if you need to brush up on best practices.
We’re project management experts. Visor is a powerful tool that helps you get all of your data in one cohesive, eye-catching place… even when your people are using different tools. Try us out, free, and build Kanban boards and Gantt charts that will wow.
What is a Kanban Board?
A Kanban board is a simple, highly visual structure of information that sorts tasks into different categories, usually based on stage of work.
If you’ve ever made yourself a list that said “To Do / Doing / Done” congratulations: you’ve used a Kanban board!
A Kanban board consists of columns which represent different stages or statuses (e.g. Not Started, In Progress, Complete), and “cards” which represent tasks or sets of work that are moved across these columns as their progress status changes.
More advanced Kanban boards include “swimlanes” which are horizontal rows to further categorize cards baed on criteria such as:
- Who the task (or card) is assigned to
- The priority or importance of the task
- The type of task
- Any other criteria which is important to your project and team
You can see examples of Kanban boards, some with swimlanes, some without below:
Examples of Kanban Boards
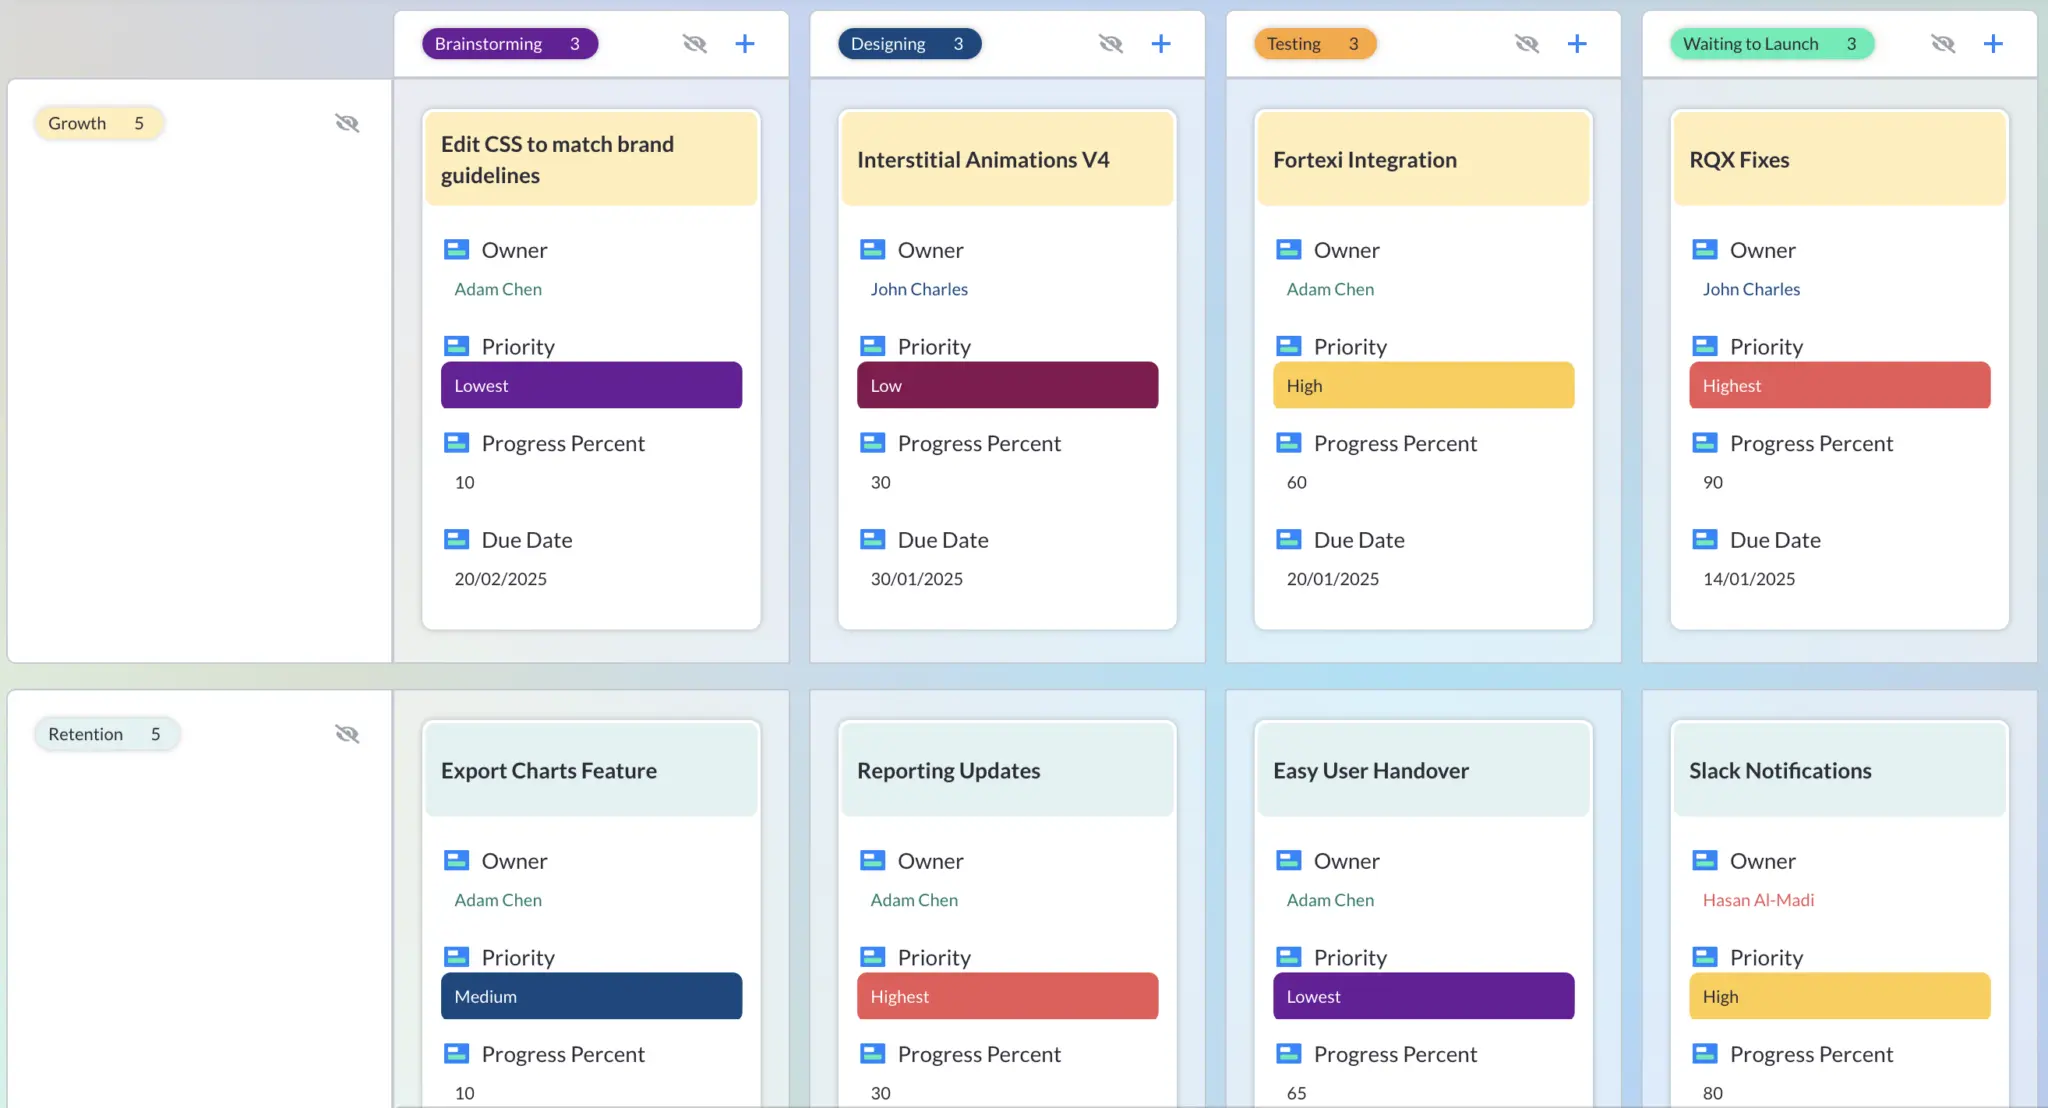
Kanban board view in Visor, with swimlanes for strategic initiative the task supports (Growth, Retention etc.):
A Scrum Kanban board with less information displayed on the Kanban cards:
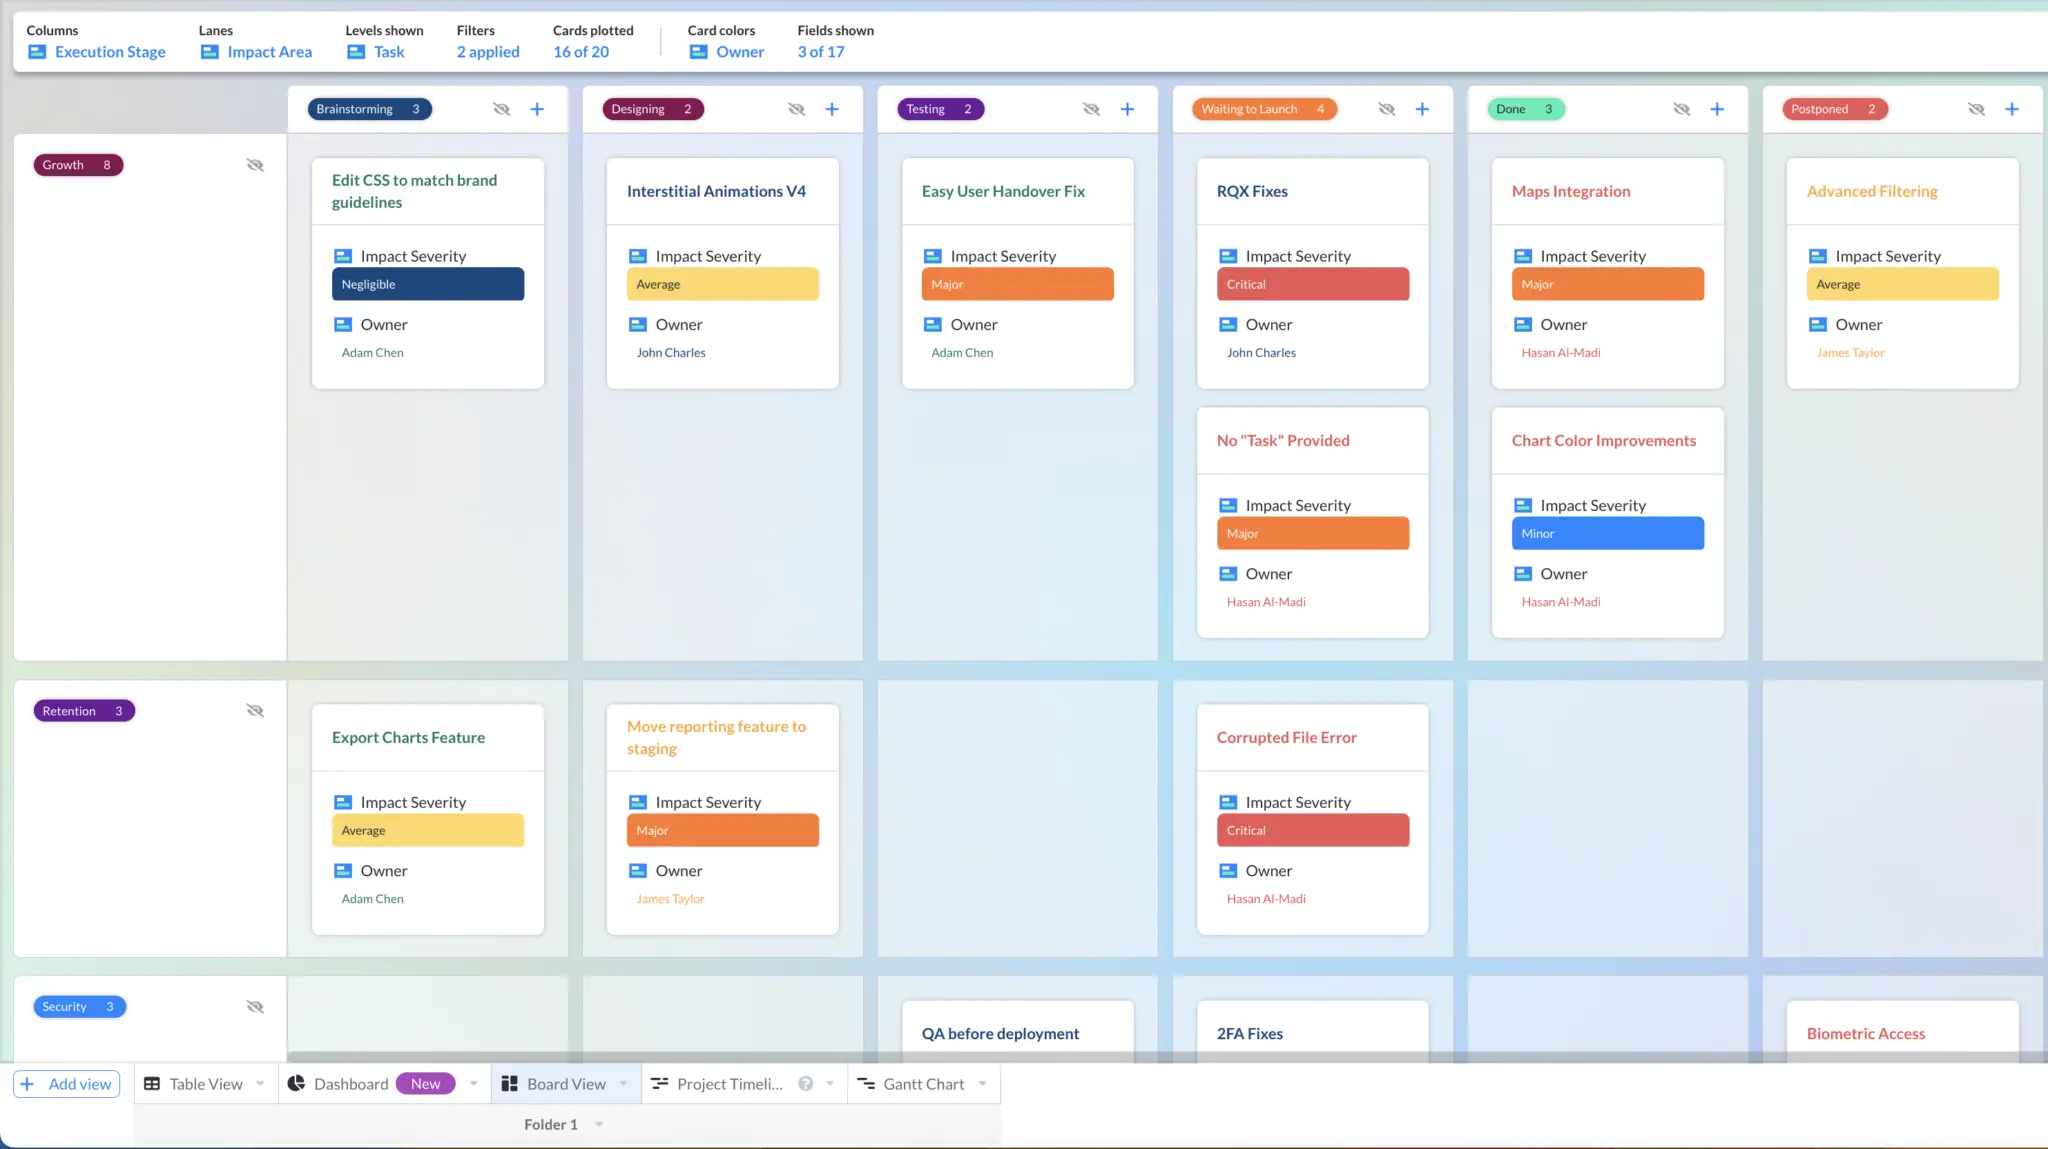
Kanban is a deceptively powerful tool that can be used in a wide variety of ways depending on how you choose to structure yours.
For instance, you might add additional statuses to denote when a project in blocked, or add an archive section for tasks that were completed some time ago, to keep them from cluttering your organizational pattern. You might even choose to hide columns with statuses like “archive” to keep everything visually tidy.
But our examples of what a good kanban board can look like definitely don’t stop there. There are so many ways to customize and develop an excellent kanban board in Visor, starting with adding swimlanes to your Kanban board.
A integrated Agile Kanban board in Visor, with swimlanes for assignees:
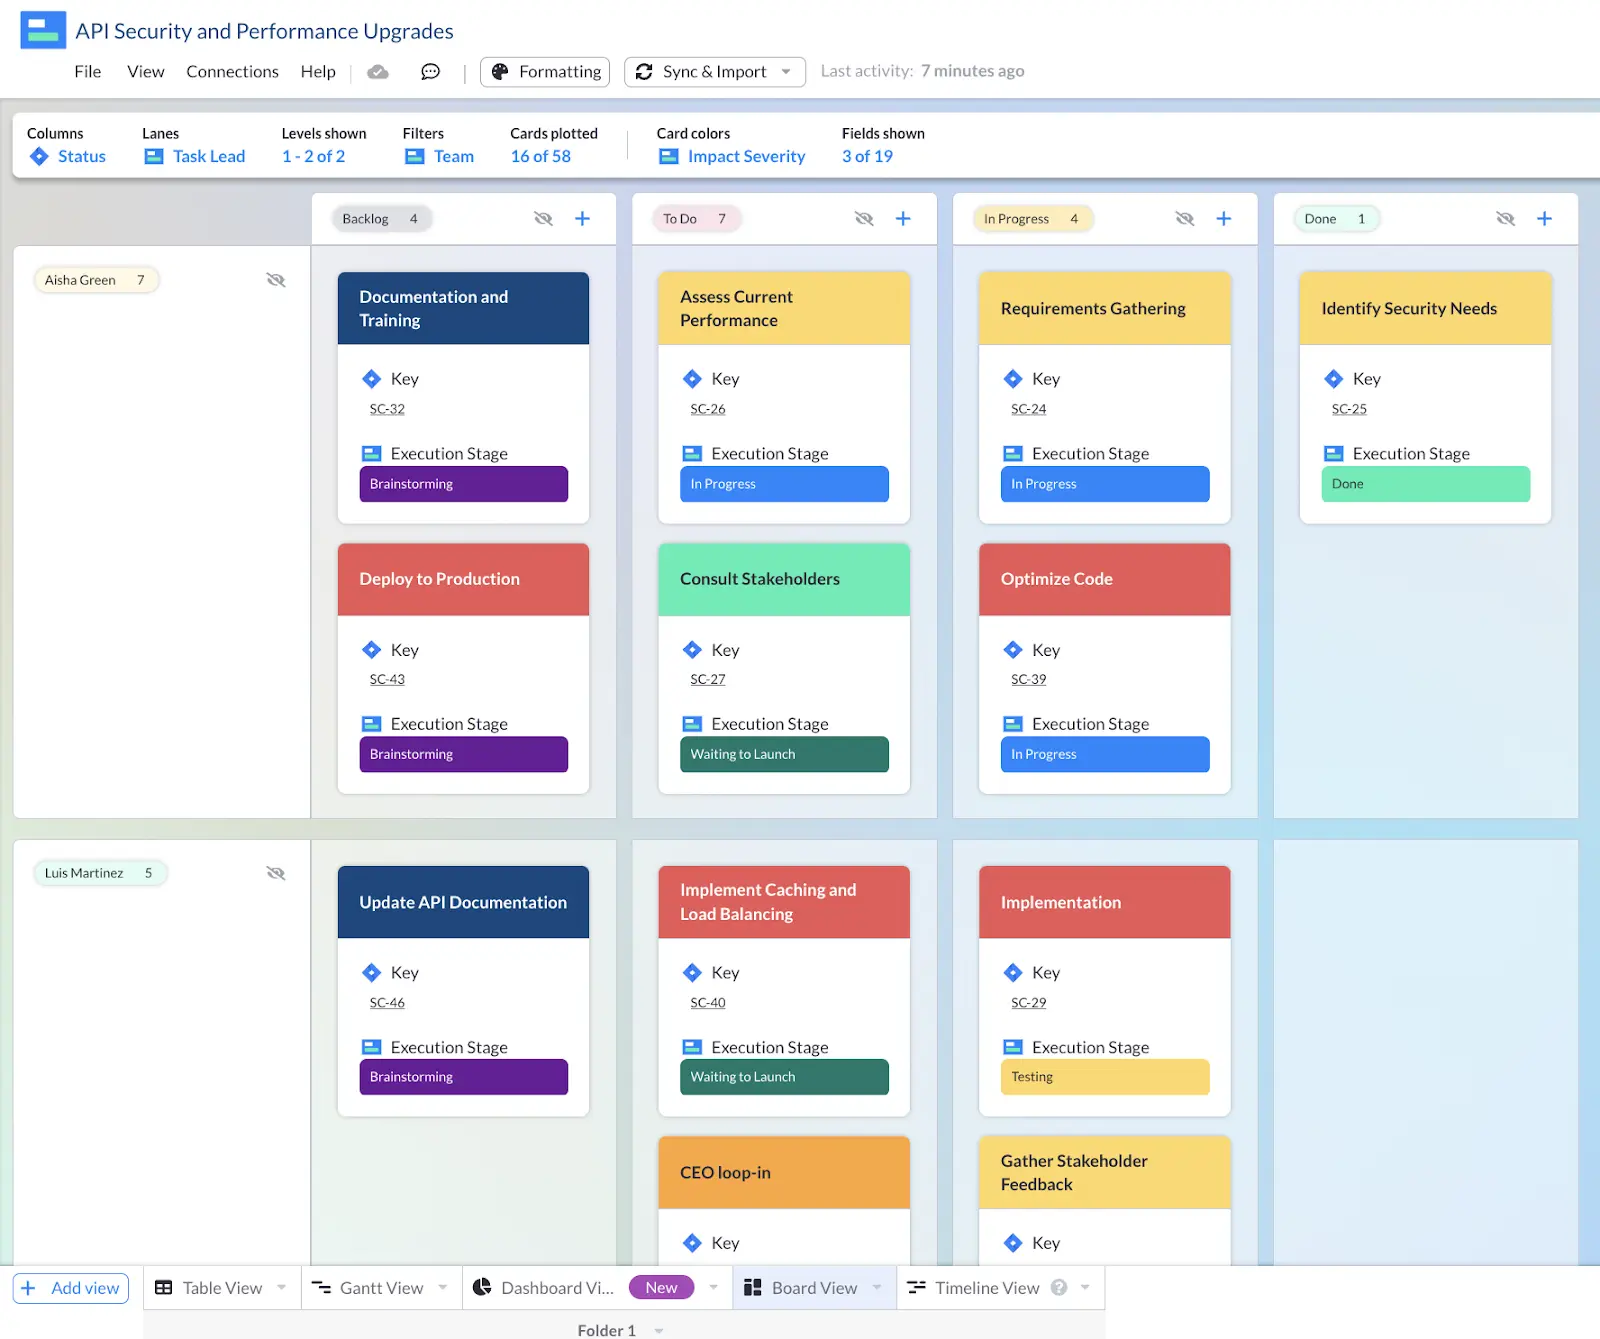
Kanban is a fantastic style of organization that can support both very simple and surprisingly complex workflows.
When do you need a kanban board?
There are many reasons to select Kanban layouts for your project management, but there are some standout applications that make for especially good fits:
- If your team has lots of incoming tasks that need to be prioritized and sorted
- If you have a set workflow process for all tasks that seldom changes
- If you need high-level, at-a-glance information on task stages
Kanban Pros and Cons
Pros
- Highly variable – Kanban can support both very basic and very detailed workflows
- Lots of clarity – Kanban is the ultimate in at-a-glance information
- Total alignment – You’ll never get confused on project progress
Cons
- Limitations on complexity – Kanban boards can’t tell you as many details at a glance
- Never passive – You need to be on top of statuses at all times
- Not a schedule – Statuses aren’t the same thing as a schedule
If you do need more detail than the average Kanban item can show you, consider finding a tool that allows you to show more details on a full Kanban view, like how we’ve done in the screenshot below.
Visor’s Kanban View with more task fields displayed on Kanban cards:
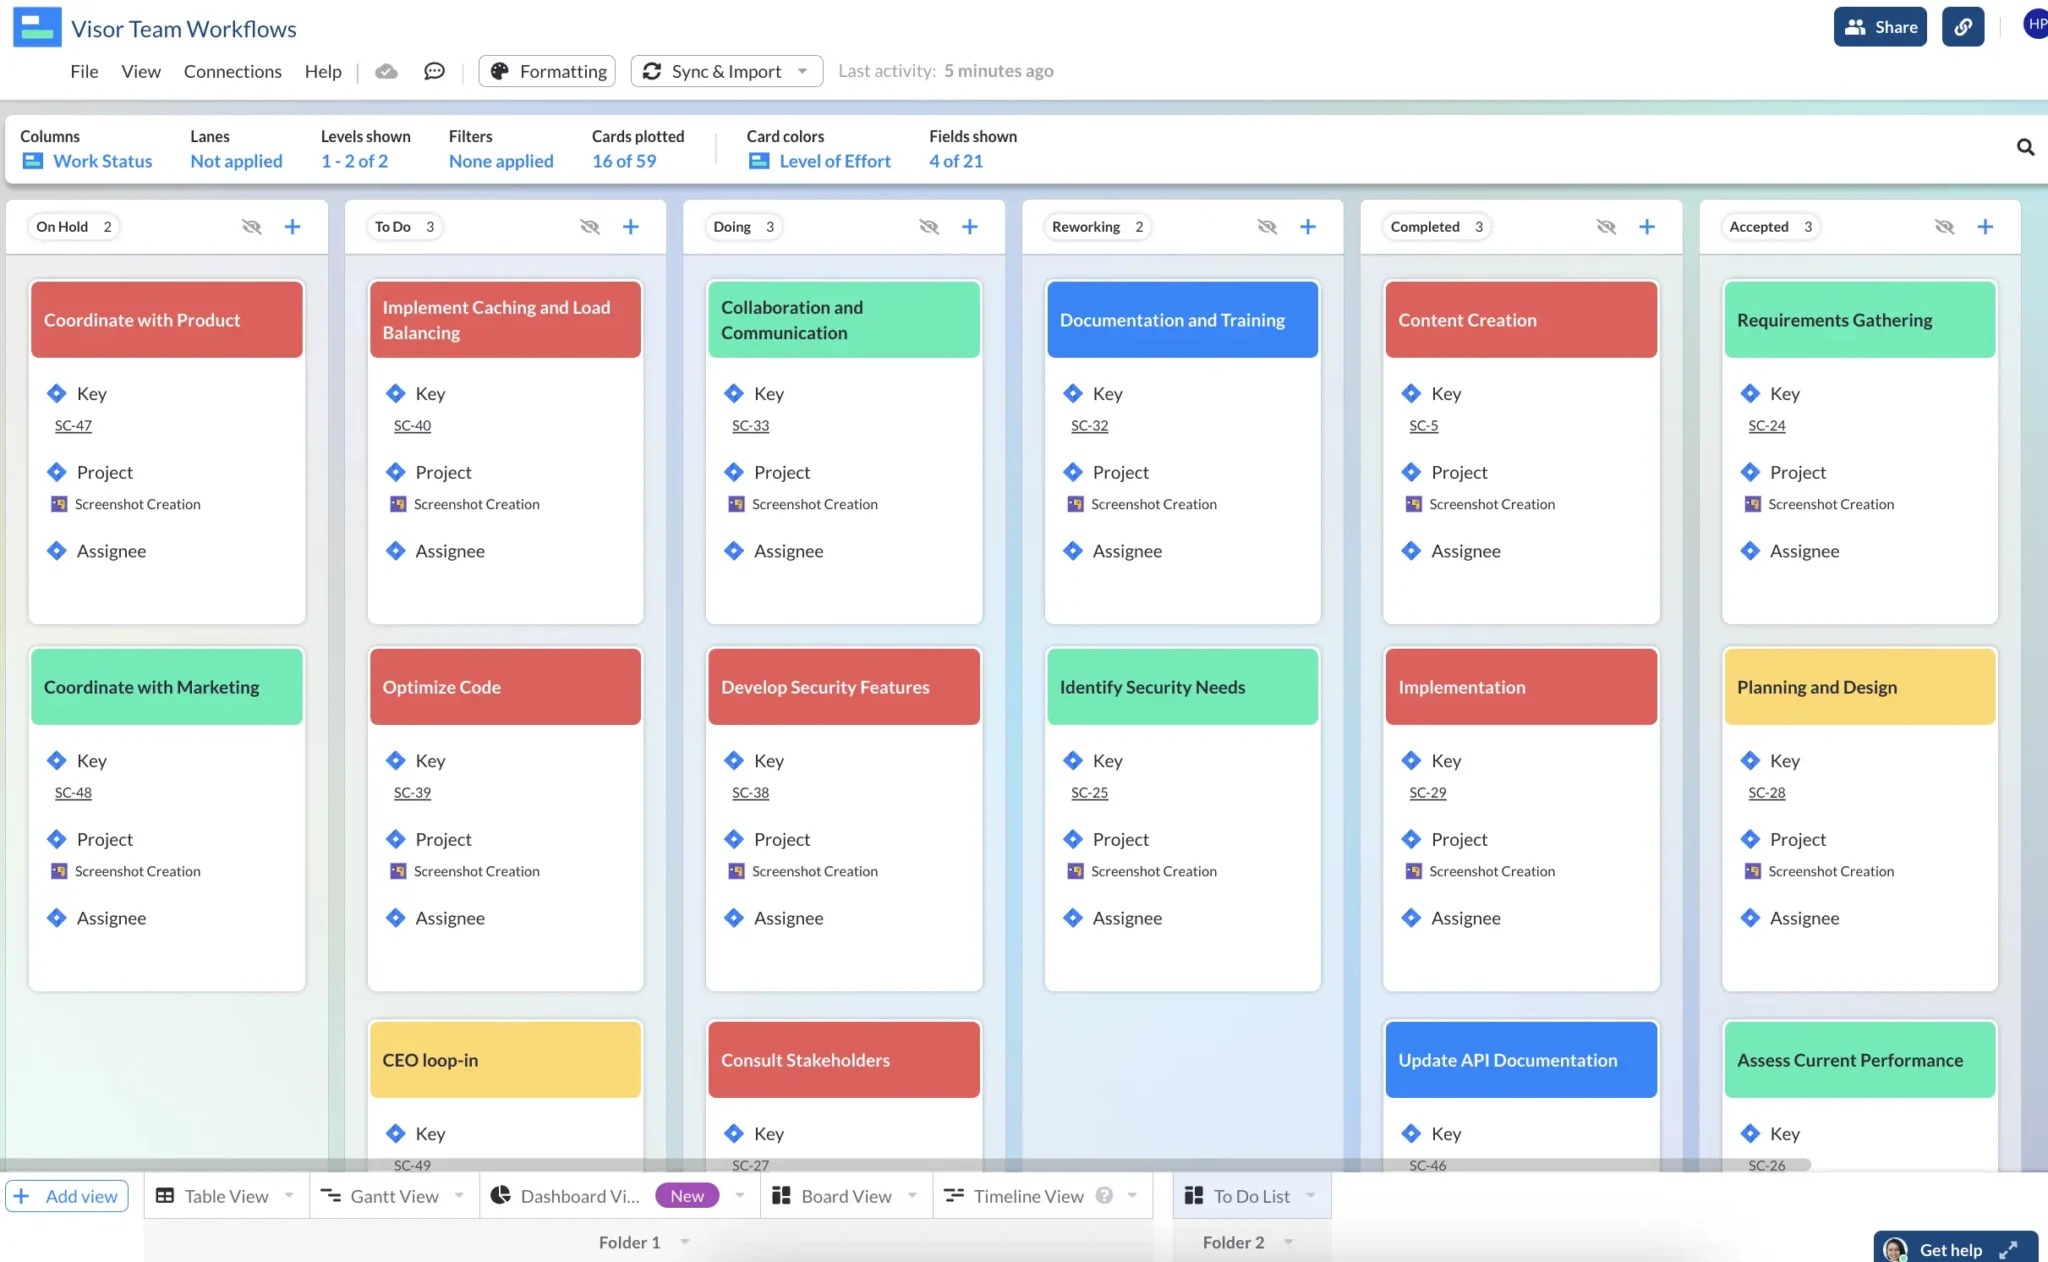
An Asana and Salesforce integrated Kanban board in Visor (for enterprise client onboarding projects:
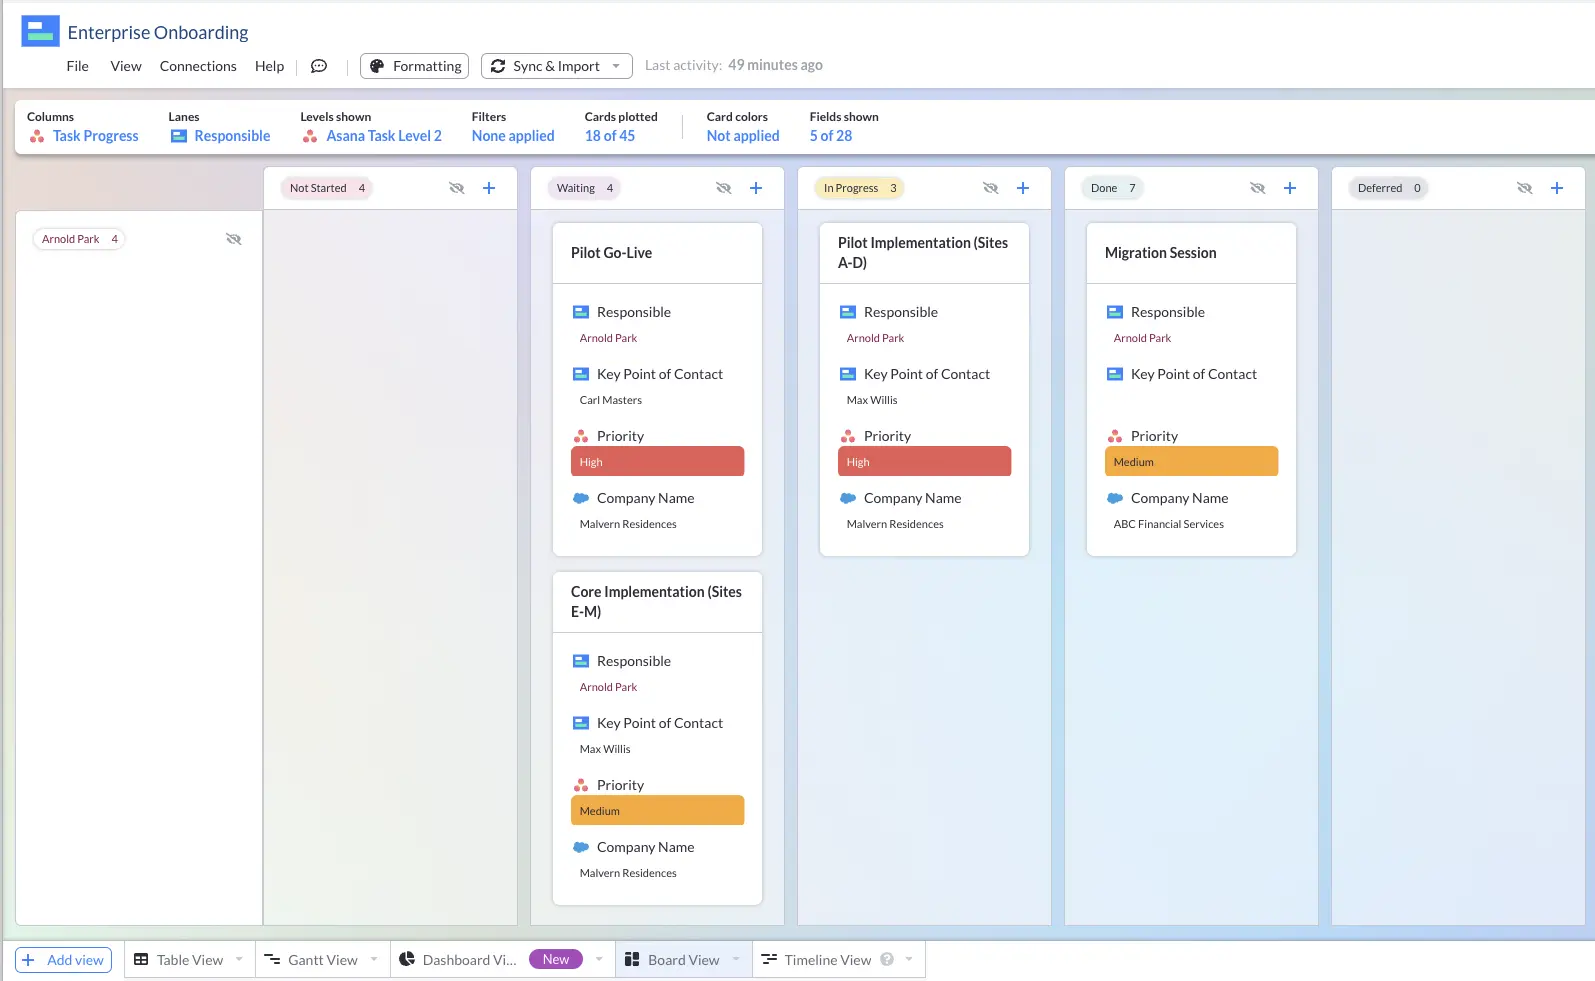
Detailed cards in Visor’s kanban view can give you way more information at a glance, without needing to spend time clicking into every item to know key information. This is super easy to customize for yourself, so you can play around with different options and views to create the perfect system for you and your team.
Card customization options in Visor:

What is a Gantt Chart?
A Gantt chart is a type of chart that organizes projects into tasks and milestones, displayed along with information about when each task begins and ends. The result is a visually compelling, informative overview that communicates the scale or a project, providing information on how long everything will take to complete.
Just like with Kanban, there are a wide variety of ways to organize these charts to provide basic information or lots of detail, and they can become quite complex.
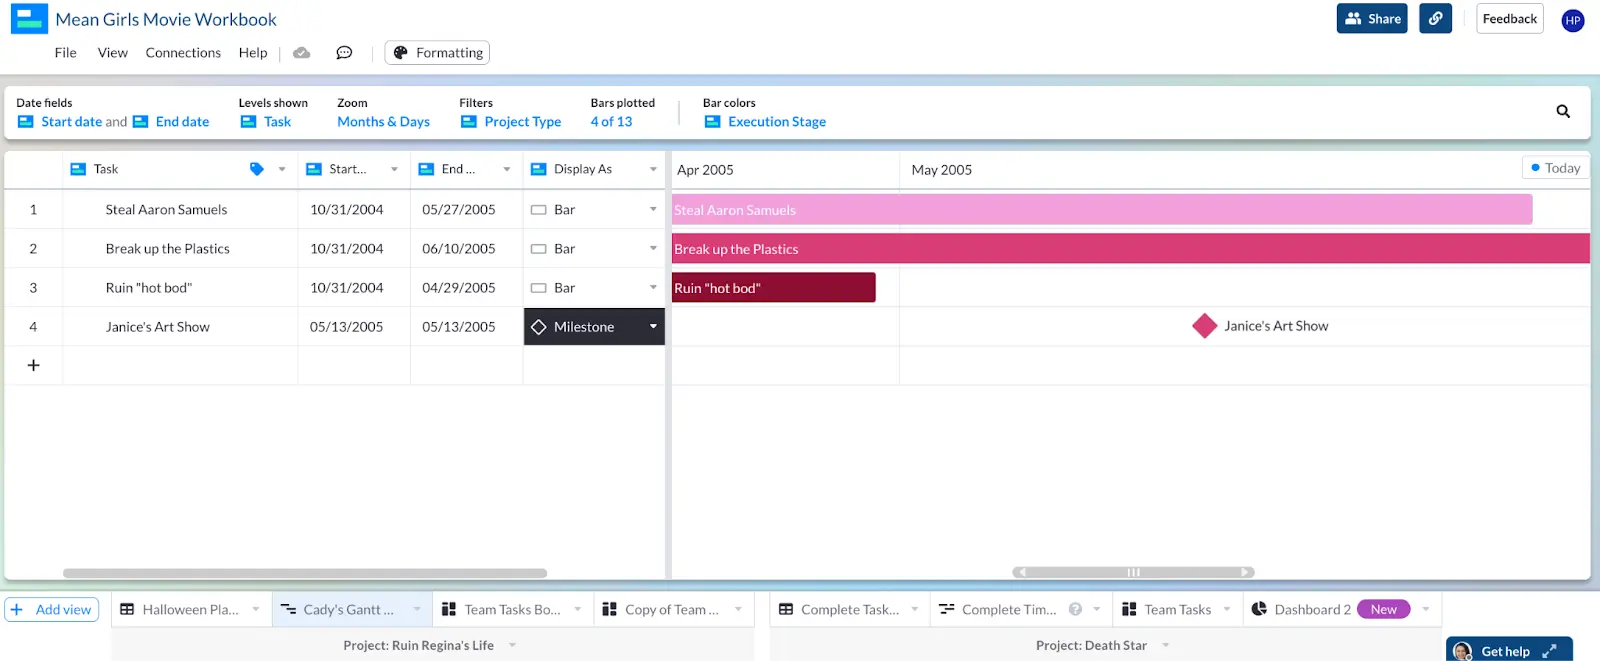
If you were to display the same information we showed with the Kanban board example above into a Gantt chart, it might, at its most basic, look something like this.
Examples of Gantt Charts
Below are examples of Gantts created in Visor.
Visor offers a lot of different project management Gantt chart templates and also allows you to manually configure Gantts if you choose to skip our template options.
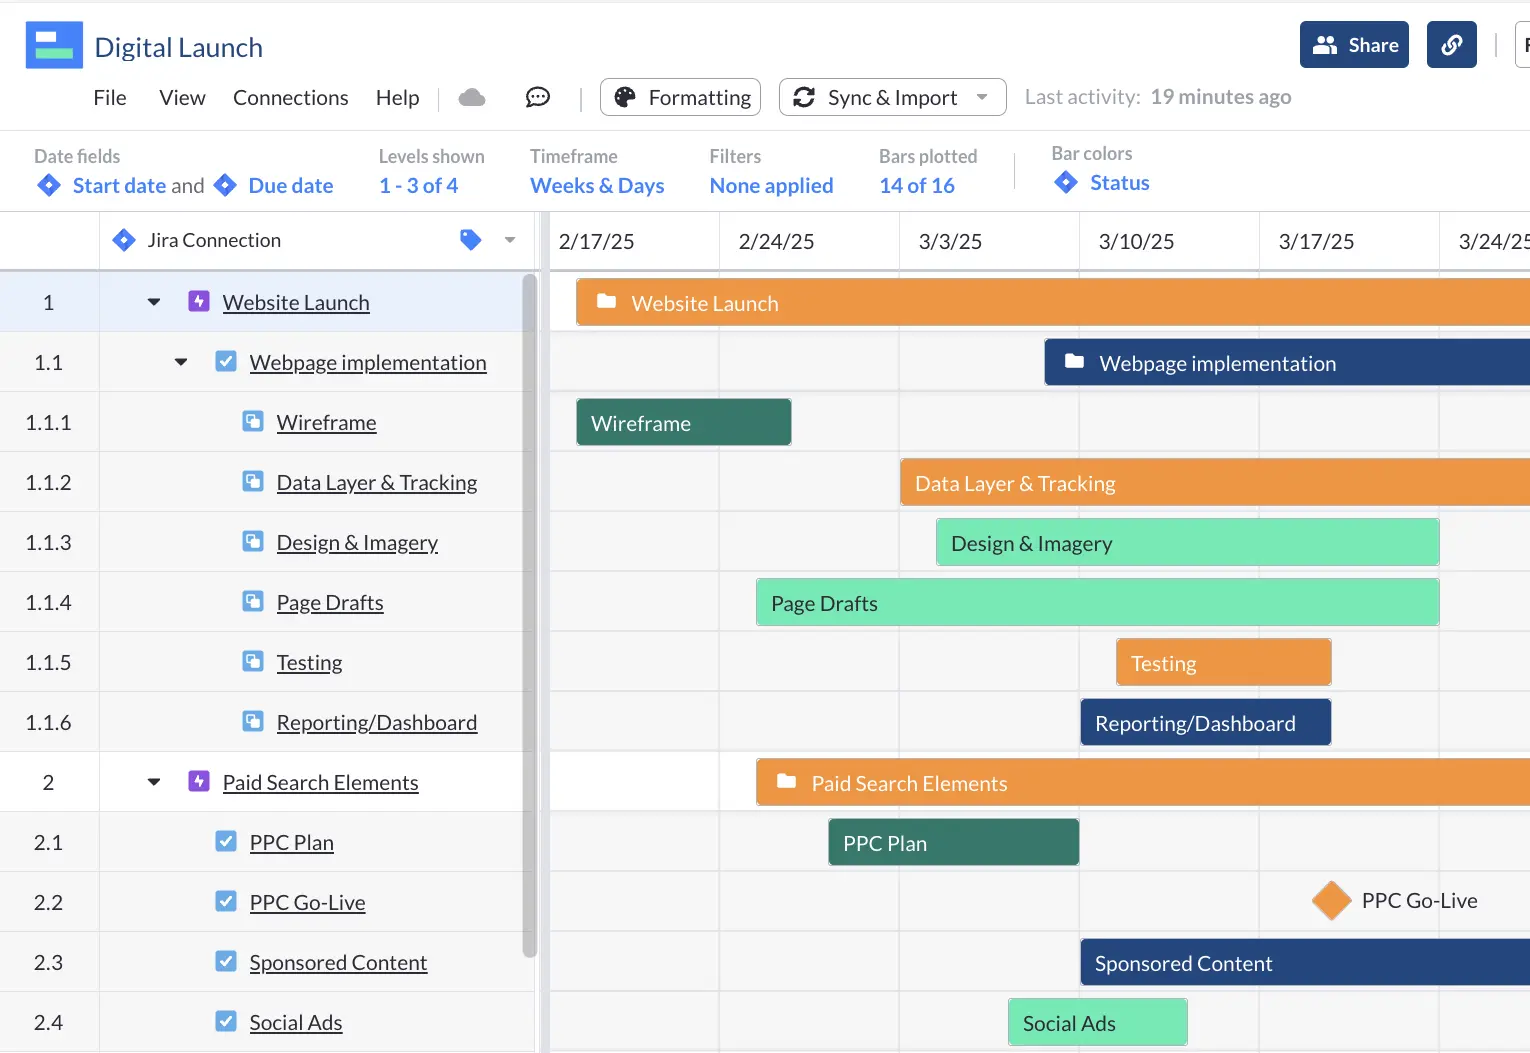
You can also use Visor’s Gantt to create roadmaps. We offer tons of roadmap templates for things like product releases and more.
You’ll notice that, in this example, we also have a milestone: an immovable task or deadline that marks a significant point in the project. Milestones are a crucial part of great Gantt charts, because you’ll often organize work around them.
However, this is a fairly simple set of data to really show the power of a Gantt chart. They shine the brightest when you have very large, complex projects with many inter-connected and overlapping tasks, especially when you have a large team. While Gantts are more of a Waterfall method, showing progress in a linear fashion, even some Agile teams can use Gantt charts.
Visor’s Gantt View with a Complex Project:
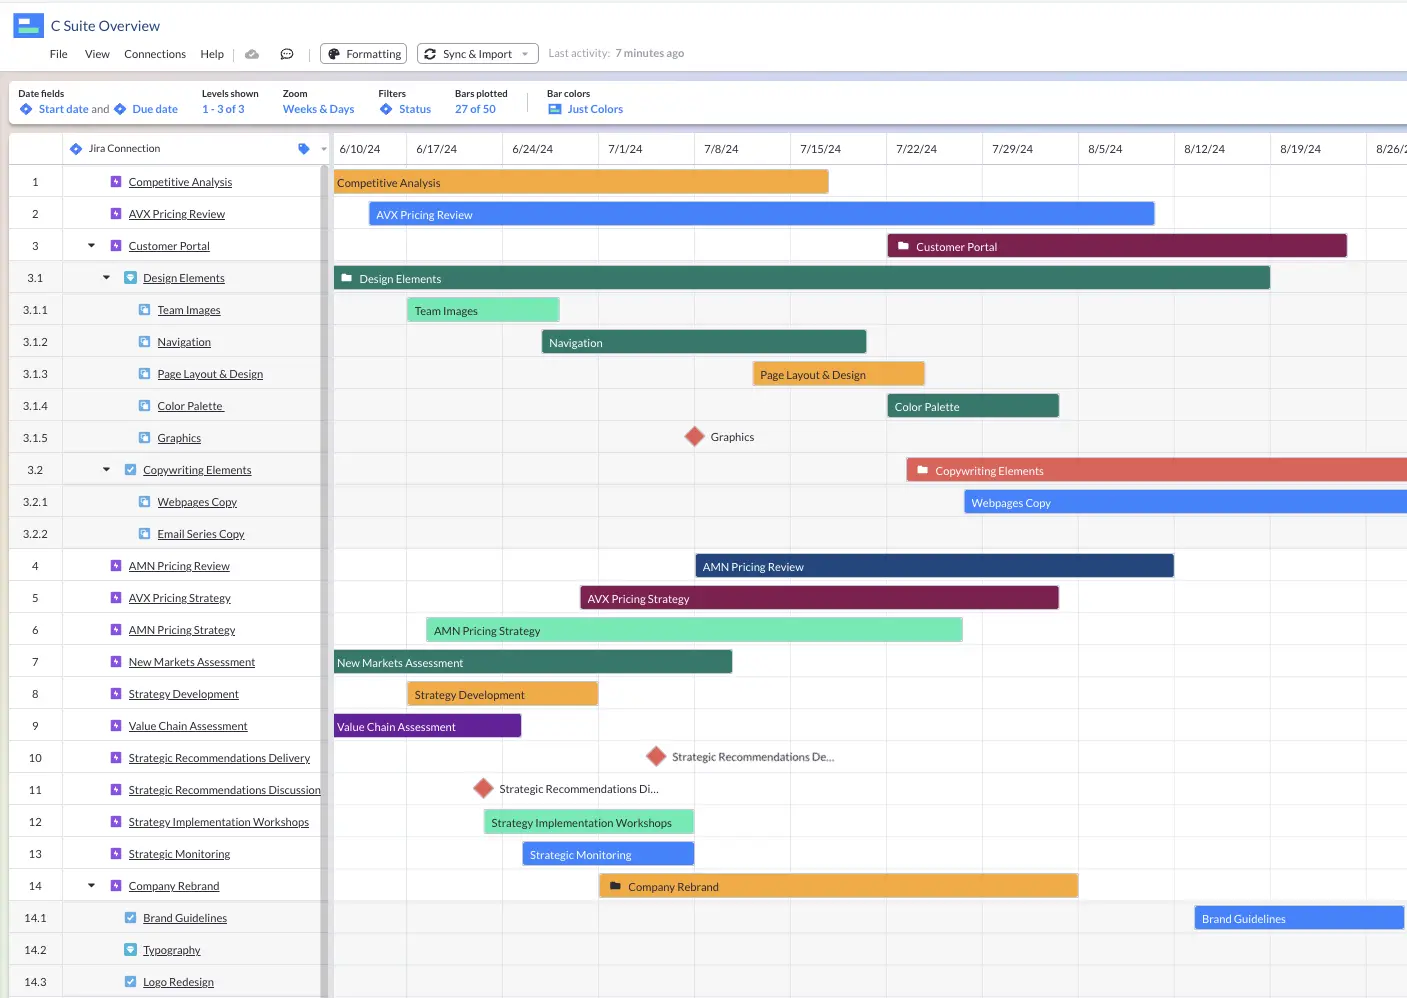
As you can see, a Gantt chart makes much more sense when you have many longer-term, overlapping tasks. Gantt charts also allow you to see clear “handoff” points between tasks – like stealing the Death Star’s blueprints and delivering them to Leia.
Gantt charts can also divide work by things like how mission-critical different items are, so not only can you see what’s happening with a project, you can prioritize work quickly.
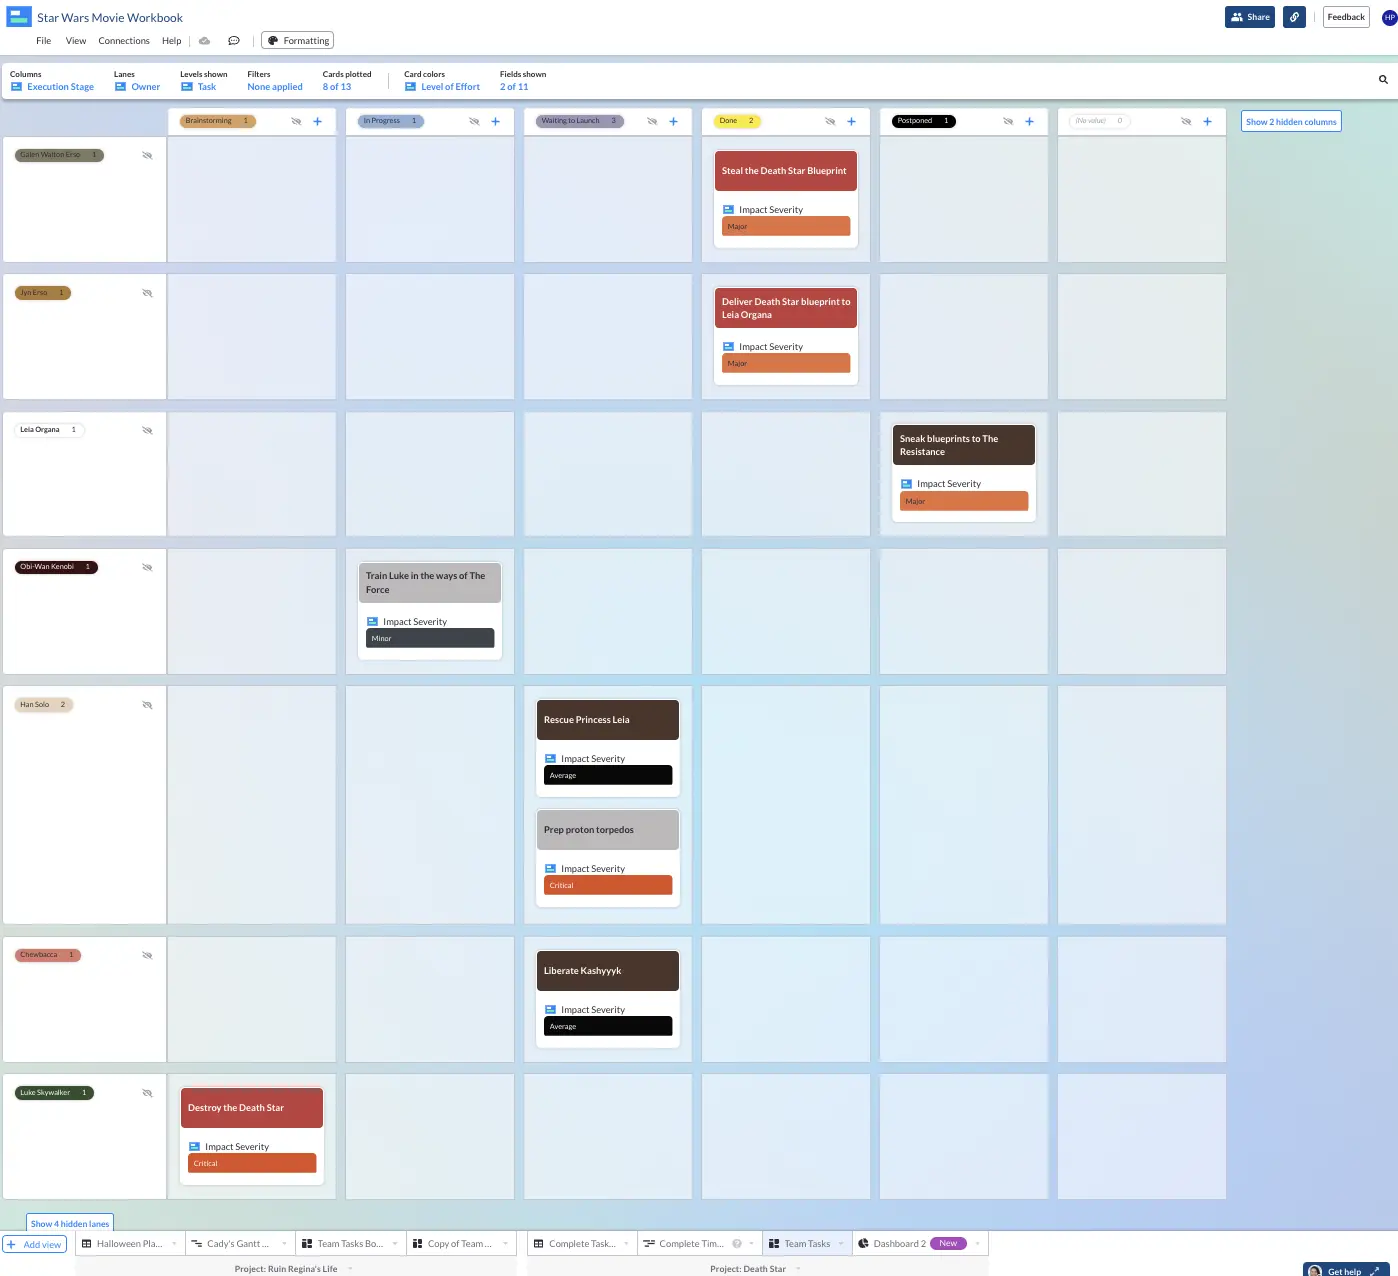
While you could organize that same information into a Kanban board, it’s likely that it will become very chaotic very quickly, even when you divide the work further into granular stages and swimlanes.
Visor’s Kanban View, Complex:
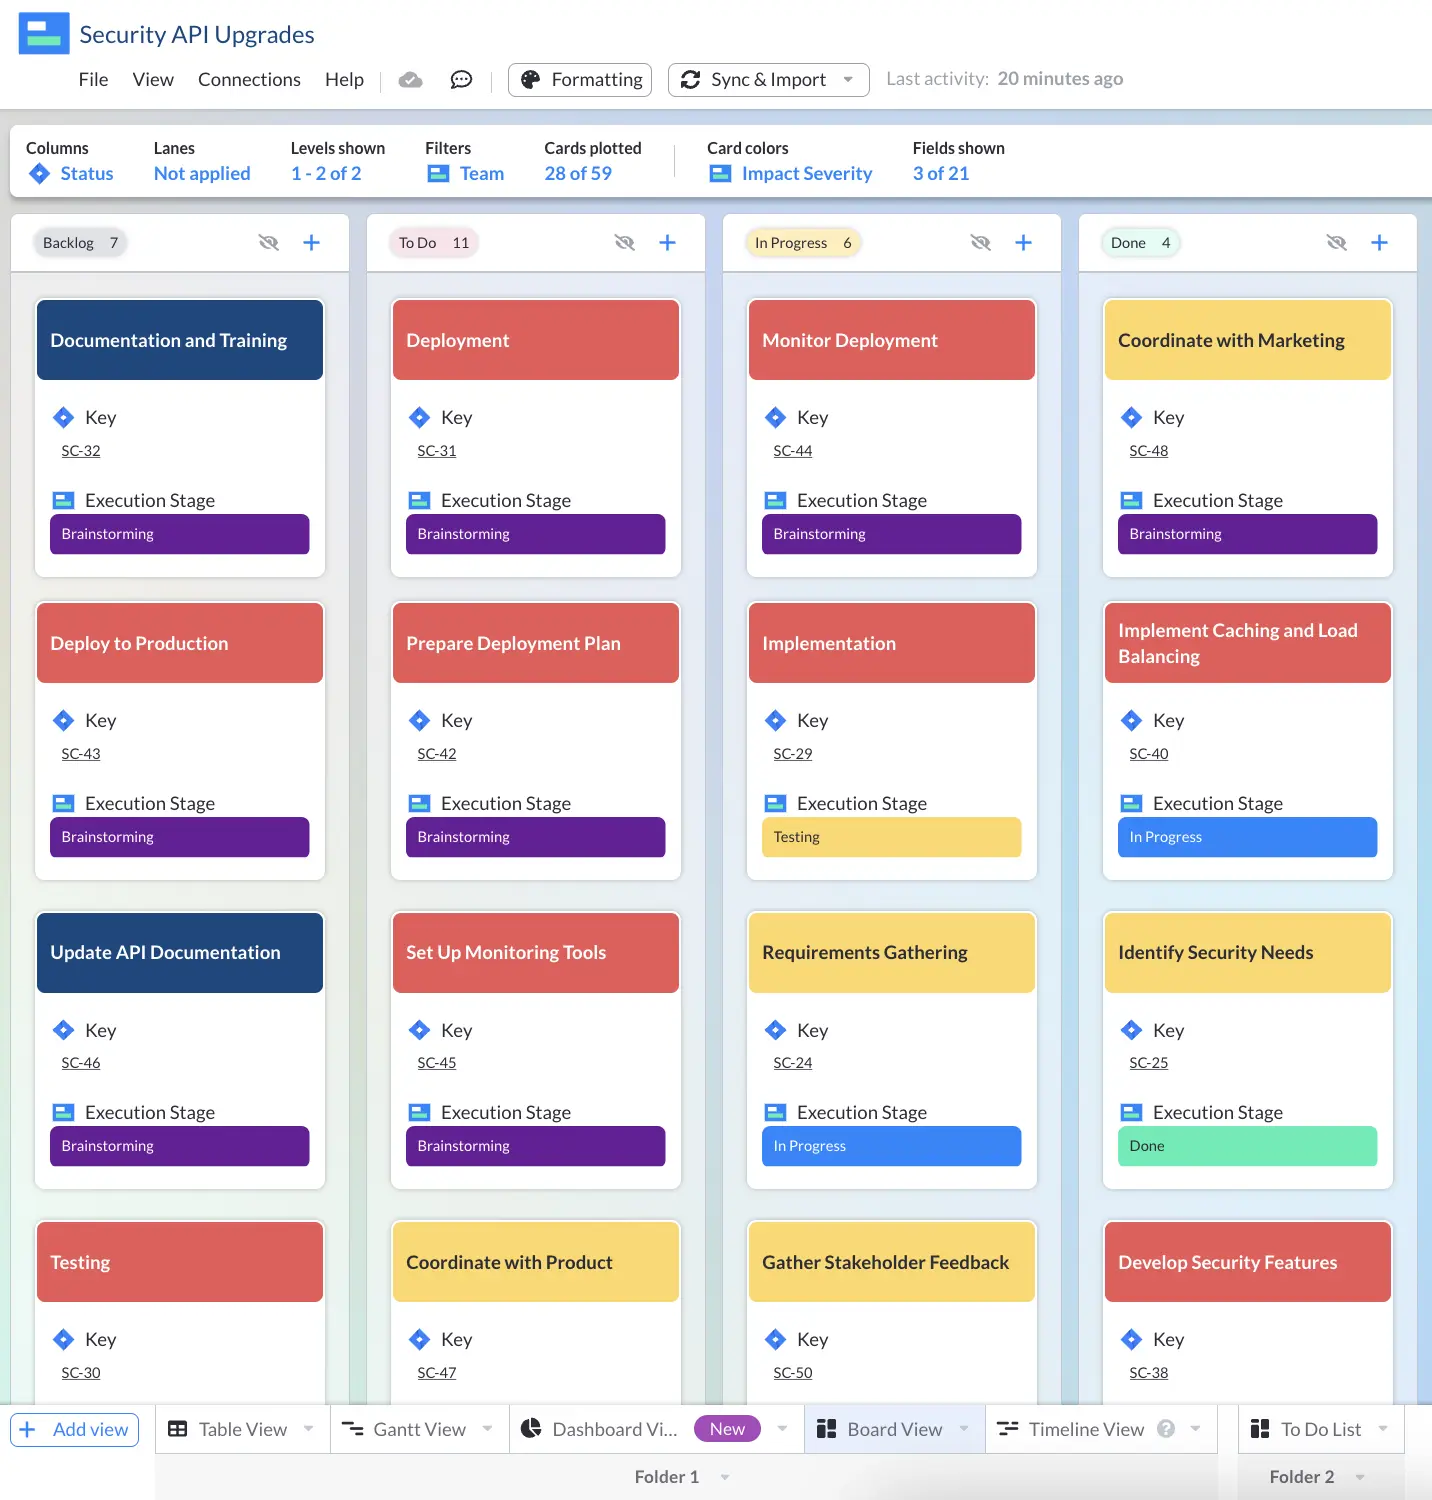
Woof! That’s a big team! A limitation of using kanban is really clear here: you can’t always fit everything you need to know in one clear view. That doesn’t mean that kanban is off the table entirely for large teams. You may just want to experiment with different ways to look at the same information.
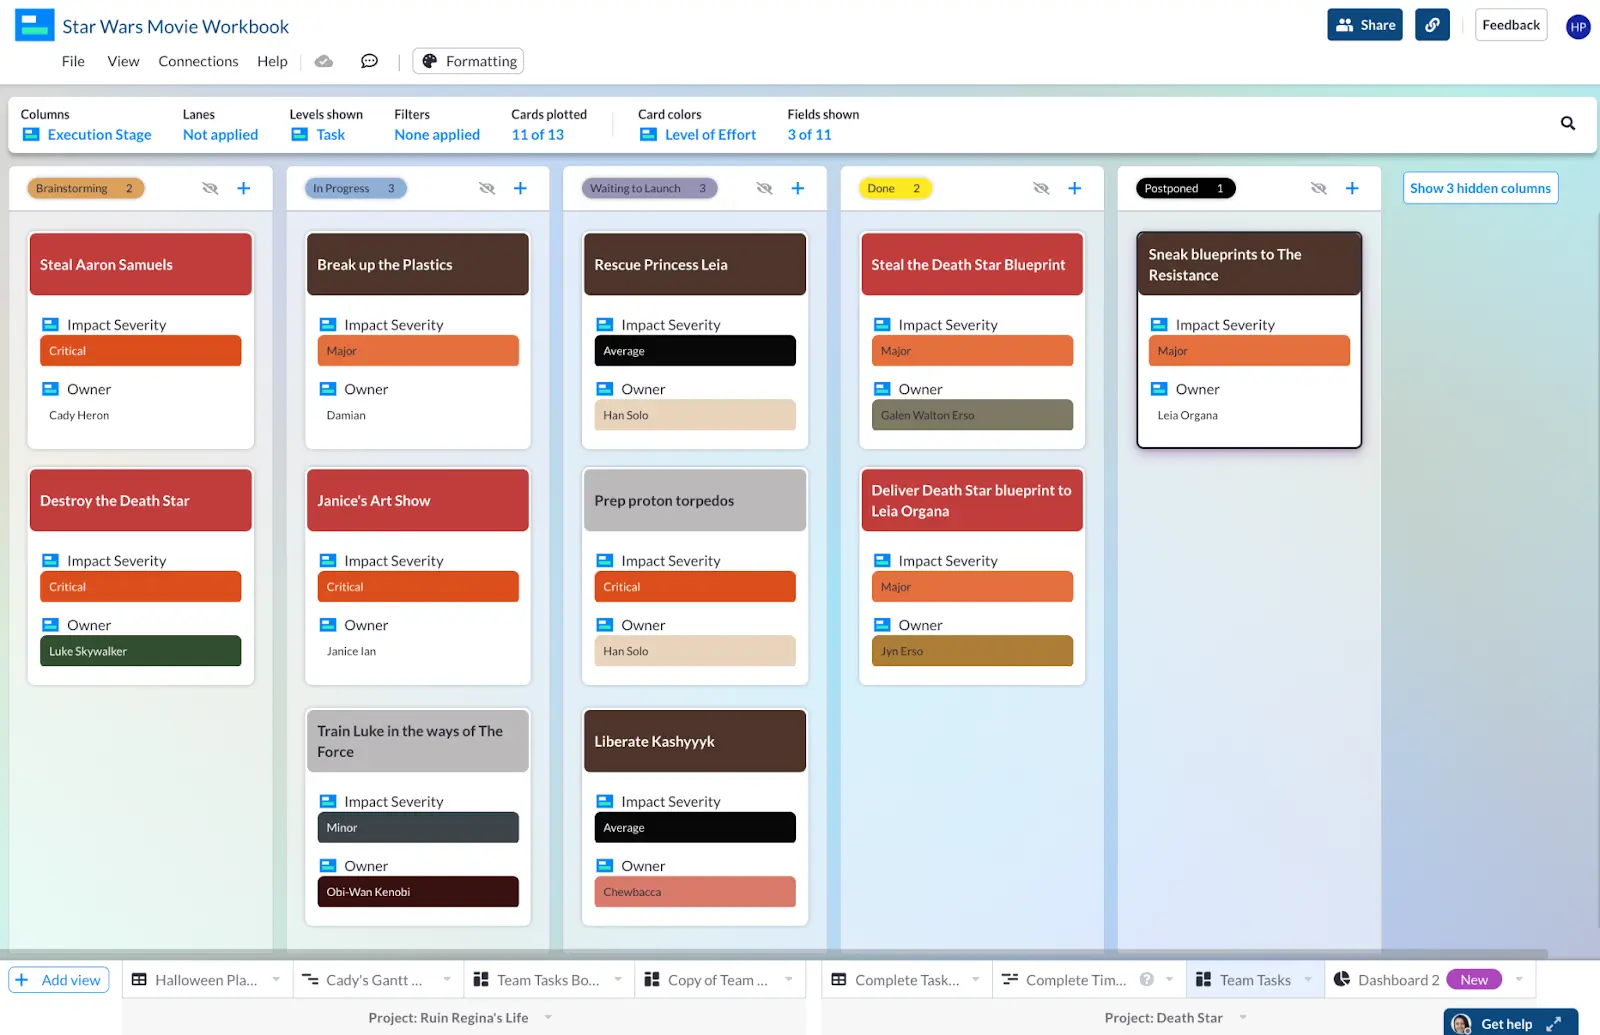
For instance, if we take away the swimlanes and add the task owner to the cards instead, this view becomes significantly more manageable.
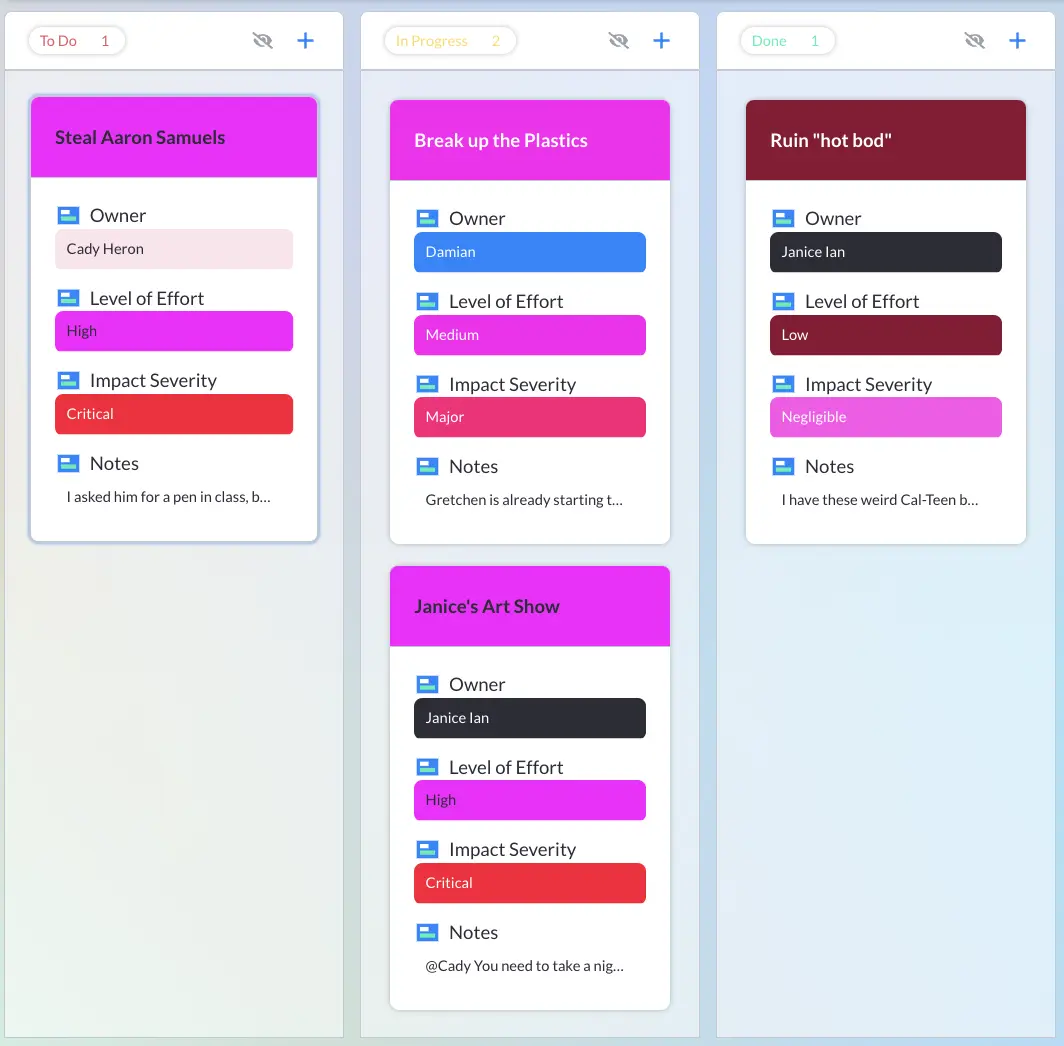
Detailed cards in Visor (displaying many fields from tasks):

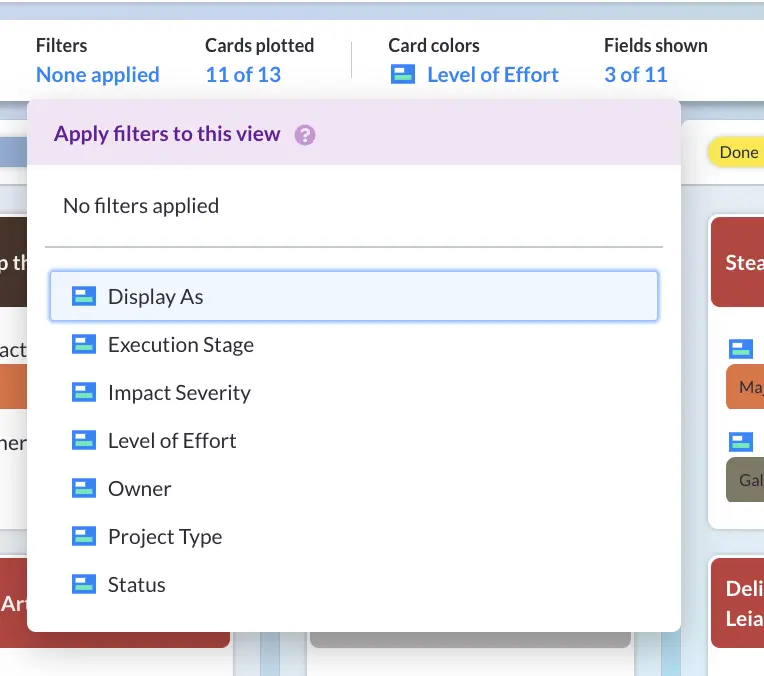
Filtering options can also make both Gantt charts and kanban boards much easier and more intuitive to use. Luckily, Visor has lots of filtering options. You can even set up new views just organized around which information you want to see or hide for different reasons.
Visor’s filters
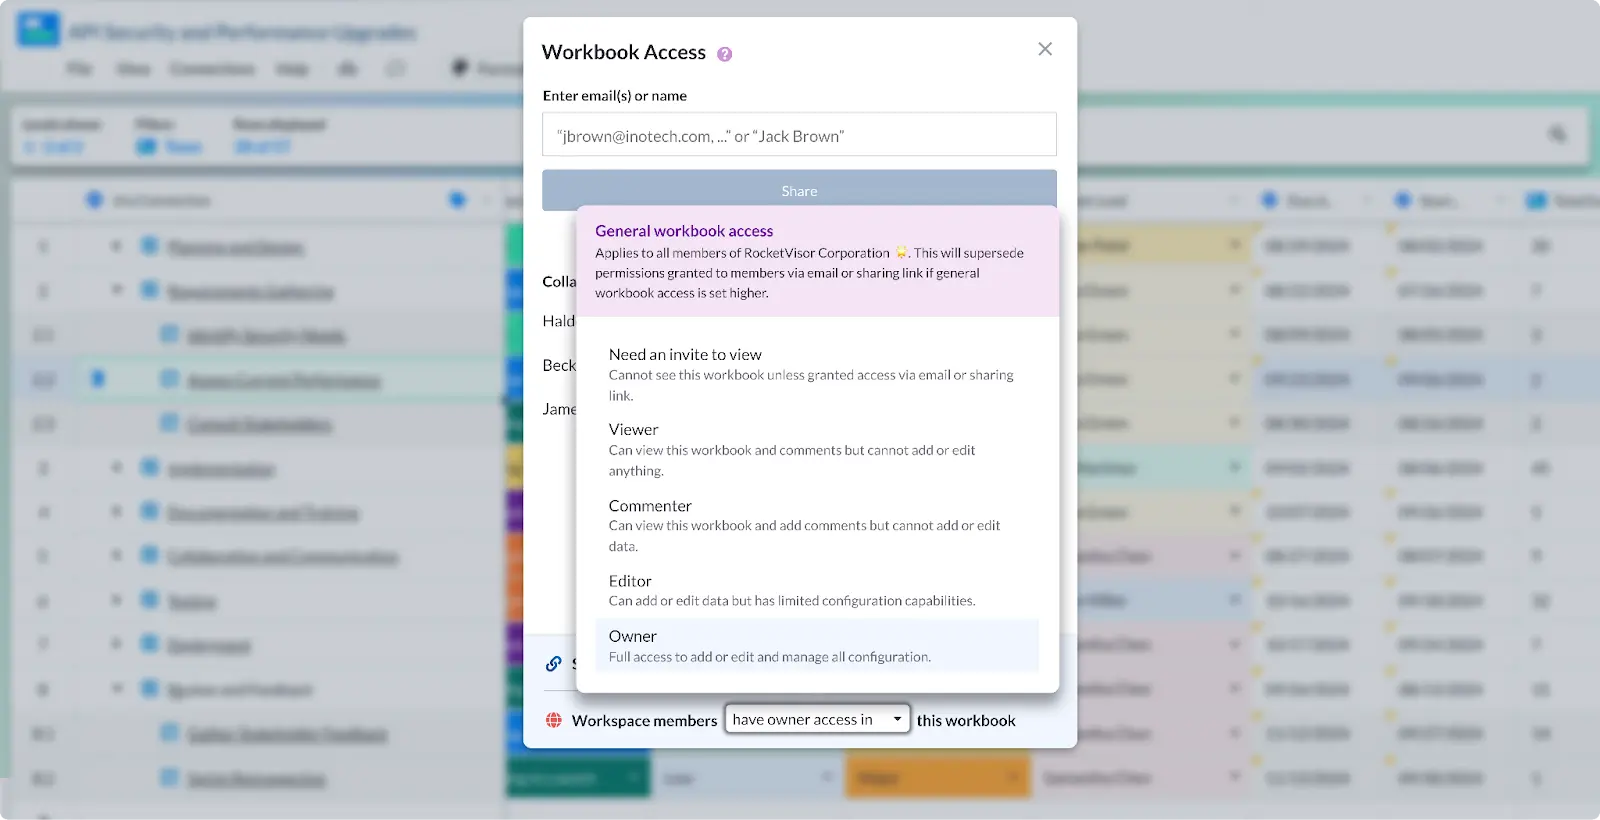
When your project is so big, you might also want to think about ways to share with different people across different teams. Visor offers a wide range of ways to share your information, so that the right people always have the right level of access.
Visor’s sharing options:
You might find that you need Kanban views for some information and Gantt views for others. Maybe you like to have a look into who is doing what using Kanban swimlanes but you also want to see how different tasks overlap.
You can use a tool like Visor to arrange the same project data into a wide variety of different views that will all update when you change something in one view, so it remains in sync with itself forever.
Regardless, it’s good to know when you need each type of chart.
Gantt charts are also great for giving stakeholders real-time updates of a project’s progress. You can do this with a Kanban board, but because Kanban boards are agile, and not tied down to start and due dates they don’t provide much value to stakeholders who are most interested in when work will start and end, and expect to see those dates clearly represented.
Gantt charts created in apps like Visor can be shared with stakeholders to give them a real-time view of project progress. Real-time Gantt chart views can also be embedded in other apps to complement updates and presentations. For example, many product managers and project managers that use Jira create Gantt charts in Visor, which they can then embed in Confluence.
Visor also has two-way integrations with Jira, Asana, and Salesforce. This means you can create crystal-clear, sumptuous visualizations of your live project data from one or all of these apps.
For example you can create Salesforce Gantt charts, which isn’t possible in Salesforce itself. Or you can create colorful Jira dashboards, Kanban boards, and other views.
You can also combine data from multiple projects to create portfolio visualizations, or visualizations that combine multiple projects from different apps.
When do you need a Gantt chart?
Gantt charts are an excellent project management tool, but there are times when you’ll absolutely need one:
- When you’re working with an especially complex project with lots of tasks
- When you have a large team, or multiple people contributing to tasks
- If you have hard deadlines and clear milestones
- When you need to see exactly how long tasks will take to complete
Gantt Chart Pros and Cons
Pros
- Progressive – If progress on a task is important to your stakeholders, a Gantt chart can visualize that for them clearly
- Complex- Gantt charts are perfect for highly complex teams and projects
- Perfect for scheduling – If time is the #1 factor, you need a Gantt chart
Cons
- Not especially flexible – Gantt charts don’t have much variability; what you see is what you get
- Confusing – If you’re new to this type of chart, Gantt charts may feel overwhelming
- Not for small projects – If your project has just a few items, a Gantt chart is just going to look silly
Kanban vs Gantt: What do you need?
Of course, the right tool for the job is the one you need at the moment. There’s no one right way to structure all data, just different pros and cons of different styles. You’ll likely use both Kanban and Gantt charts at different times and for different purposes.
So when you do, make them best-in-breed. Visor is a powerful project management tool that offers Kanban, Gantt, Spreadsheet, Timeline, and other great chart options.
Always visually appealing and crystal clear, Visor integrates data from the apps your teams already use, like Asana and Jira, to help you get everything you need to know in one powerful place. You can try it today, completely free.
Pop Culture-Inspired Kanban & Gantt Charts
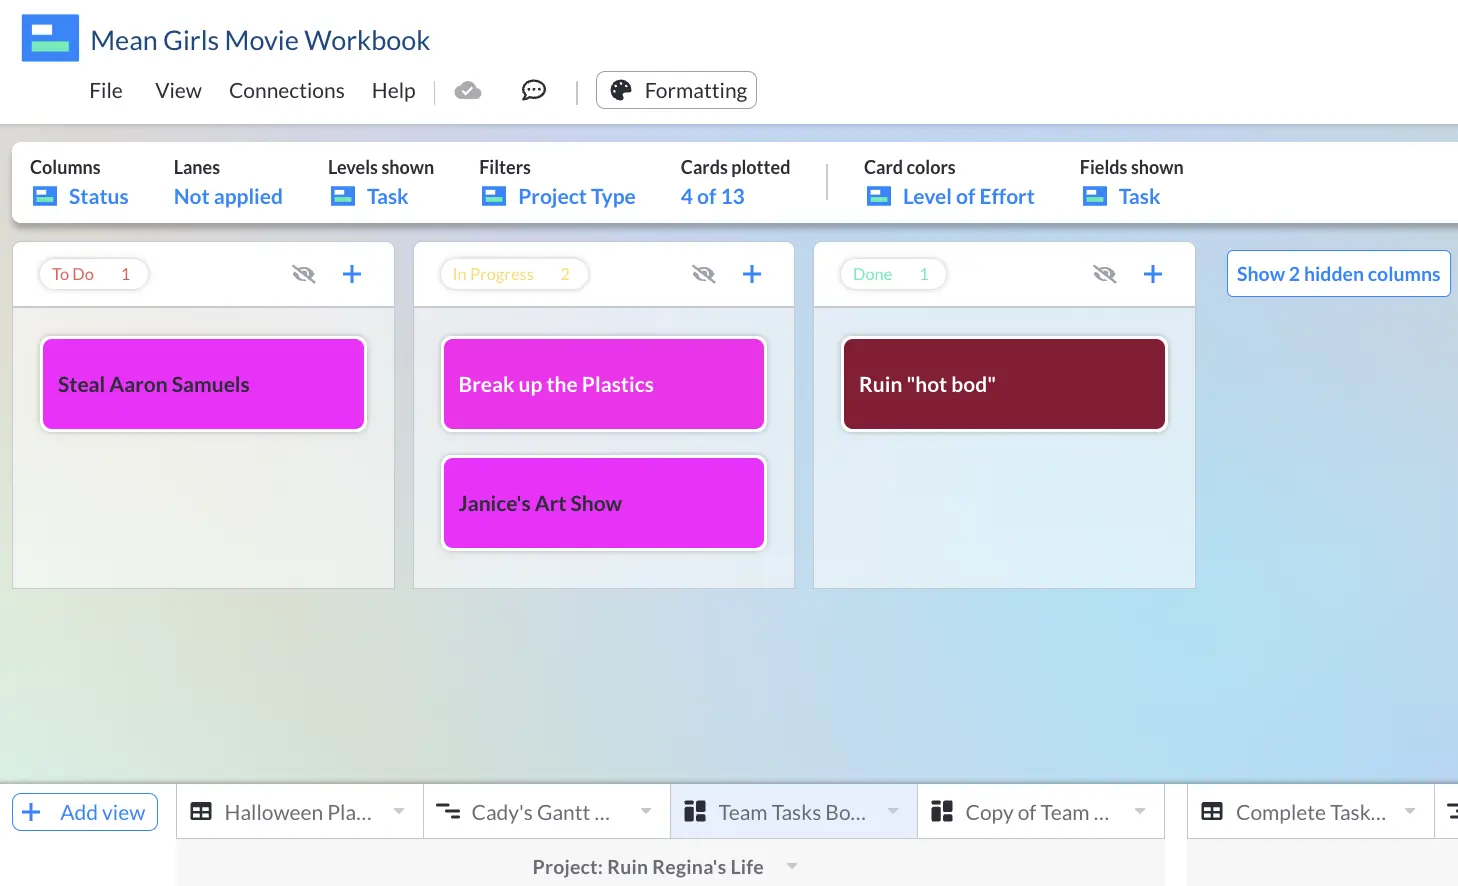
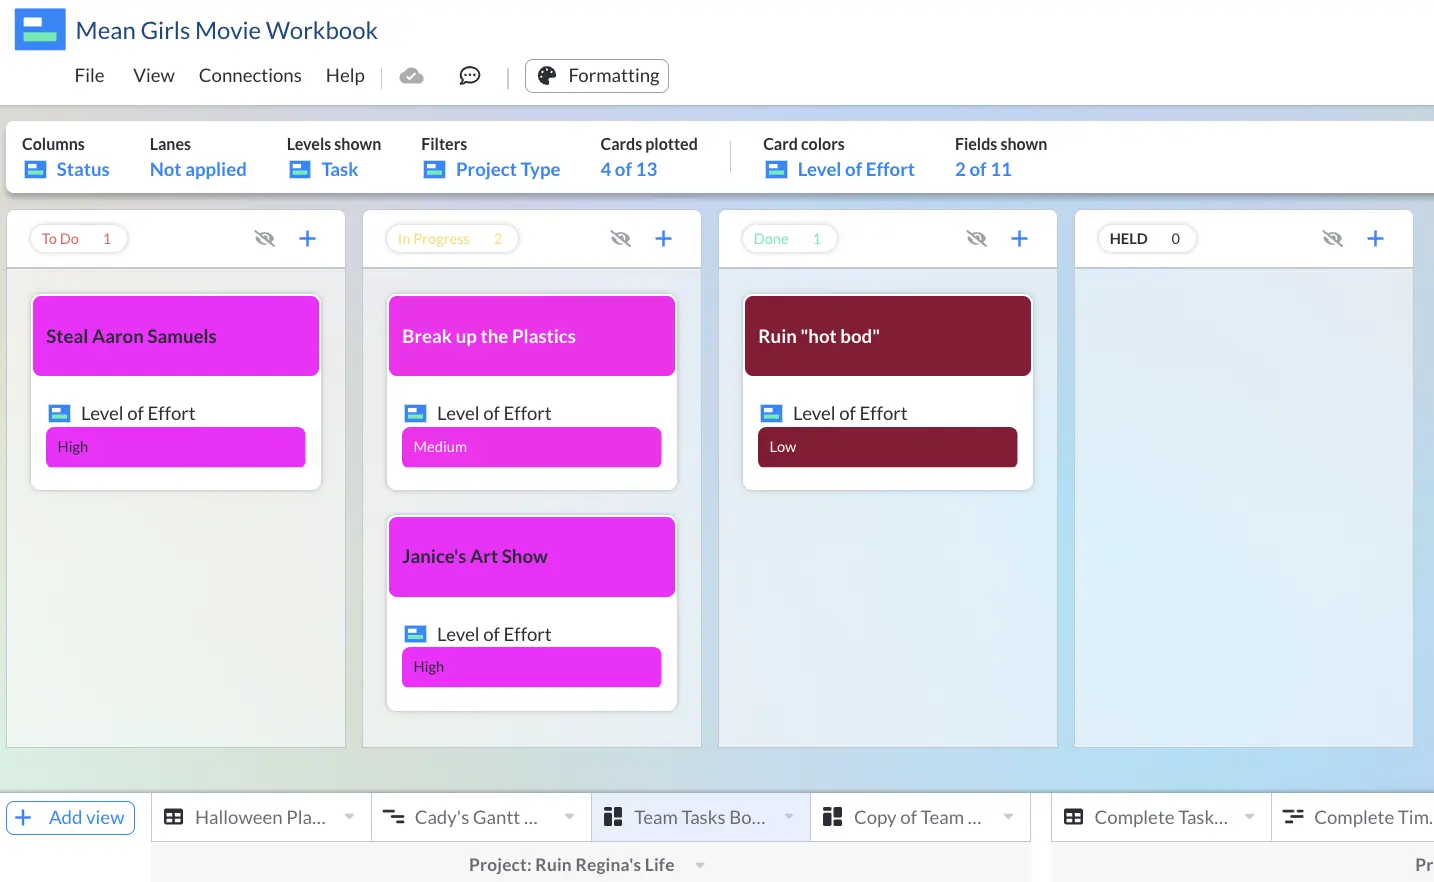
Here are some fun examples of Kanban boards and Gantt charts I created based on Mean Girls and the Star Wars franchise.
These can be great to help people unfamiliar with these types of project management visualizations, and even project management itself, to get a clearer idea of what Kanban Boards and Gantt charts are for, how they work, and how to use them.
That said, if they’ve seen neither set of movies then you’re probably going to confuse them further!
Mean Girls Kanban Board & Gantts:
Star Wars Kanban Boards
