Jira Dashboards Guide: How To Create Custom Dashboards With Your Jira Data

Start using Visor today
- Visualize all your projects and data

- Roll up multiple projects into portfolio views
- Try Visor for FREE
Jira dashboards can be a game changer in your ability to monitor performance, align teams, and keep stakeholders informed. They’re a key part of fully utilizing Jira for project management.
However, the power of Jira dashboards can be hard to unleash. Creating basic dashboards in Jira is more complicated and convoluted than in other systems. Making complex Jira dashboards can be a whole new skill set in itself.
In this blog, I’ll explain what you need to know to create custom, powerful Jira dashboards and the mistakes you should avoid.
I’ll also show you how you can create Jira dashboards with ease in Visor, using our Dashboard view to give you levels of customization, enable project portfolio management, and sharing options that aren’t possible using Jira’s native dashboard functionality.
Jira Dashboards – The Basics
I’ll explain some foundational aspects and terminology you need to know about Jira dashboards. First, you should also know that you can use Jira Project Reports to analyze essential elements of a single Jira project without creating dashboards.
Jira Project Reports
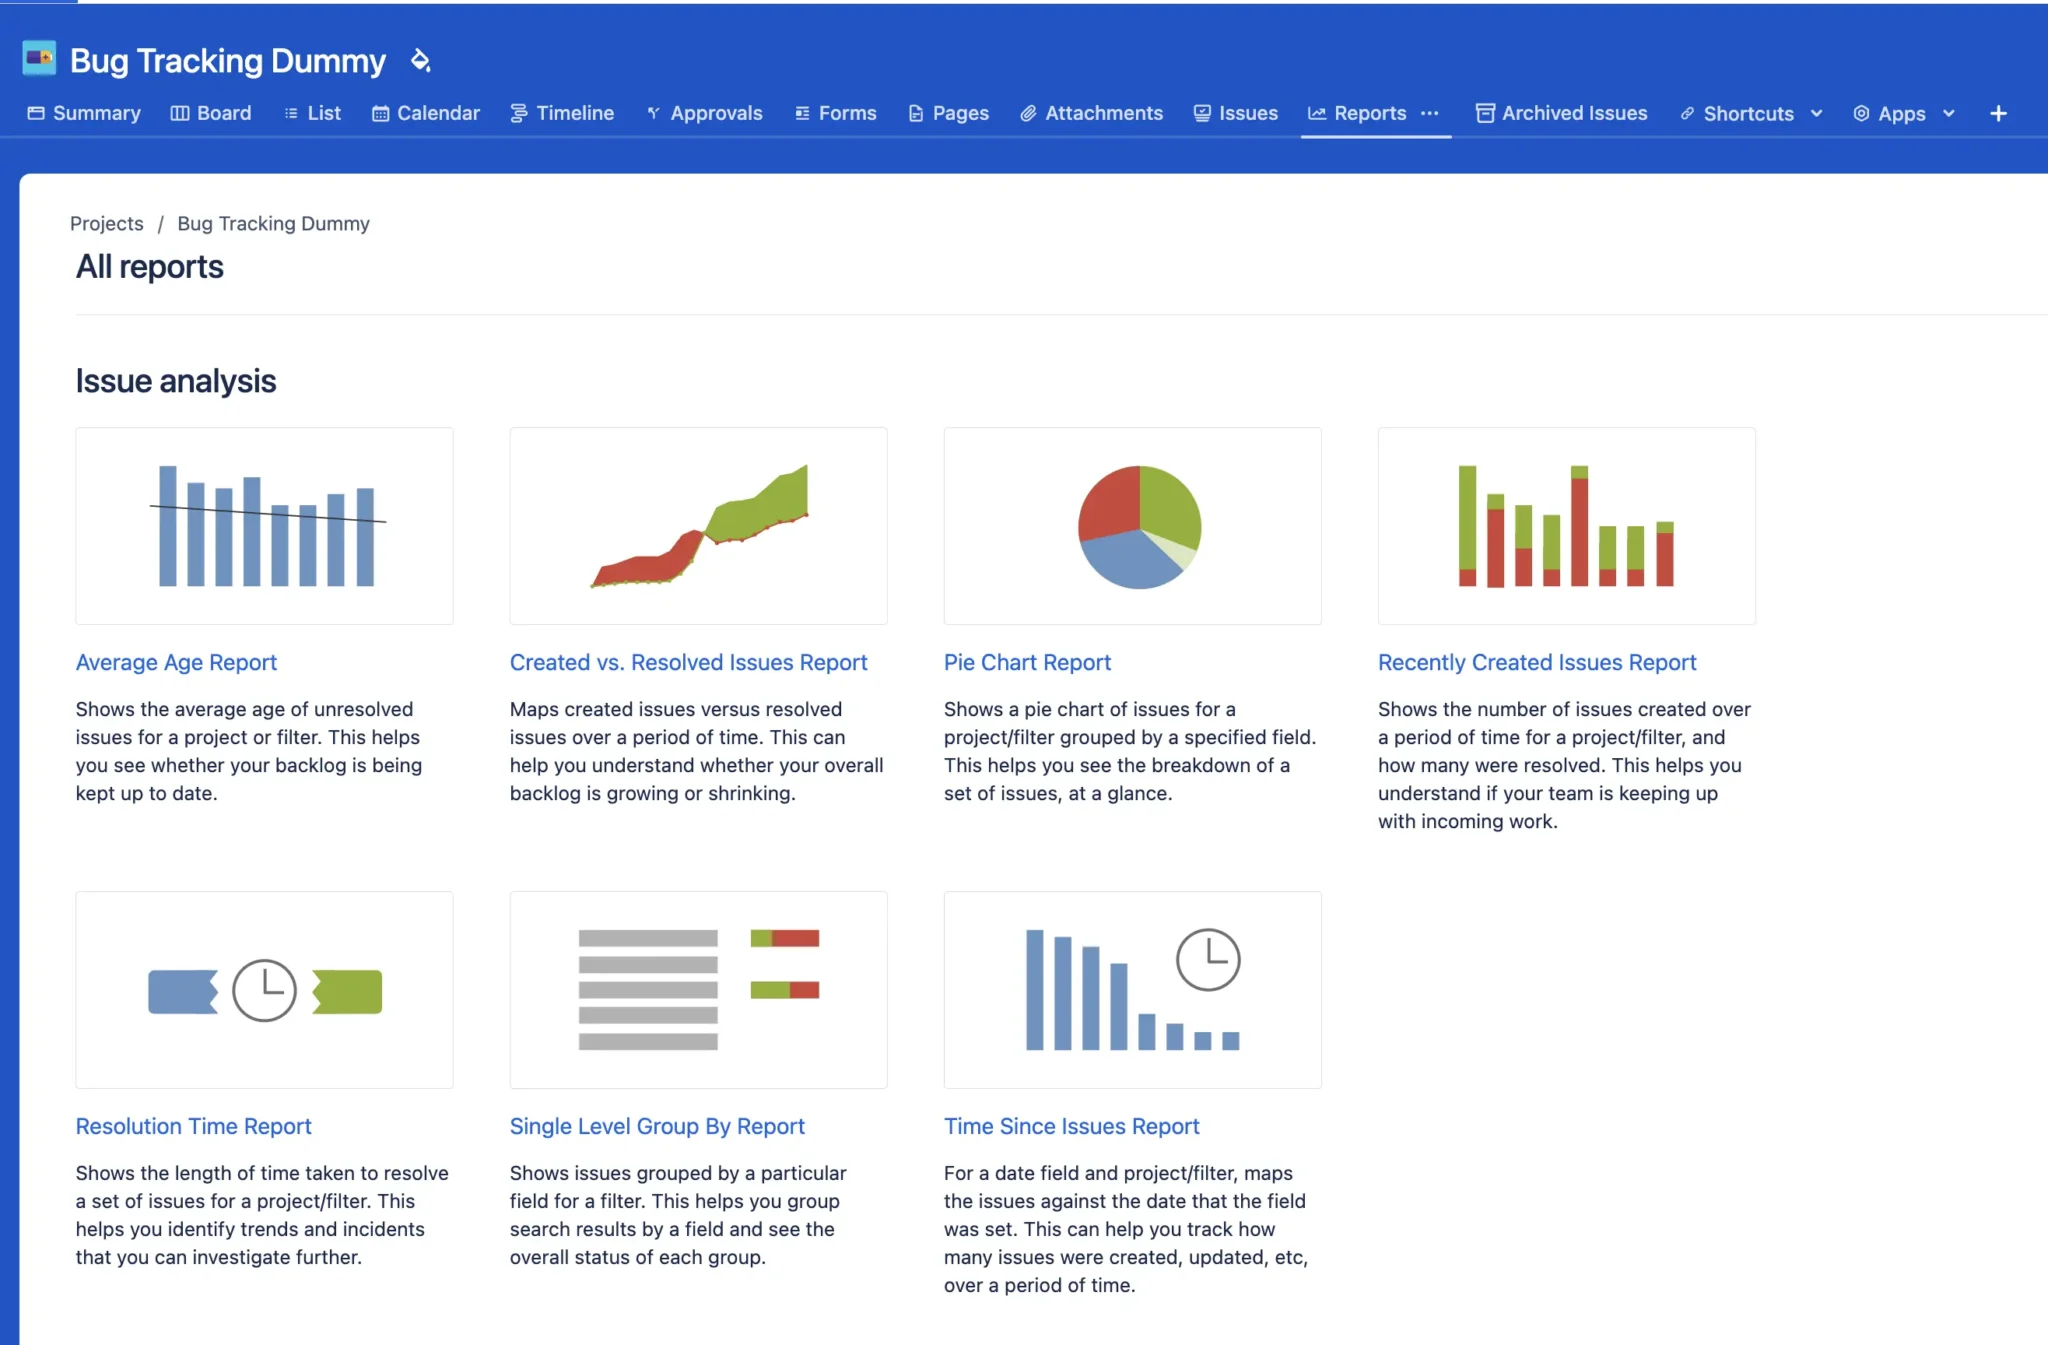
To access the in-project reports, navigate to your Jira project and select the Reports tab. I won’t go into detail about how to set these up as we will stray too far away from dashboards, and besides, it’s very easy to do.
Here’s the standard set of reports you’ll find in your projects:
Jira reports are easy to set up but aren’t as versatile or configurable as gadgets. You can’t combine them on a single screen either, so most Jira users use dashboards.
Jira Dashboard Building Blocks
You’ll need to create a dashboard if you want to combine multiple charts and other information or data visualizations into one view.
In Jira, dashboards are created by combining ‘gadgets’ and using filters to splice and segment your project data.
What is a Jira Dashboard Gadget?
Jira dashboard gadgets are the different charts, diagrams, and tables you bring together to create a dashboard.
Pie charts, an average age scorecard, gauge, heat map, table, burnup or burndown charts, days remaining in the sprint counter, and an activity stream display are all gadgets you could put together on a dashboard.
Where Can You Find More Jira Dashboard Gadgets?
Jira comes equipped with relatively few gadgets, which has fostered a thriving and lucrative market for Jira plugins offering specific gadgets, collections, and entire suites of more advanced gadgets.
One annoying aspect of using dashboard or gadget plugins for Jira is that you typically have to pay in line with the number of Jira users in your instance. So, if you have twenty Jira users, you’ll need to pay for twenty licenses for your new Jira gadget plugin, even if you’re the only person using the dashboard/gadgets.
You can circumvent this pricing model using free apps like Visor to create advanced, customizable dashboards. Visor has a two-way integration with Jira but is not a plugin and, therefore, isn’t charged on the same Jira equivalent basis.
Visor can save you a lot of money and enables you to share your real-time dashboards (instead of exports or screenshots) with stakeholders who don’t have access to Jira.
Find out how you can use Visor to Master Jira Project Oversight in this webinar:
How To Create a Dashboard in Jira
Step 1:
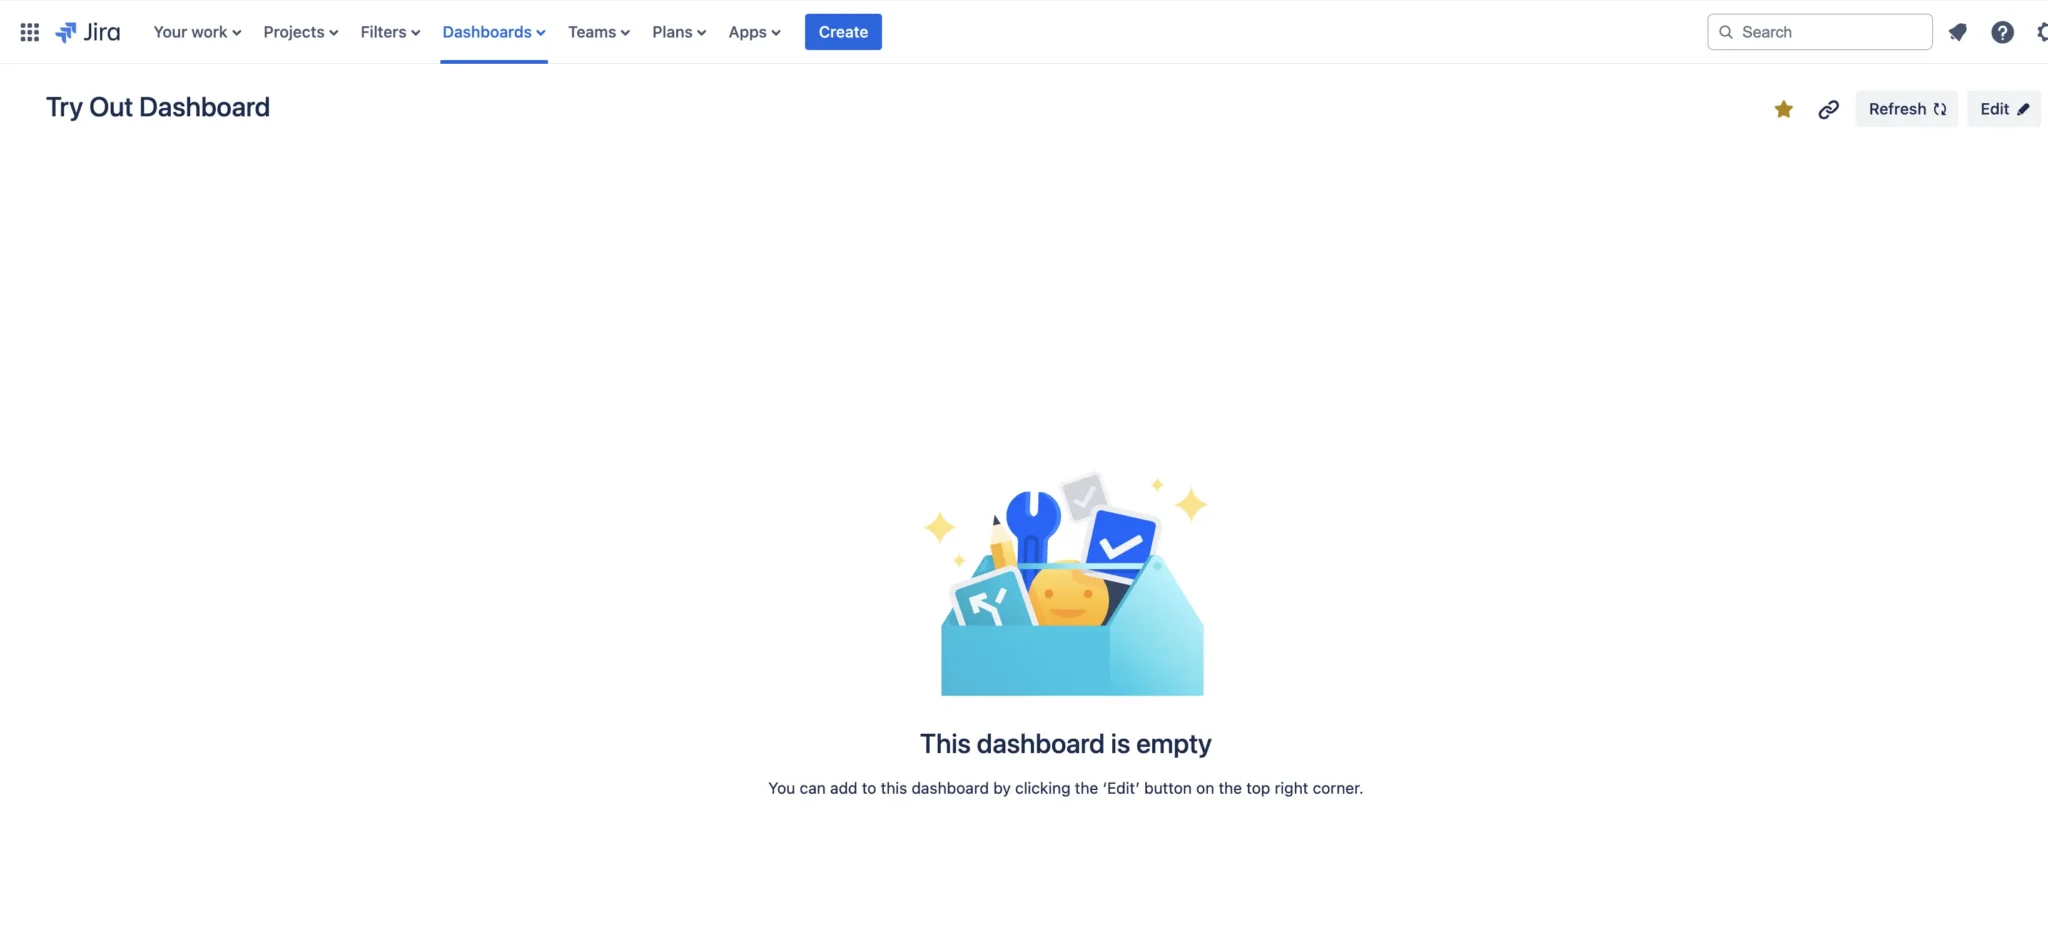
In Jira navigate to Dashboards, then Manage Dashboards, then Create New Dashboard. Then you’ll be met by this empty dashboard screen:
Step 2:
Next, on the dashboard screen, click Edit, and start adding some gadgets to your dashboard.
Step 3:
For your first dashboard it makes sense to include these gadgets:
- Issue Statistics
- Filter Results
- Assigned To Me
- Issues Calendar
- Created vs Resolved Chart
When you add a new gadget, you’ll be presented with a configuration menu for the gadget:
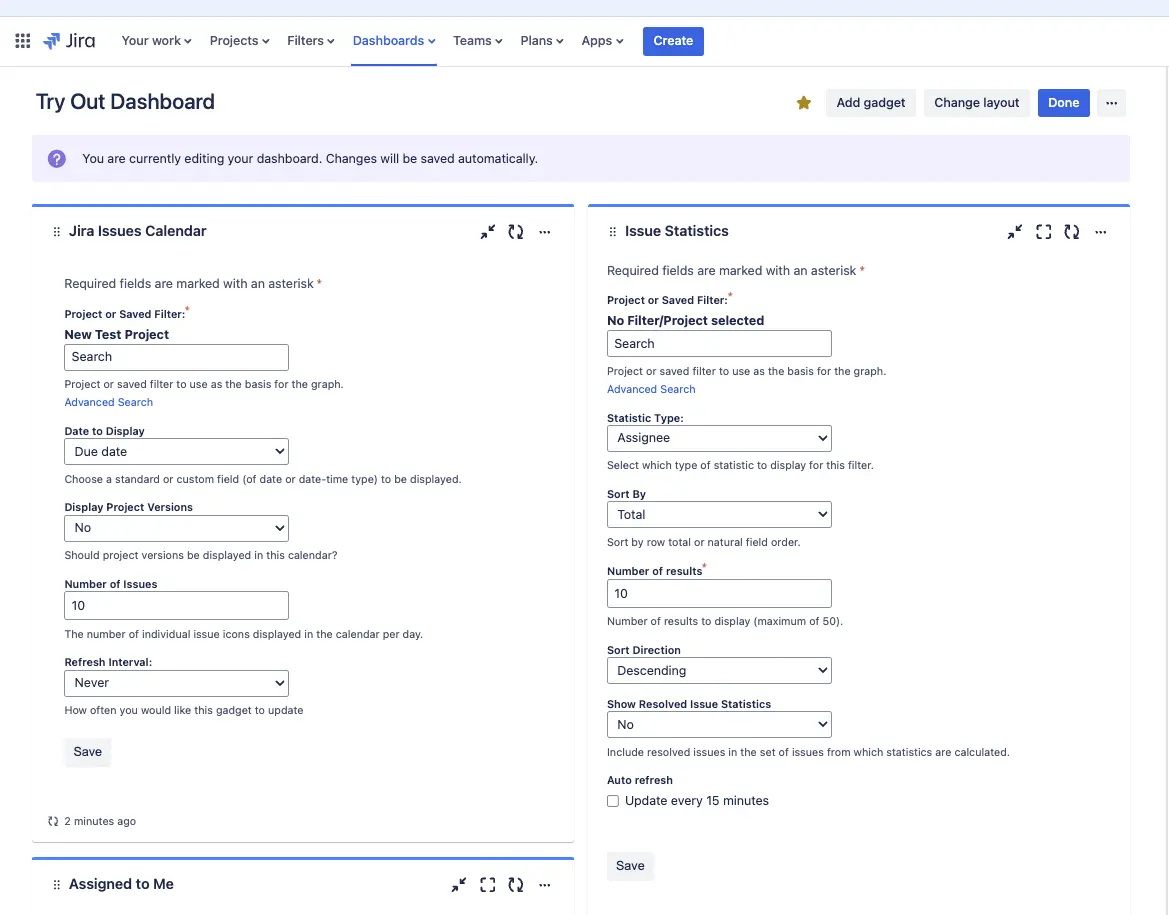
On these configuration panels you can select the dataset for the gadget, and display options. You can also filter Jira dashboards using JQL.
How To Create A Jira Dashboard Using Visor
Here’s how to create dashboards using live (real-time) Jira data in apps like Visor.
Step 1:
First, create your free Visor account.
Step 2:
Then follow the wizard to import your Jira data, selecting which projects and data you want to report on in your dashboard (yes, that’s right, you can import and report on a portfolio of multiple projects in Visor, to create project portfolio dashboards.
Step 3:
Once the import is complete, click Add New View and select Dashboard:
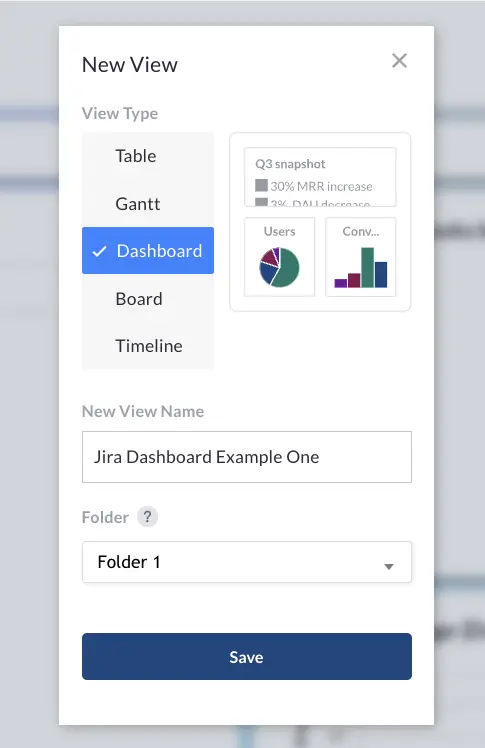
Step 4:
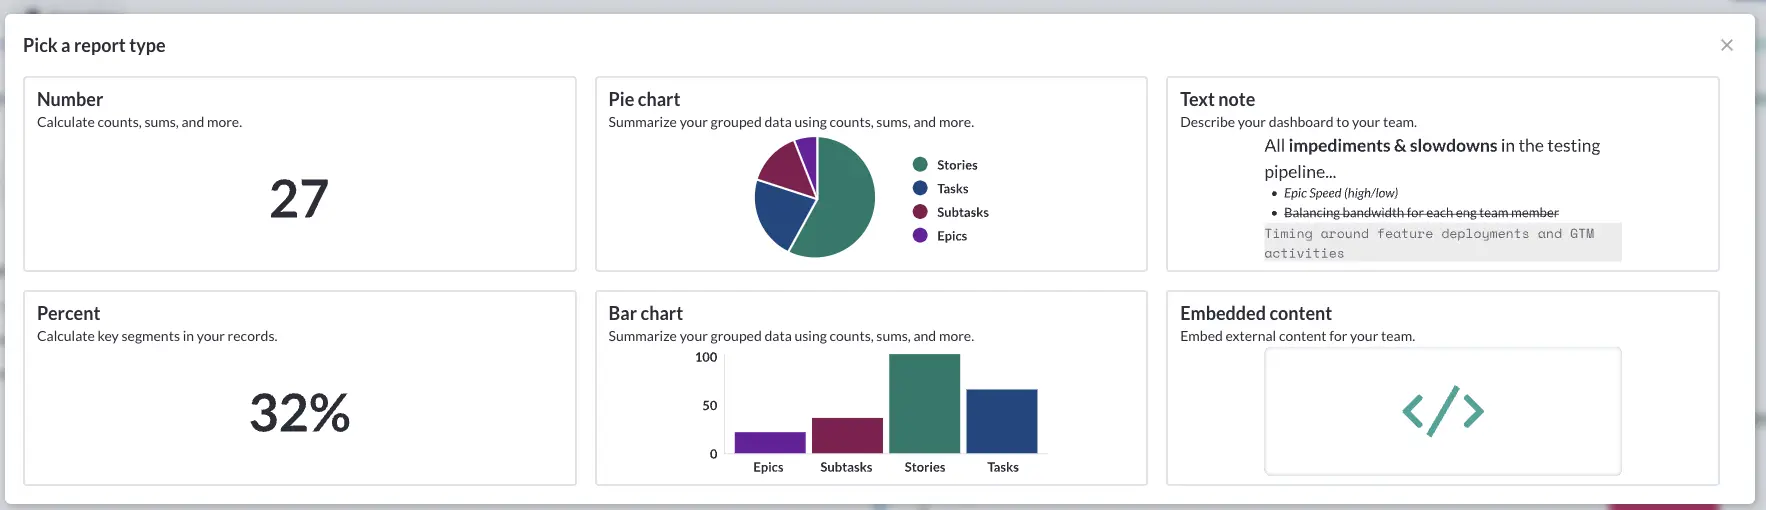
Then start adding your reports/charts. Click Add Report and select from:
- Number scorecard
- Percentage scorecard
- Bar chart
- Pie chart
- Rich text
- Embed content
Here’s the selection screen for reports in Visor’s dashboard view:
Step 5:
Then select the data for this chart, how to summarize the data and add multiple filters to make your reports as segmented and precise as you need them to be, example below:
Watch this video for more information on how to create Jira dashboards in Visor:
Visor’s Dashboard Components and How To Use Them With Jira Data
Once your Jira data is imported into Visor, you can transform it into a dashboard. In this section, I unpack the following reports you can select when creating your Jira Dashboard:
- Bar chart
- Pie chart
- Count report
- Percentage report
- Rich text block
- Embedded content
- Bar and pie charts that you can format and filter
Visor’s Jira Dashboard view allows you to create color-coded pie and bar charts with your Jira project data. Choose the fields you’d like to visualize to do so.
You can also summarize numerical fields in charts (such as Time Spent) as:
- Count of records
- Average of
- Sum of
- Minimum of
- Maximum of
- Median of
Using these summaries enables you to create handy charts for metrics and benchmarks that you can use to measure, track, and improve your output.
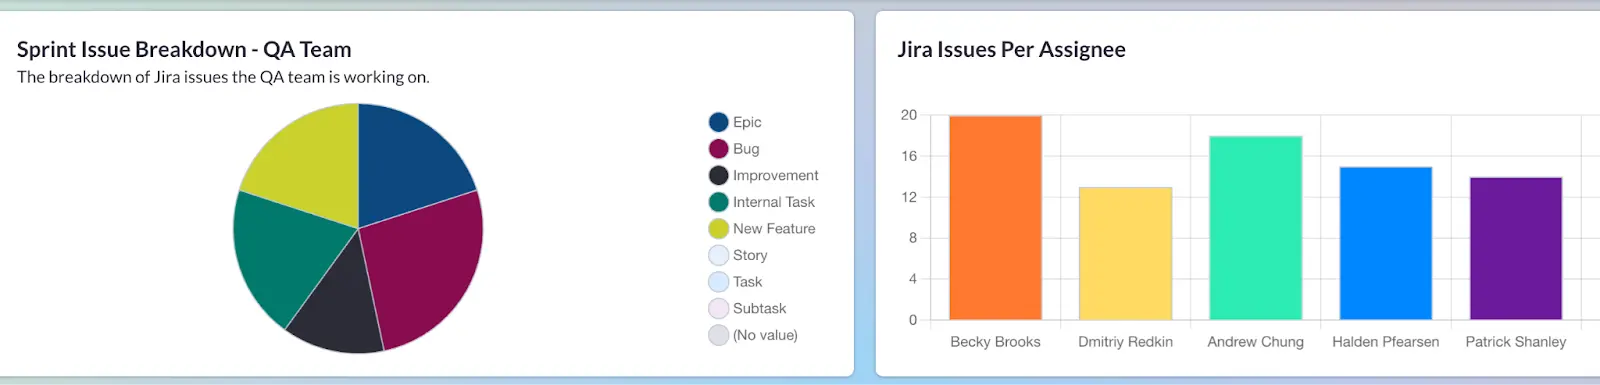
In the Jira Dashboard below, I visualized a pie chart using the “Issue Type” field from Jira and a bar chart showing the number of Jira issues for each assignee.
Colorful graphs in a Visor-Jira Dashboard:
ormatting your Visor-Jira Dashboard Charts:
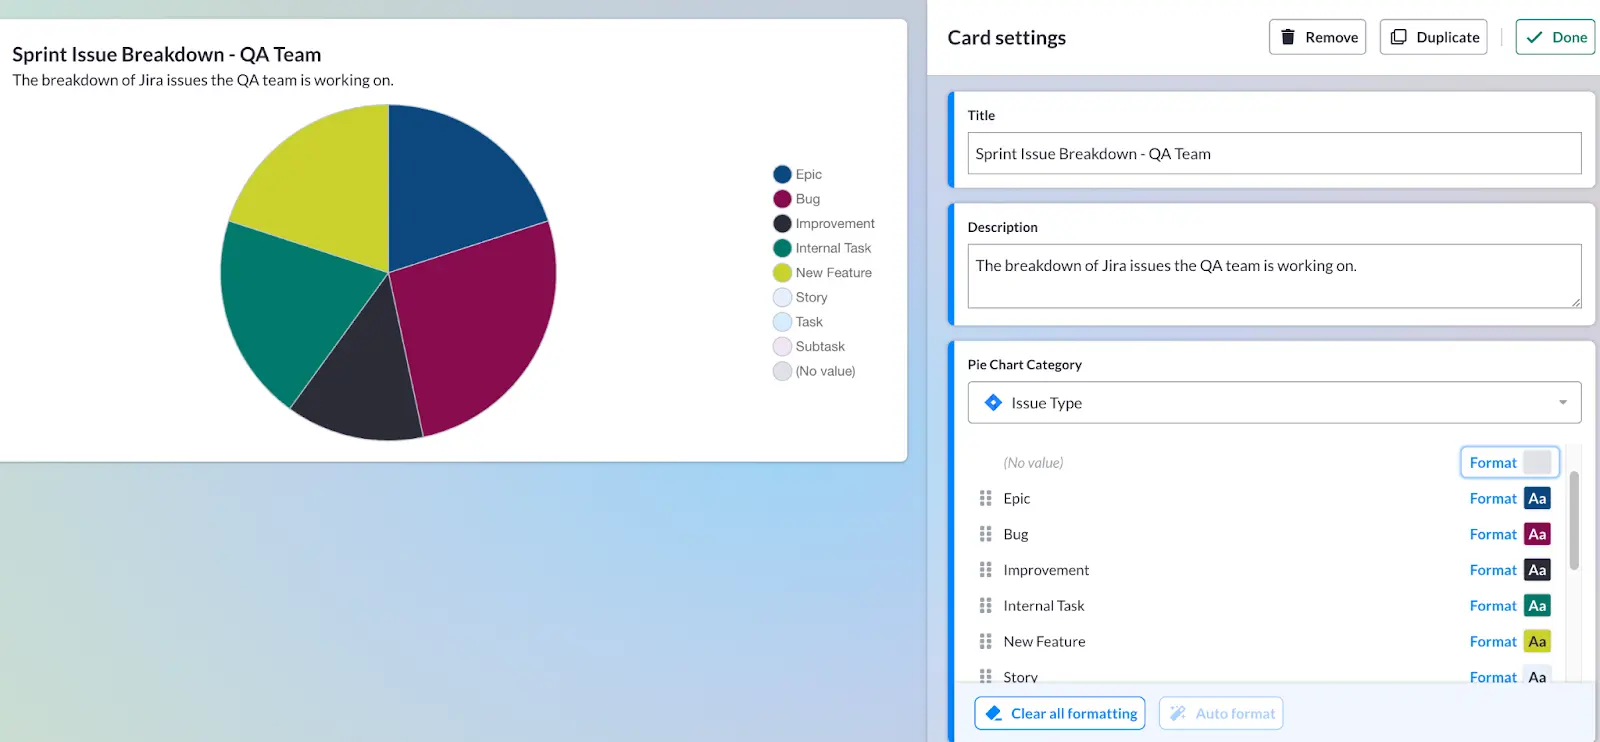
When creating a pie or bar chart, you can choose conditional formatting based on the fields you’d like color-coded. I chose the exact HEX coding based on issue type in the section below. Visor also offers auto-formatting, where we choose the colors for you.
HEX formatting in Visor
In Visor, you can add custom color codes to your charts and reports using conditional formatting, HEX codes, and a custom color picker.
This formatting differs from native Jira dashboards, which has minimal color coding options.
Using Visor, you can leverage color communication to the max and get your key messages across with more impact.
You can also keep things on brand and avoid the sometimes stale color palette that standard Jira dashboards produce.
Filtering Dashboard Charts in Visor
After applying conditional formatting to your charts, you can also add filtering.
Filtering Jira charts in Visor Dashboards is much more straightforward than in Jira itself. However, you can still apply multiple filters and select from different summarization and aggregation options to create precise dashboards that drill down into your project data and uncover relationships.
These “advanced filters” in Visor dashboard views give you precise, actionable insights in an instant.
You can equip yourself with these insights to tackle blockers and risks as they emerge, highlight performance differentials, capacity shortcomings, or other impactful issues, and address them as early as possible before they escalate in severity.
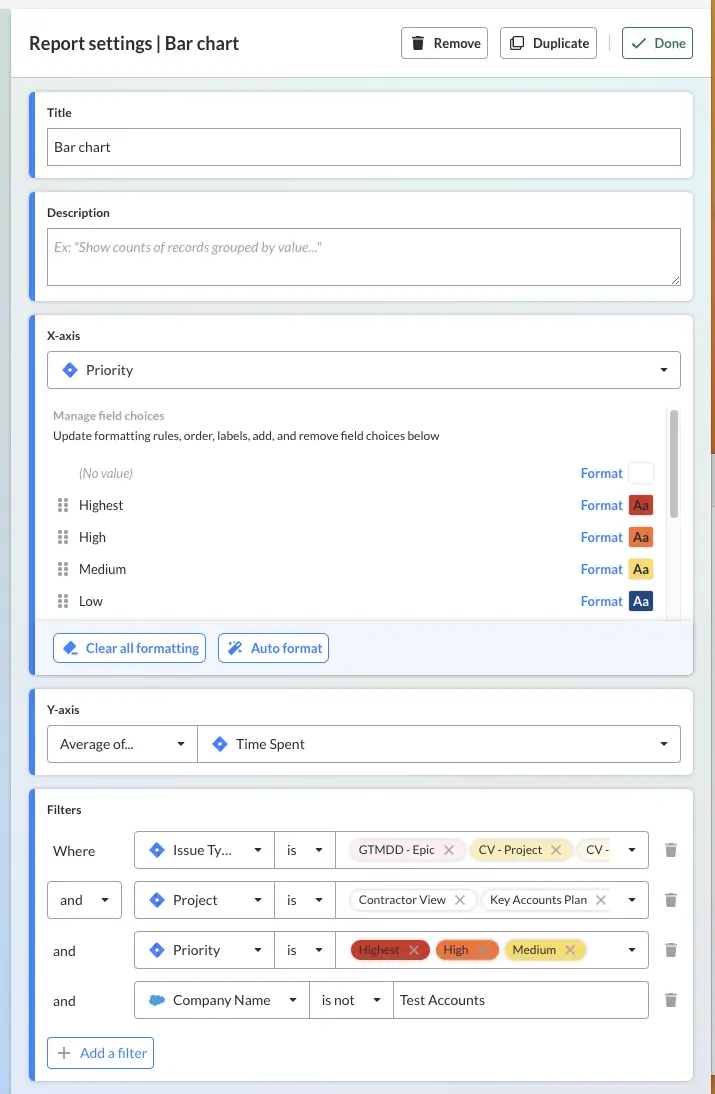
Here’s an example of how I apply multiple filters to create a bar chart in a Visor dashboard that shows the average time spent on different Jira epics, projects, and initiatives:
I’ve set additional filters to exclude any lower priority issues, some specific projects I don’t want to include, and cross-referenced a filter to include any associated issues related to Salesforce test accounts.
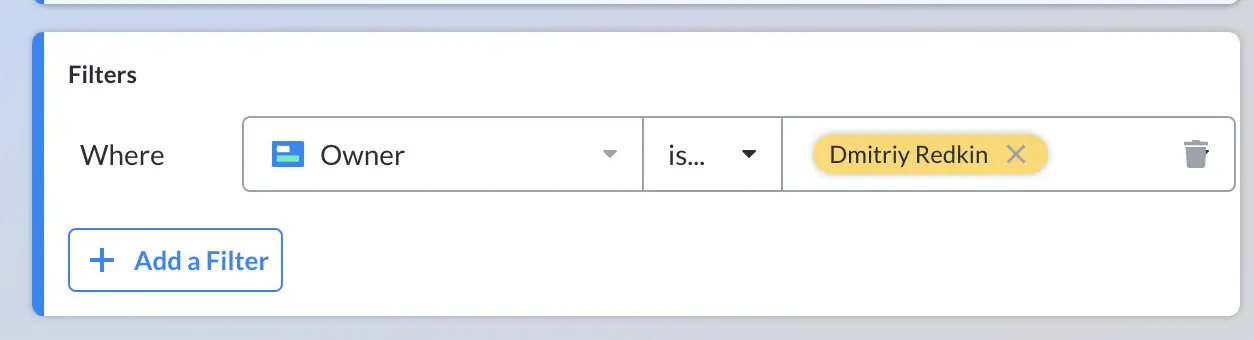
Filtering also allows you to create different views for different audiences. For example, if you wanted a view for each owner of a Jira ticket, you could create different views using filters. Below, you’ll see that I filtered using a Visor custom field, Owner:
In Visor, you can make multiple dashboard versions for different stakeholders, groups, or purposes. You can share these easily, even if the audience doesn’t have Jira login; this just is not possible with native Jira dashboards (as you may know, Jira doesn’t allow guest access), making Visor a far superior stakeholder reporting option for your Jira projects.
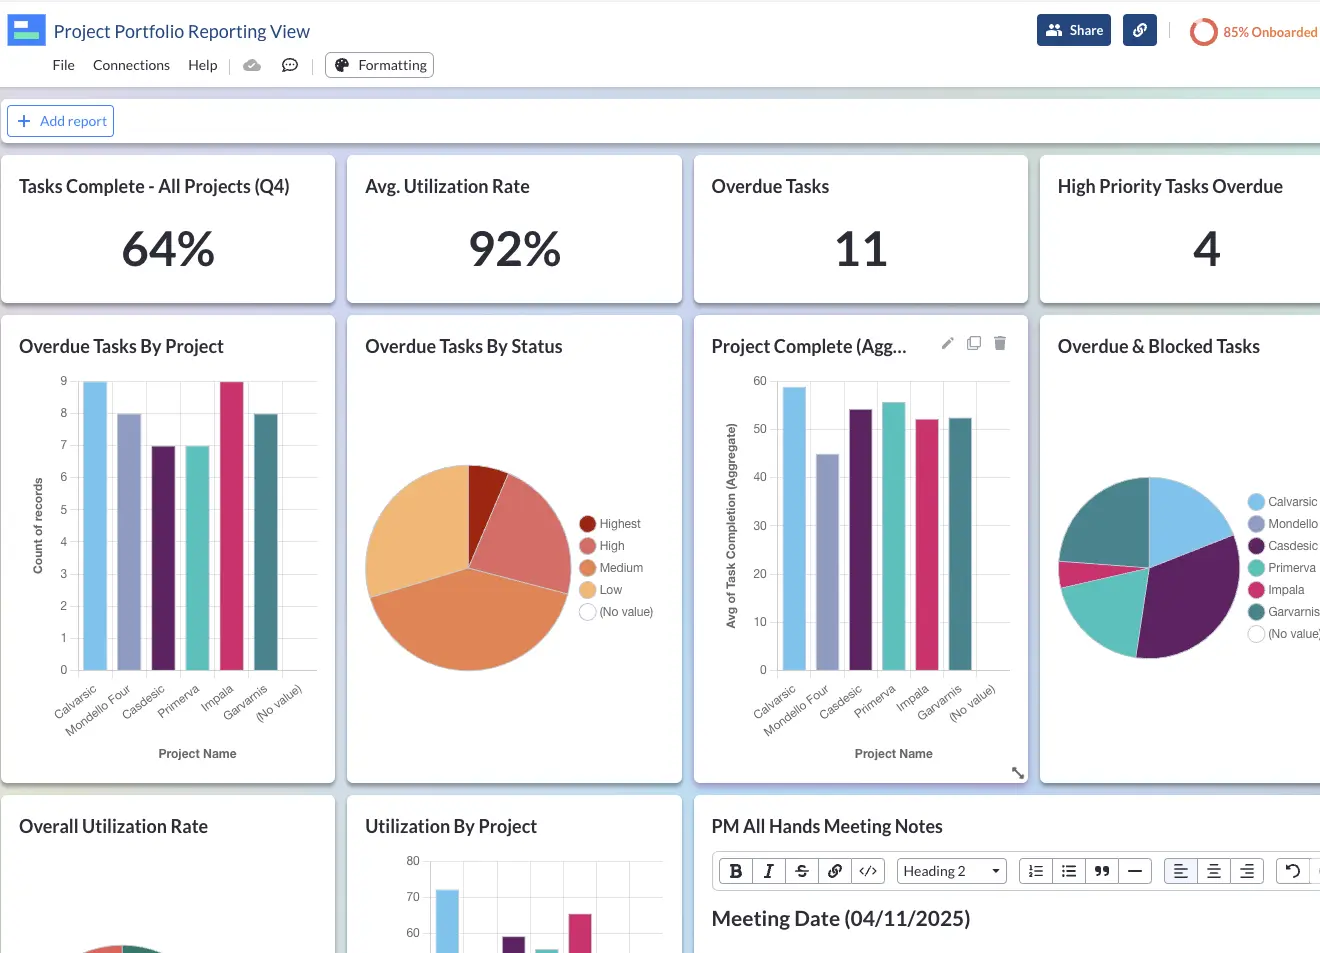
For example, here’s a dashboard that combines and compares live data from multiple Jira projects:
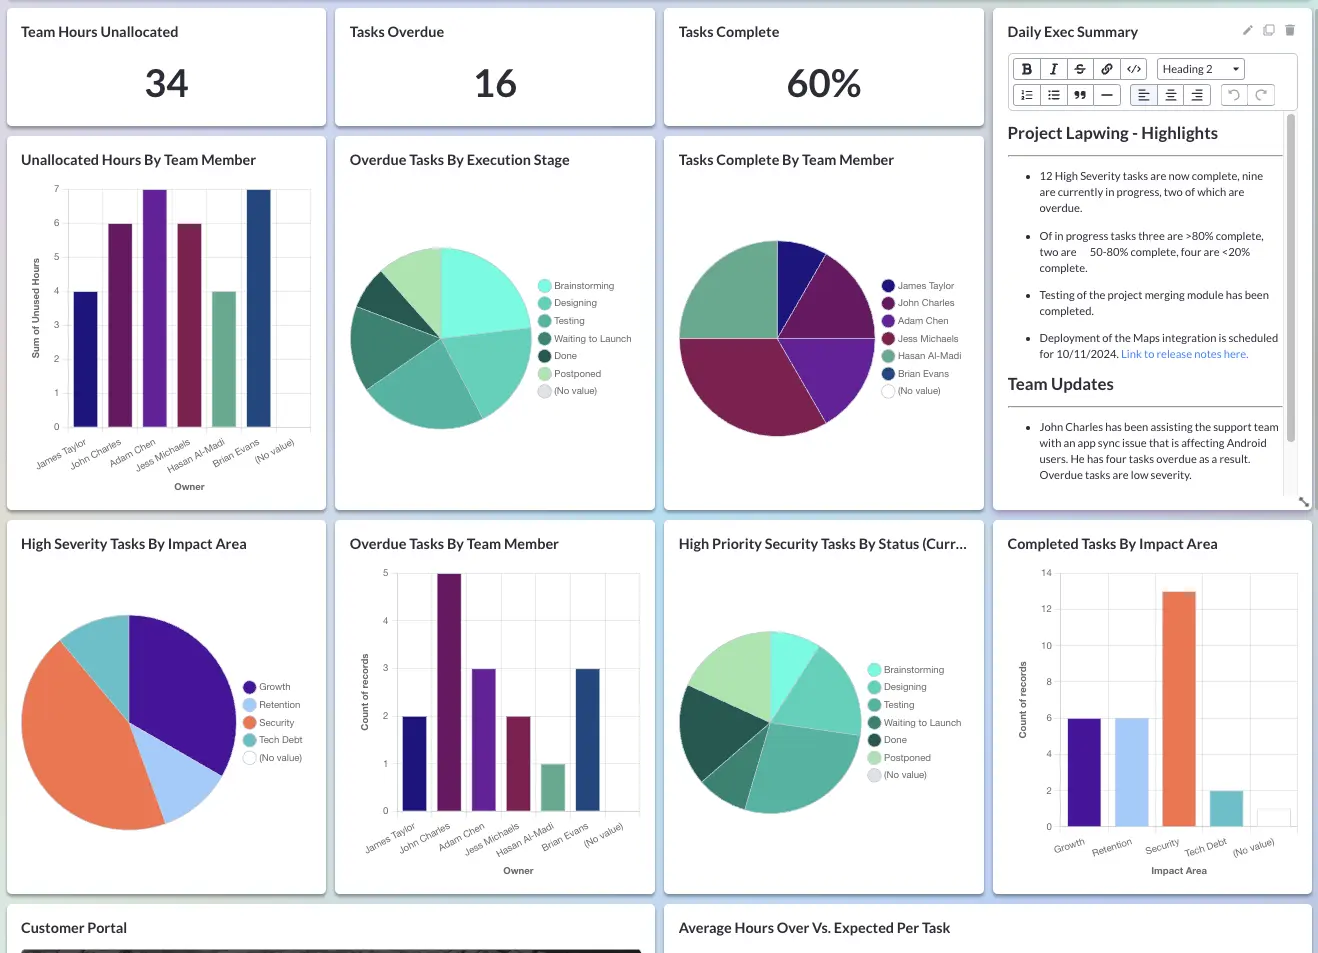
Count and Percent Scorecards
In Visor’s Dashboard view, you can add cards to display high-level stats as numbers or percentages. You can apply multiple filters and summarize the numerical data in various ways to display the stats that are most important to you and the success of your project or projects.
For example, in the image above, I’ve added cards along the top row of my dashboard to display key health metrics, combining data across all the projects I’ve filtered down to.
From left to right, the first card shows the percentage of tasks completed, the second shows the utilization rate, and the third shows the number of overdue tasks. Then, the fourth shows the number of overdue tasks marked as High or Highest priority.
Other common examples of how the Count and Percent Scorecards are used include:
- Assessing how many issues you have in a given sprint
- Seeing if an individual contributor has far too much work
- Determining how many subtasks need to be finished before closing an epic
Rich Text Component
When sharing Jira data with stakeholders, teams, or clients who aren’t looking at your Jira data often (or at all), it’s helpful to provide some additional context.
Formatting and text options are also available to help you emphasize key information. For example, here I’ve added a daily executive summary to contextualize the data and pre-empt any expected queries that could arise when my exec team takes a look.
This helps give a richer and clearer update to my stakeholders:
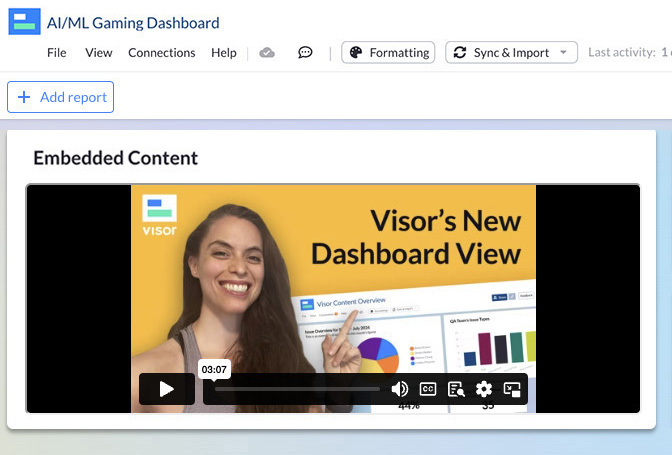
Embedded Content
Whether you want to upload videos from places like Vimeo, YouTube, and Loom or share documentation and charts that you have in other apps, this area of your Jira dashboard allows you to share a holistic view of the story you want to tell to your collaborators and stakeholders.
Below, I’ve embedded our Dashboard view announcement video from Vimeo:
How To Create Powerful Jira Dashboards
- Determine your audience and purpose for the dashboard before you start. Use this to guide your dashboard and edit any irrelevant charts.
- Use consistent filters across related gadgets to avoid confusion or misinterpretation of the information in the charts.
- Group gadgets logically so your dashboard has a flowing narrative – it should tell a story.
- Generally, it’s best to report on data points like custom fields and components rather than labels because multiple versions of labels can emerge through typos and abbreviations.
- Give proper consideration to color coding and visual communication – leverage color theory to help people immediately understand what your charts are trying to tell them.
- Use relative rather than set dates so your dashboard’s time frame updates automatically.
- Add descriptions to gadgets to help people understand what they’re looking at, including any details on which data is and isn’t excluded or any preemptive answers you can provide to questions people are likely to have.
- Get feedback from people who use the dashboard so you can continuously improve it – just because it makes sense to the author doesn’t mean it makes sense to the audience!
- Consider the order in which people will look at the gadgets in your dashboard. Typically, starting with the most important or highest level data in the top left makes sense, moving to the top right, then down to the second-left row in a continuous zigzag pattern.
- Apply advanced filters with boolean logic to create more precise reports and cut out the noise.
Example of an attractive and informative dashboard, using live Jira data in Visor:
How To Create Bad Jira Dashboards
- Don’t define your audience, what they care about, and their familiarity with the information you share.
- Use different JQL filters across gadgets, making each gadget a new and lengthy adventure in understanding different data you’ve decided to use each time.
- Don’t worry about whether your dashboard tells a story. Narratives don’t help people make sense of data.
- Focus on cramming in as many gadgets as possible; this is playtime, and you have a bunch of new toys after all.
- Use this as an opportunity to show off your incredible Jira dashboarding skills rather than focusing on communicating clearly.
- Don’t use color. Keep your dashboard bland and boring; ensure your audience needs to put in the work to understand it.
- Include numerous gadgets with lots of text; make it look like a collage of newspaper clippings. Make the text small so people can give their browser’s zoom functionality a good test drive.
- Don’t consider the order in which people will view the different gadgets in your dashboard. Putting the overarching or most important metrics in the bottom right-hand corner creates an engaging treasure hunt for your audience.
Why You Can Make Better Jira Dashboards With Visor
Apps like Visor enable you to create better Jira dashboards. In Visor, you have a whole world of color coding opportunities and greater customization than in Jira. You can also share your live dashboard with anyone, even if they don’t have a Jira account.
Creating dashboards using Jira data in Visor is easier and more intuitive. You also don’t need to find a specific gadget for each chart you want.
Just add a chart, select the data points you want to report on, apply filters and color coding, drag-and-drop into place, and hey, presto—you’ve got a professional Jira dashboard without hours and hours of work.
You can then share this with anyone and create nuanced versions of the same dashboard for different audiences, including stakeholders without Jira access.
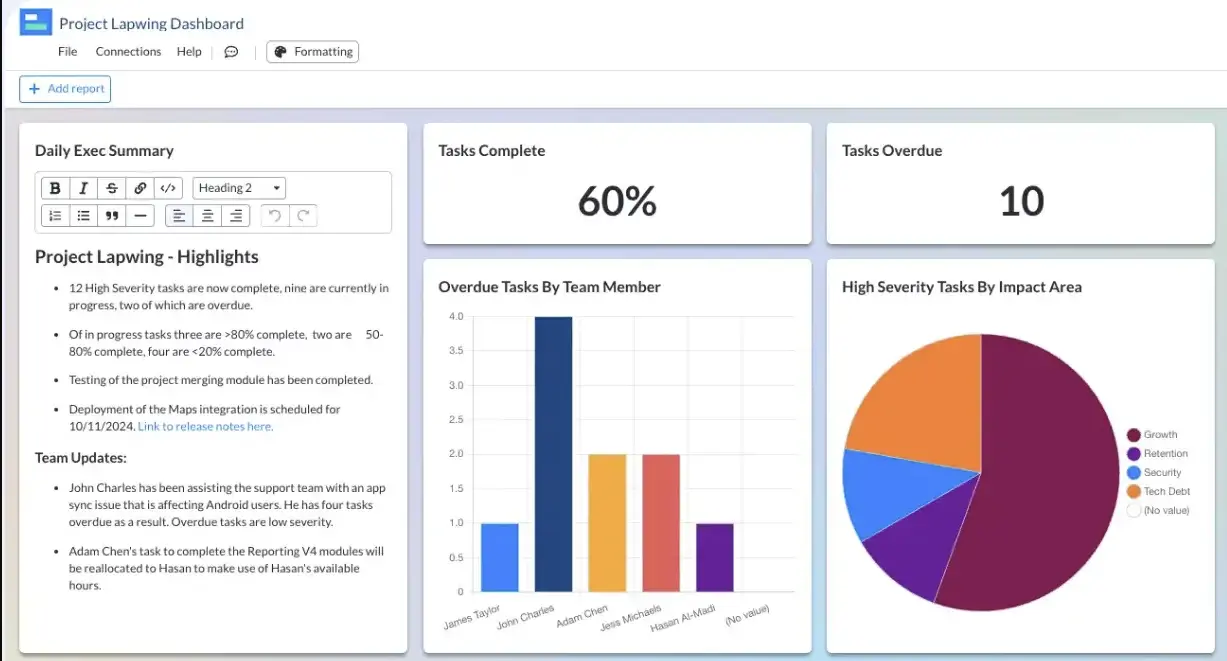
Example of a dashboard using live Jira data, created in Visor, to track progress and performance for a sub-team of a larger project team:
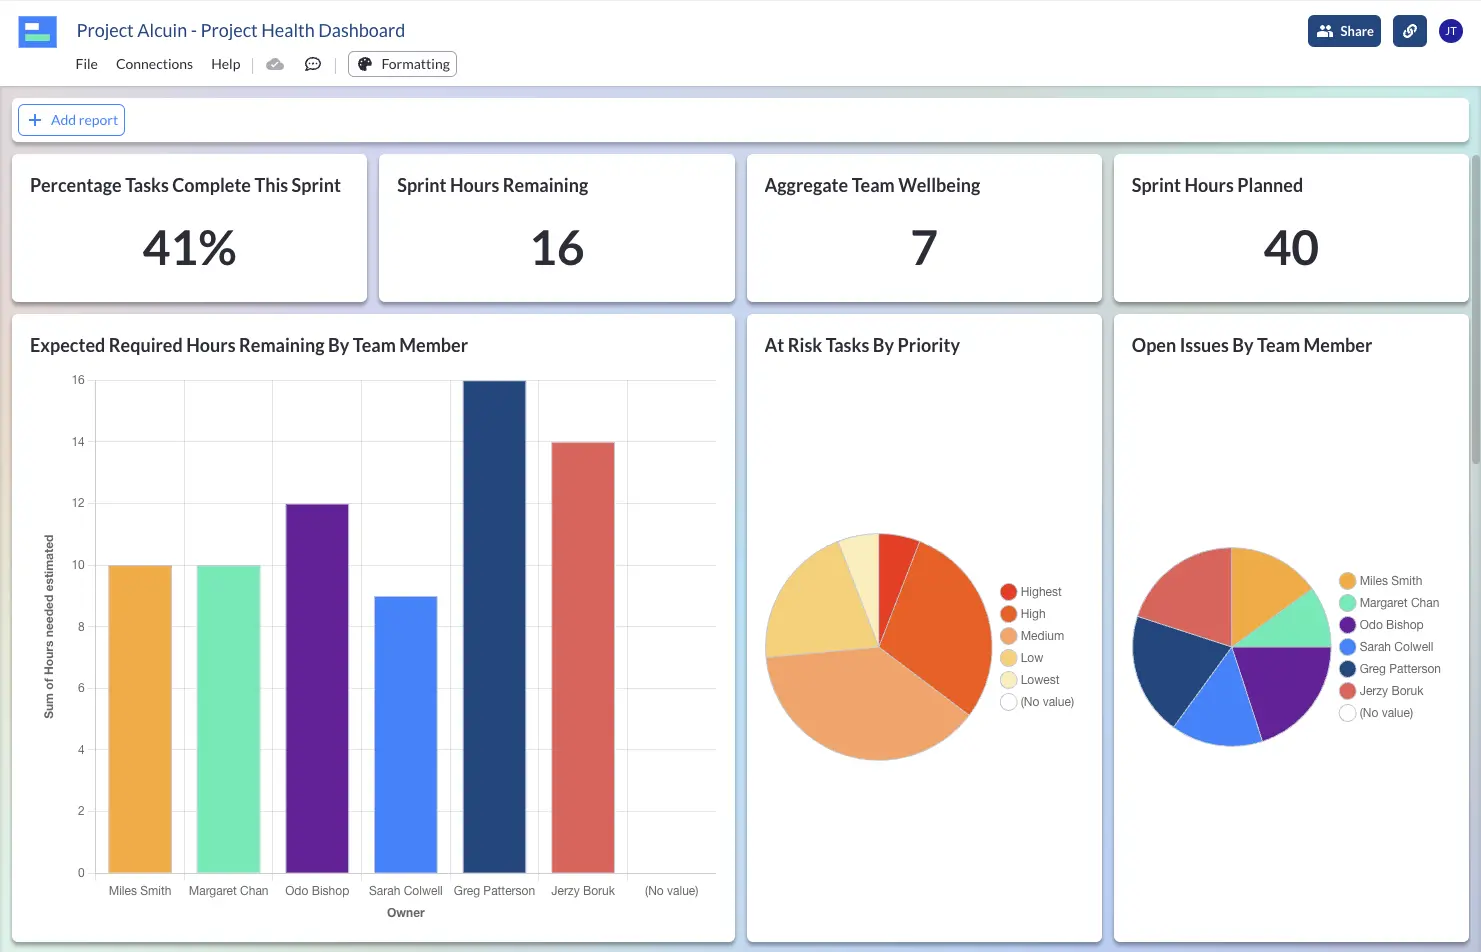
Multiple versions of this dashboard can be quickly and easily created for each team, using the same live data as the source to attain reporting consistency and help people zoom into their performance.
How To Share Jira Dashboards
If you’ve created your dashboard within Jira, you can share it by selecting the appropriate option (e.g., Project, Group, or My Organization) in the Viewers drop-down on the dashboard settings screen.
Unfortunately, you can’t share with stakeholders who don’t have Jira accounts, and there’s no option to provide guest access directly to Jira, which is a big drawback when you want to report to stakeholders or clients.
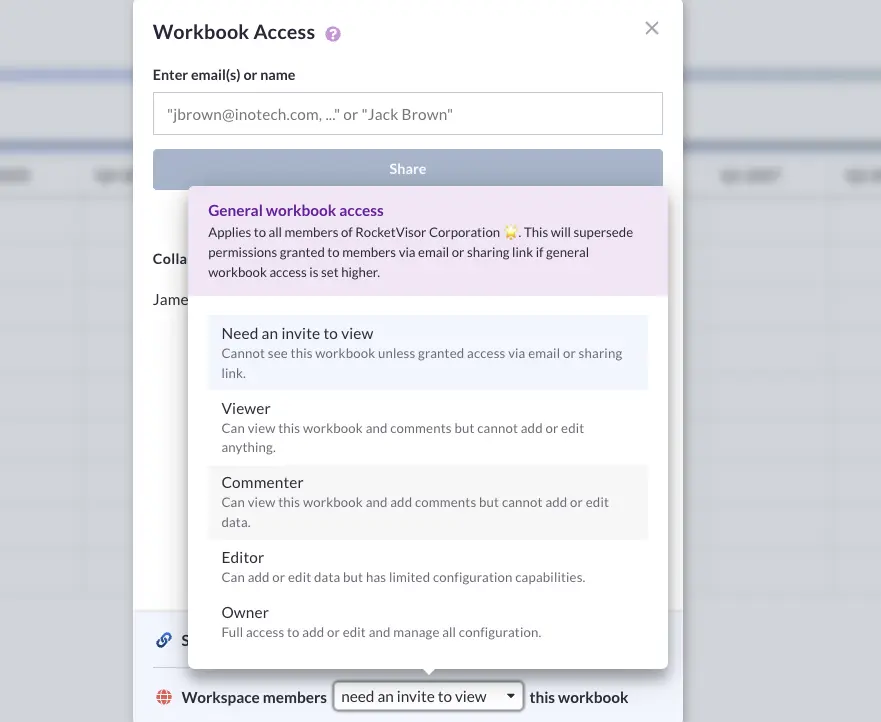
However, if you create a dashboard using real-time Jira data in Visor, you can share it with anyone. Visor offers a range of permission options to keep everyone informed without being overwhelmed. View-only licenses are free in Visor too, making it a far less expensive way to keep non-Jira using stakeholders updated.
Also, let’s be honest, Jira is not easy for new users to navigate. Visor keeps things simple and easy so the stakeholders you share with can engage with your dashboard without getting frustrated or disappointed.
The image below shows the control you get when sharing Jira dashboards in Visor:
Can You Create Jira Dashboards For Multiple Projects?
Yes, you can create Jira dashboards for multiple projects using Jira’s built-in dashboard functionality or Visor.
In Jira, this is possible by selecting the projects you want using the filter on your gadgets and choosing the projects you want to report on.
In Visor, you can import multiple projects using our JQL importer and create charts in your dashboard that combine or compare the data from them, for example, the total number of overdue tickets per project or the average age in stage by project.
For example, below is a dashboard I created in Visor for my portfolio of projects that are active currently.
Charts that combine the portfolio data with charts that compare projects:
Jira Dashboards: Powerful But Unwieldy Weapons
Jira dashboards are a vital part of managing projects and performance in Jira. While they can be challenging to use and share with stakeholders who don’t live in Jira, they are worth it.
Then, you have the inflated costs of paying for plugins to get additional and often necessary gadgets to complete your Jira dashboard.
A key part of creating dashboards is to report to people who don’t live inside Jira, whether that’s your CEO, customer support team, clients, or anyone else, with a reason and a right to be interested.
Visor offers a solution to these challenges. Visor is a popular Jira portfolio management tool that has a two-way integration with Jira, meaning you can create dashboards quickly and easily using real-time Jira data. You can add customization, including color coding, beyond what Jira’s built-in dashboards can offer. You can then share your dashboards with anyone for free.
To start, create a free Visor account and follow the tutorial above.
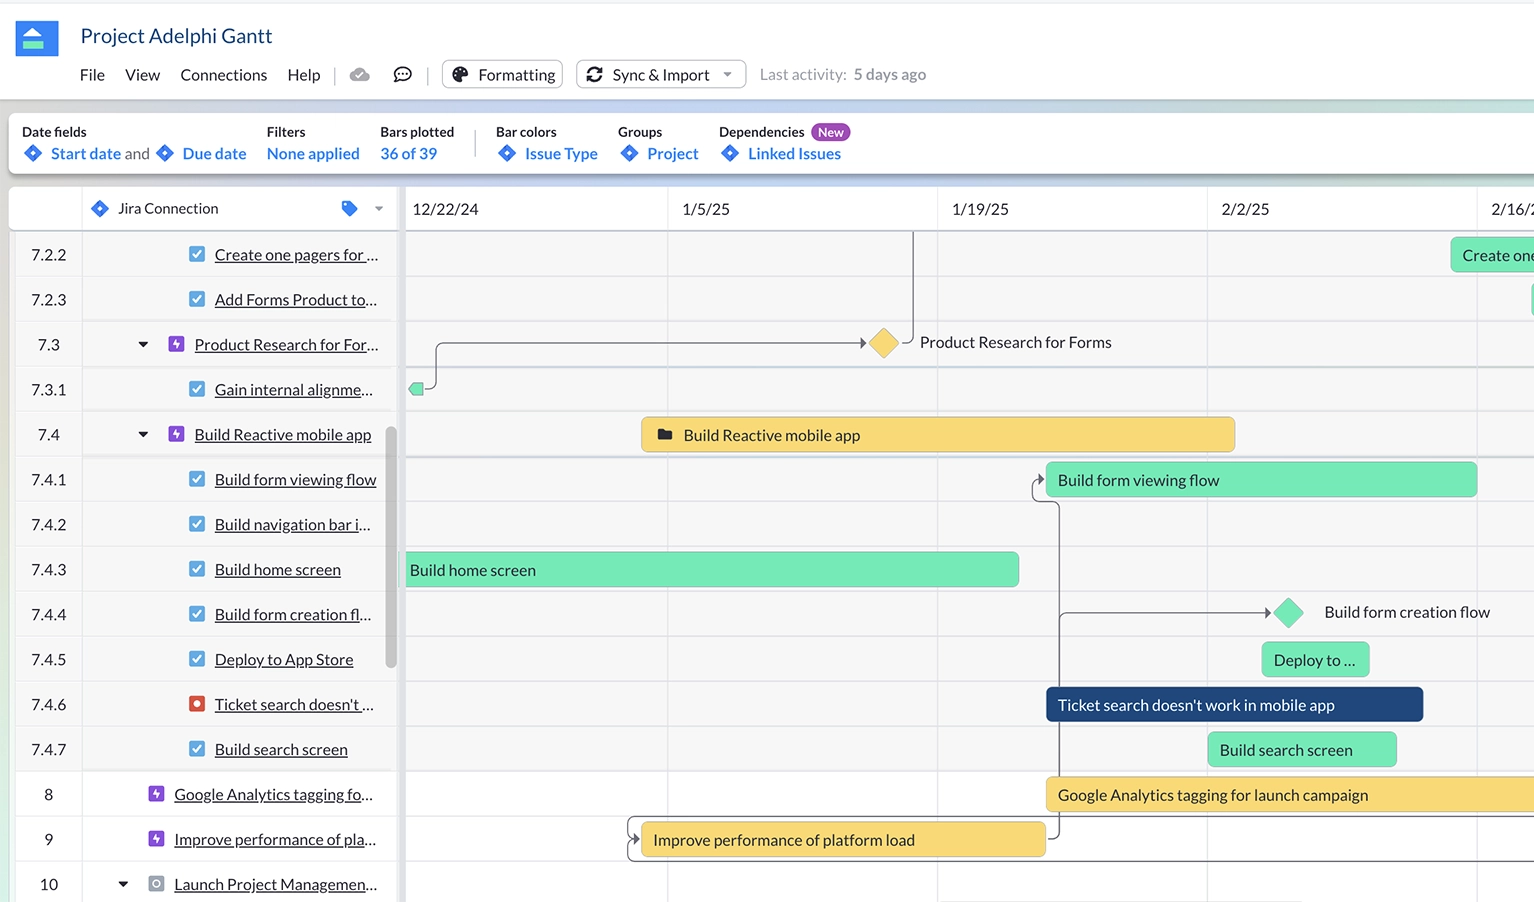
In addition to dashboards, you can also use Visor to create a range of other visualizations using Jira data, including Jira Gantt charts, Timeline charts, Kanban boards, spreadsheets, and much more.
Other Jira Visualization Options in Visor:
Visor offers tons of Jira-friendly templates, such as sprint backlog, along with templates for simple Gantt charts or more complex project portfolio management templates.