
How to Create a Jira Spreadsheet: A Complete Guide
While Jira offers a List view, this feature does not have a lot of functionality that Jira users seek in a spreadsheet. This lack of a full-blown spreadsheet can stop many PMs from completing some basic tasks when using Jira to manage projects.
Many teams, prefer a spreadsheet view to organize, filter, and share their Jira project data. If you need to know how to create a Jira spreadsheet, you’ve come to the right place!
In this post, we’ll show you a few different ways to create a Jira spreadsheet view, including:
- Creating a basic spreadsheet in Jira using JQL
- Using Visor for a bi-directional spreadsheet solution that’s always in sync with Jira
- Setting up plugins for Excel and Google Sheets
Looking for an easier, more eye-catching way to share your Jira data with stakeholders? Give Visor a try (for free)!
Does Jira have spreadsheets?
The short answer to this question is: sort of.
Jira doesn’t have native, full-featured spreadsheet functionality like Excel or Google Sheets. However, it does offer a basic, no frills List view. Alternatively, you can integrate with external tools to provide a spreadsheet-like experience.
If you want something that works like a colorful, customizable spreadsheet using your Jira data, you don’t need to go much further than Visor – a Jira-integrated project portfolio management tool that can help you make the Jira data spreadsheet you need.
A Jira-integrated spreadsheet in Visor

If you’d like to find a different workaround for creating a Jira spreadsheet, let’s take a look at your options.
Jira Spreadsheet Option #1: Using Jira’s Built-In Features for a Spreadsheet View
Jira has a sort of light native spreadsheet view with filters that display your projects or issues in a spreadsheet-ish format.
A head’s up – this is not a feature-rich spreadsheet. It allows for sorting, filtering, and exporting data, but lacks the advanced functionalities like formulas, inline editing across rows and columns, or real-time collaboration that you would expect from traditional spreadsheet software.
If you’re still interested, here’s how to set up the spreadsheet-like view in Jira.
Step 1: Create a New Filter
Navigate to Filters in the Jira menu and select View All Issues or whichever set of issues you’d like to filter.
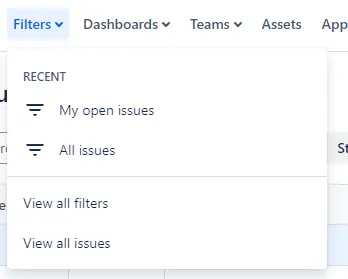
Once you’ve done that, you’ll see a spreadsheet-like space where there are several dropdown menus for filters listed up top. Select the filters you would like. If you don’t see the filter you want, select More + to see additional options.

Step 2: Customize Columns
Once you have filtered your data, you can customize the columns to include fields that matter to your team. Simply select the three-dot menu (⋮) located next to the column you would like to adjust. A menu with options for sorting spreadsheet content, moving columns, removing columns, or resizing them.
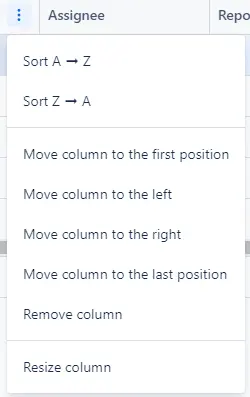
This offers a basic way to view a spreadsheet in Jira, though as mentioned there are limitations that make it less than ideal if you want more advanced functionality. Jira isn’t really spreadsheet friendly, so if you want to foster collaboration or just want to make your Jira data look pretty, you won’t be able to do that in Jira.
Luckily, if you need more advanced spreadsheet and visualization options, there are plenty of alternatives.
See how Visor compares to Jira’s List view in this review from Alex Ortiz:
Jira Spreadsheet Option #2: Using Visor for a Better Spreadsheet View
Need a spreadsheet that’s easy to customize and share with stakeholders? Visor might be more your speed. Visor offers a seamless, two-way integration with Jira that lets you create eye-catching, customizable spreadsheets.
There’s more flexibility, the spreadsheets look better, and Visor opens up the option to share your Jira data with teammates, stakeholders, and contractors that don’t have a Jira account. Not convinced yet? Here are a few more key reasons why you should give Visor a try:
Why Visor Is a Good Jira Spreadsheet Solution
There are a few important reasons why you should go with Visor if you want a Jira spreadsheet:
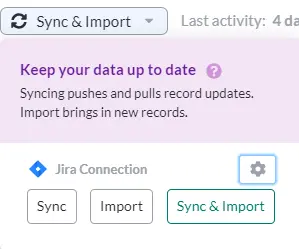
- You get a two-way sync with Jira. Visor has a bidirectional sync with Jira, ensuring your data is always up-to-date (something you won’t necessarily get with Excel or Google Docs).
Sync & Import options in Visor
- There are more customization options. You can set up your Visor spreadsheets and other charts however you like – and that includes bringing in whatever colors you want to fit your brand or aesthetic.
Jira Spreadsheets in Visor with custom colors:
1. A Jira Spreadsheet for Project Portfolio Management:
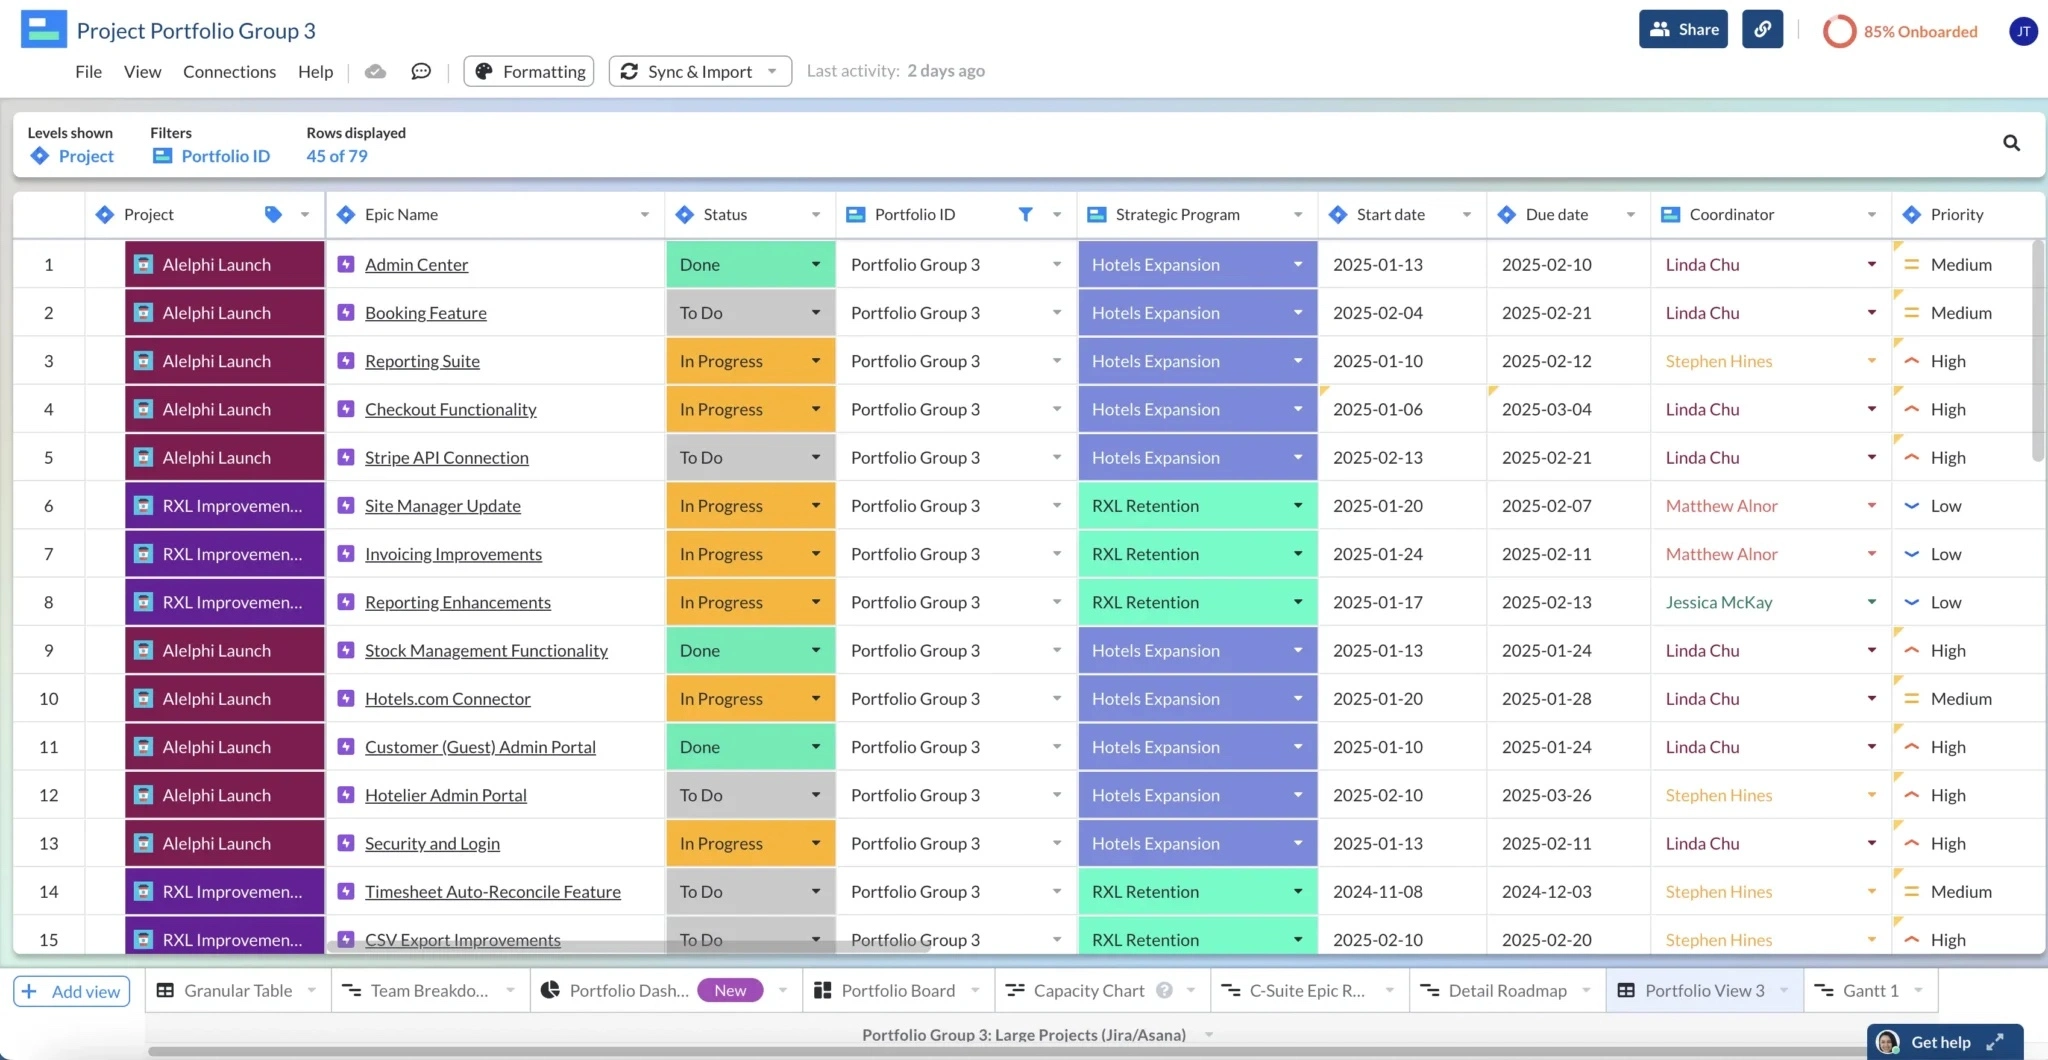
2. A Jira Spreadsheet in Visor, used for internal security compliance:
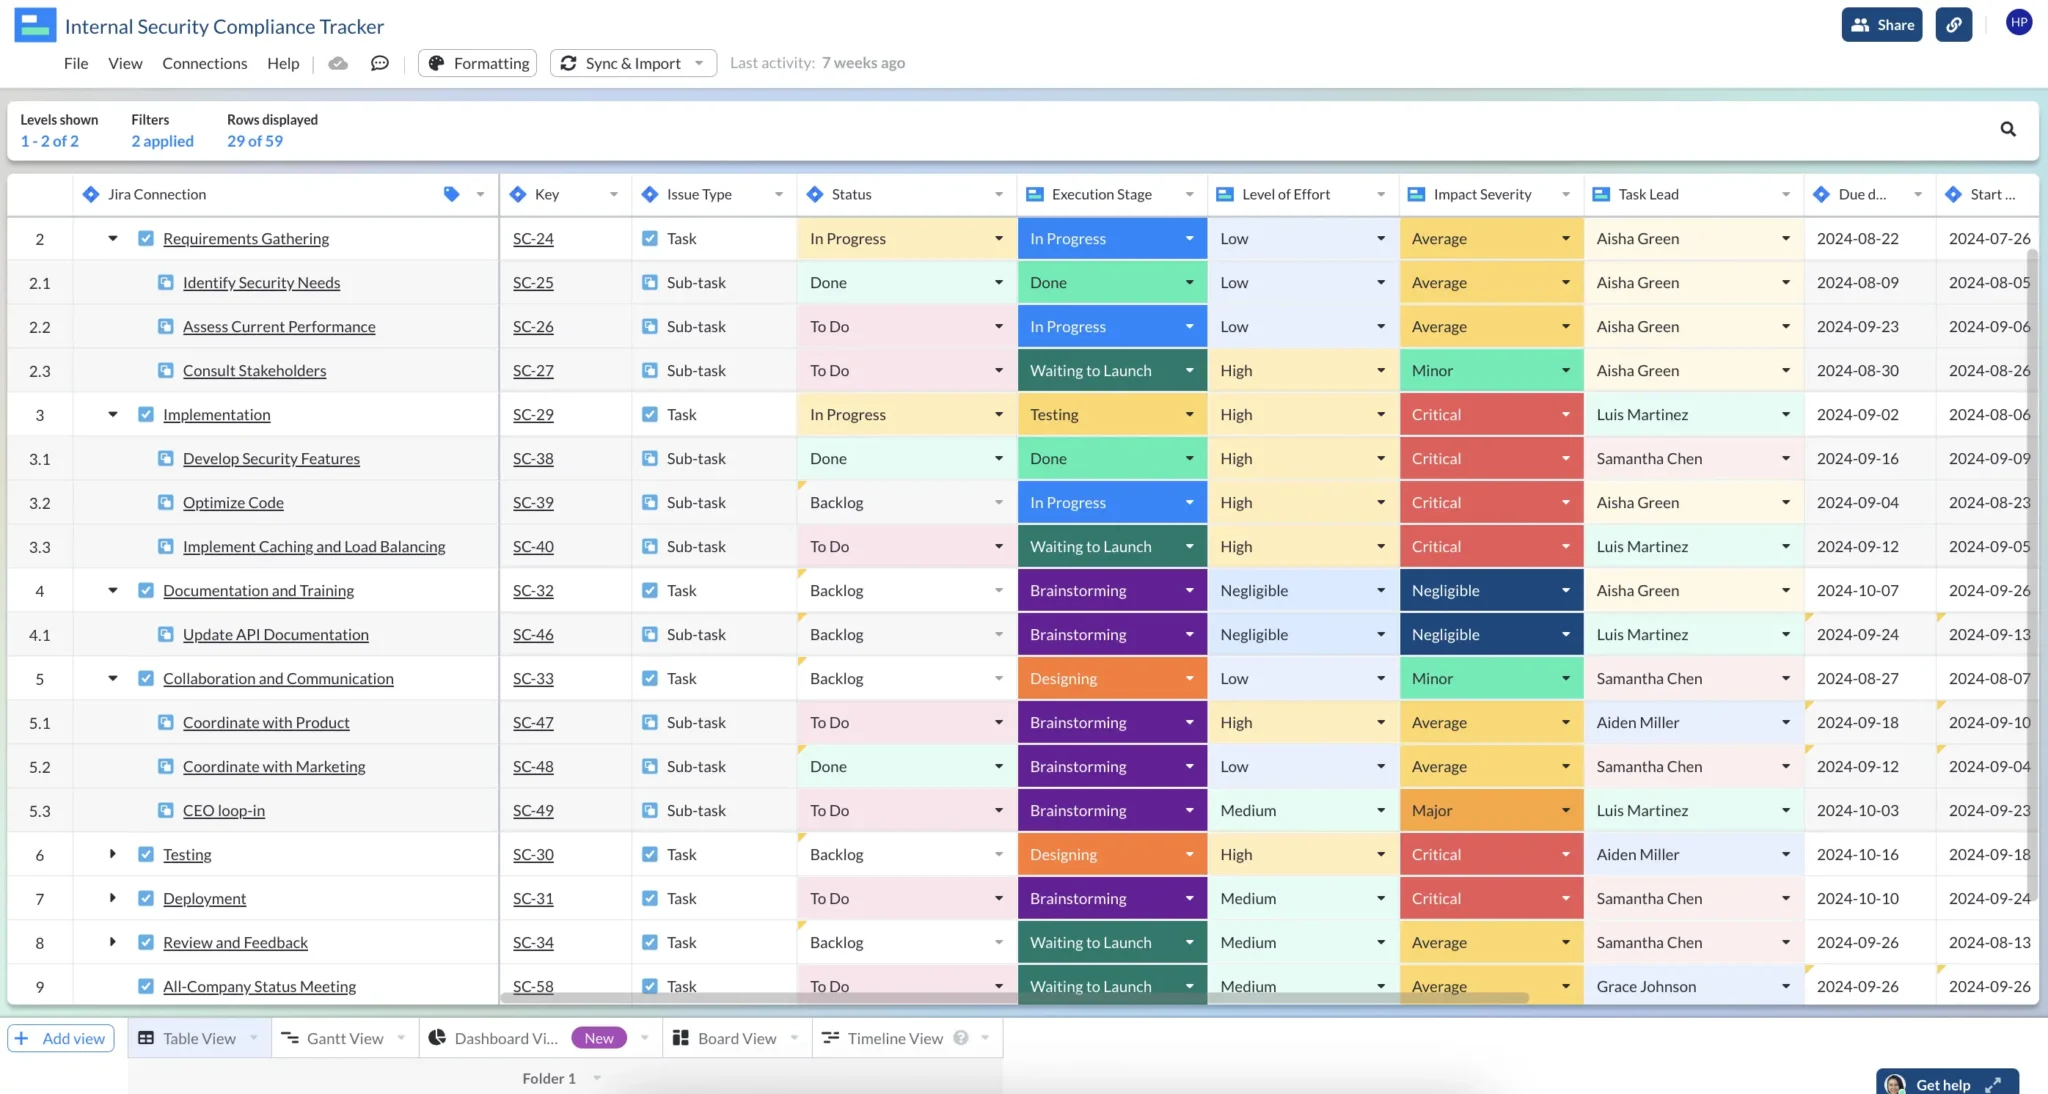
- It’s easier to share with stakeholders. You can create custom Views in Visor designed for specific users or groups so that stakeholders only see the data they need. Visor is also a lot easier to figure out than Jira, which means stakeholders are more likely to check out the spreadsheets you create on a regular basis.
- You can share data from multiple applications. Does Marketing use Asana and DevOps uses Jira? Blend the data from both sources in Visor, creating spreadsheets that give a more complete snapshot into what everyone is up to.
How to Use Visor for Jira:
If you’re ready to give Visor a try (for free!), then here’s how to do it:
Step 1: Open Jira Data in Visor
It’s easy to create a Jira spreadsheet in Visor. Simply select the + New Workbook button on the upper-righthand corner of your screen.
A popup will appear asking if you would like to pull data from Jira. Select Include Jira Data to pull in information from Jira.
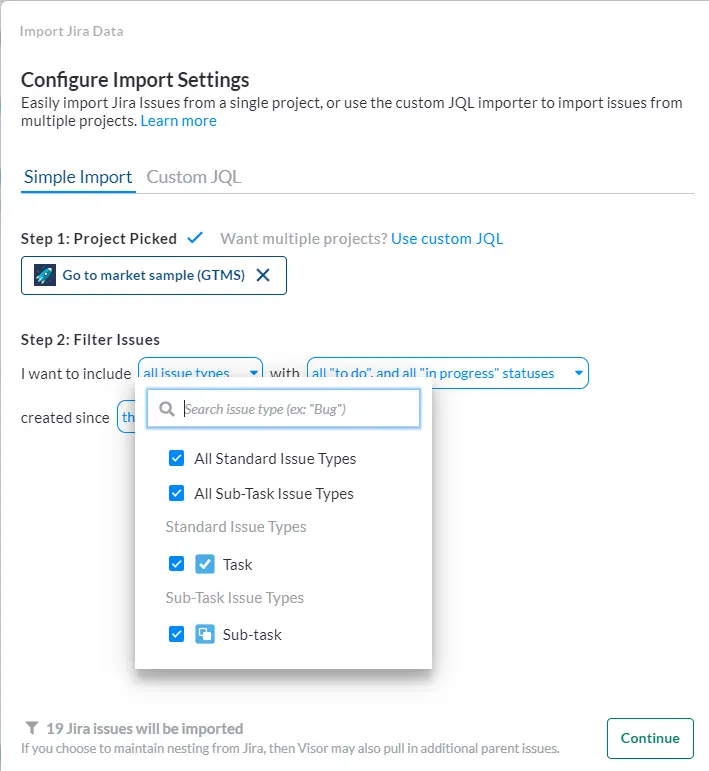
Next you’ll be asked to configure your import settings. If you’re doing a simple import, you can pull in any of the projects in your connected Jira account. Alternatively, you can import multiple projects using JQL.
After you select a project, you can filter what’s included in the import, including what issue types, statuses, and dates you’d like to send over.
Import Jira data to Visor:
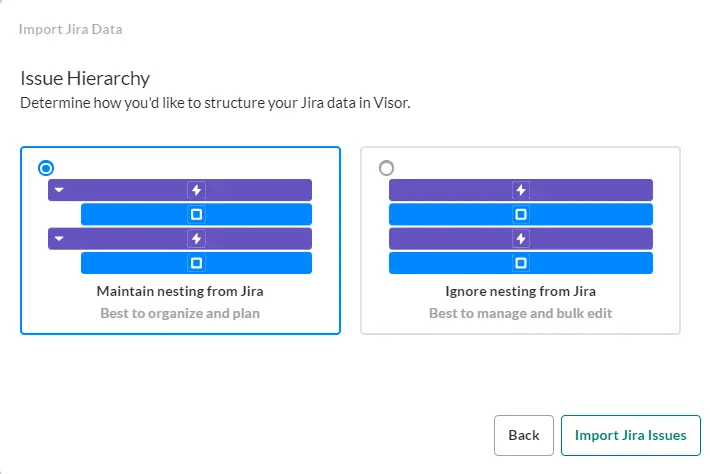
You can also choose how issues will display in Visor – for instance whether you will preserve the issue hierarchy you have in Jira.
Choose how you’d like to structure Jira data in Visor
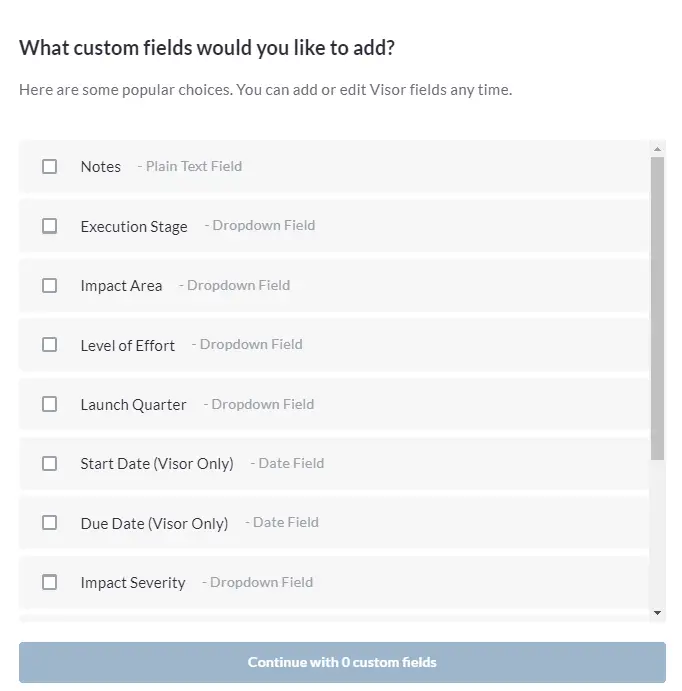
Finally, you can select which custom fields you’d like to add to your spreadsheet in Visor. Simply check any fields you’d like to include or add new ones.
Set up custom fields in Visor
Step 2: Customize Your Jira Spreadsheet in Visor
Once your Jira data is imported, you can quickly customize the look of your spreadsheet to fit your needs.
You can find column controls by selecting the downward carrot icon to the right of each column. This allows you to change sorting options, access color choices, filter the field, and more.
Spreadsheet customization options in Visor
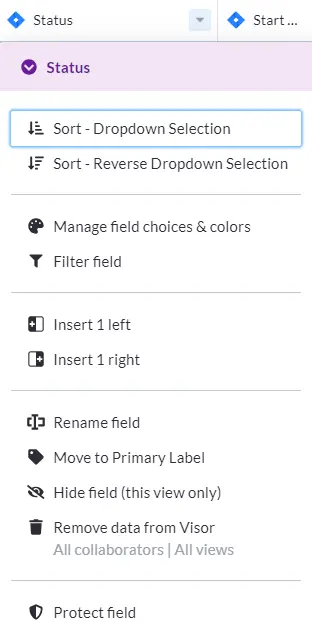
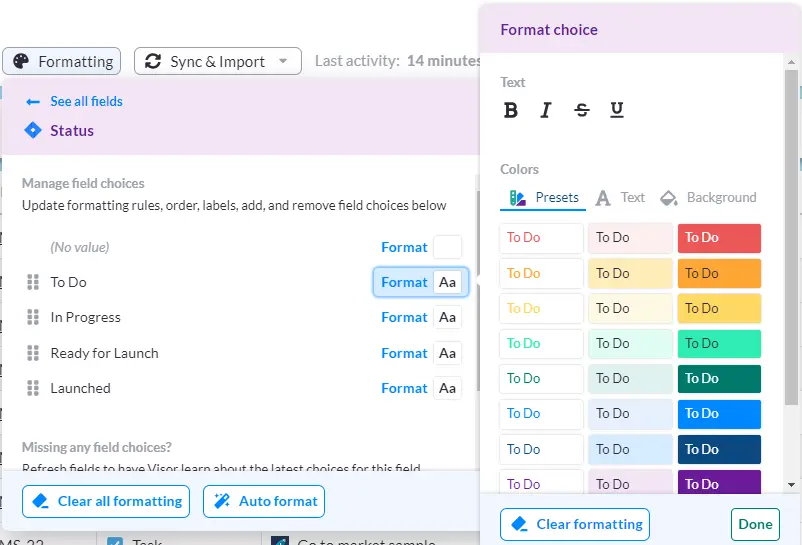
You also have the option to select colors for different columns or field types in Visor. Colors can be chosen from a set of preset options or customized based on hex codes.
Color formatting options in Visor
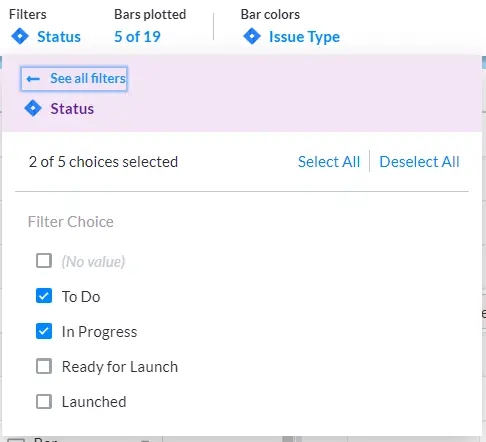
You can also create new views in Visor in seconds. Simply click + Add View to start creating Jira Gantt charts with Milestones, Timelines, Board Views, and Dashboards for your Jira data. You can even create separate unlimited Views for different types of users, including Filters that show the parts of your data that are relevant for a specific group of stakeholders.
Spreadsheet filters in Visor
Once you’re set up, you can invite stakeholders to collaborate on your Jira projects in Visor, allowing them access, even if they can’t or won’t work in Jira.
Jira Spreadsheet Option #3: Using Google Sheets Integration for Jira
If your team is already familiar with Google Sheets, the Google Sheets Integration for Jira might work for you, as an option to create a Jira spreadsheet.
However, unlike using Visor, your spreadsheet view in Google Sheets won’t keep your Jira hierarchy and nesting, which means a ton of extra manual admin work to piece your data back together (child issues and tasks under parent issues and so on).
How Google Sheets Integration Works
The integration allows you to automatically sync Jira issues with a Google Sheets document, so you can collaborate with your team in real-time on a familiar interface.
Changes made in Google Sheets (e.g., updating a field or adding a comment) can be synced back to Jira, making it a two-way data flow.
How to Sync Google Sheets and Jira
The process here is pretty easy. Check out our video below, or if you want to read all about it, check out our blog post on integrating Google Sheets and Jira.
You can create visualizations in Google Sheets like Gantt charts. They do require configuration and a certain level of spreadsheet mastery. Visor’s spreadsheet-inspired workspace requires less manual setup and is a good alternative to Google Sheets for Jira users.
Jira Spreadsheet Option #4: Exporting Jira to Excel
Exporting Jira data to Excel is a straightforward process. Jira provides a built-in option to export your project data into an Excel-compatible format (CSV). Here’s how you can do it:
Step 1: Open the Issues You Want to Export
Go to Filters in the Jira menu and select View All Issues or choose an existing set of issues you’d like to view.
If you want to export specific issues, you can use JQL (Jira Query Language) or the basic search filters (such as project, assignee, status) to narrow down the list of issues. For example, if you want to export only open issues, you can filter based on that condition. See the section on Jira’s built-in spreadsheet capabilities for more detail.
Step 2: Export to Excel or CSV
Jira lets you to export your Jira spreadsheet in several different formats, including Excel or CSV files
Click on the Export menu (located in the top-right corner) and select your preferred file format (e.g. an Excel XLSX file or a CSV file for spreadsheets).
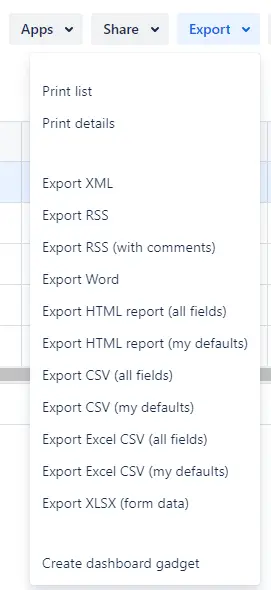
Your filtered issues will now be available in a downloadable spreadsheet format, which you can then import into Excel.
Step 3: Open in Excel
After downloading the XLSX or CSV file, import it into Excel. From there, you can manipulate, format, and analyze your Jira data using Excel’s features like pivot tables, filters, and charts.
Additional Option: Prep Your Jira Spreadsheet Data in Visor
When you import data from Jira to Excel, you may get more than you bargained for. Take a look at our video on how you can get your Jira data ready for Excel using Visor:
Finding Your Jira Spreadsheet Solution
While Jira lacks a native, full-featured spreadsheet view, you have plenty of options to create one based on your team’s needs. Whether you want to use spreadsheets to create a Customer Onboarding Template that you can share with external clients or a Mutual Action Plan template to help your team work more efficiently, you’ll likely have to find a solution outside of Jira.
Visor is one such solution, which allows you to import and push out Jira data for more advanced analysis, you can easily organize and share your project data in a spreadsheet format. Visor also works well for Jira guest access, allowing you to share your Jira data externally.
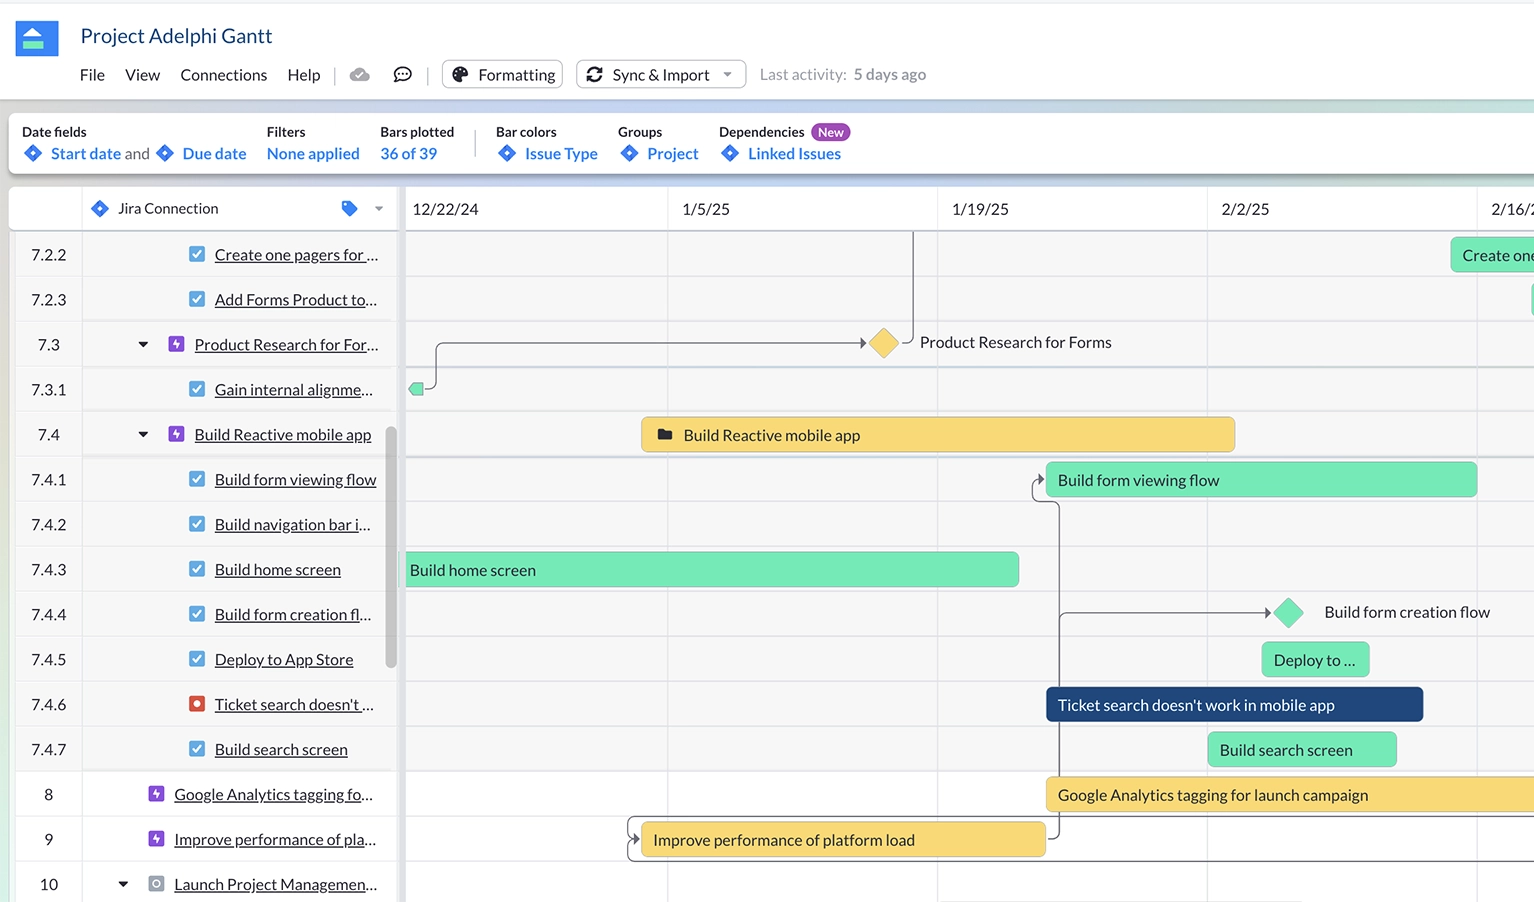
In addition, Visor’s various views, like our Gantt Chart Template, allow you to create Agile Gantt charts with Jira data.
If you’re looking for an intuitive, powerful solution, we recommend trying Visor. Its customization options, two-way sync with Jira, and ease of use make it the go-to choice for teams that want a seamless spreadsheet experience without the limitations of Jira’s built-in features. Try it for free and see how it can elevate your project management workflows!


