How To Set Up a Gantt Chart For Multiple Projects

Start using Visor today
- Visualize all your projects and data

- Roll up multiple projects into portfolio views
- Try Visor for FREE
Creating a Gantt chart for multiple projects is essential for gaining a bird’s-eye view of how different projects overlap and interconnect and for managing project portfolios.
Combining multiple projects into a single Gantt chart is also a great way to ensure your team’s time and resources are optimally scheduled and balanced across different projects.
However, correctly using a multi-project Gantt chart isn’t as simple as putting all your projects together on the same Gantt chart. To make your multi project Gantt usable and effective, you need to know the following:
- How best to organize and group your projects on the Gantt chart
- The “levels” of the work breakdown structure to show or nest (such as projects, tasks, subtasks)
- How to automatically summarize project details (such as hours, cost, percentage complete, and other roll up metrics)
- How to manage cross-project dependencies
This blog gives you all the practical steps and tips you need to easily create highly effective Gantt charts that include multiple projects.
Visor is a modern, easy-to-use project portfolio management tool that helps you plan, manage, and track all of your projects, including those in apps like Jira and Asana. You can even get started with our free project portfolio management templates, which will help you create Gantt charts and other views with multiple projects faster and easier.
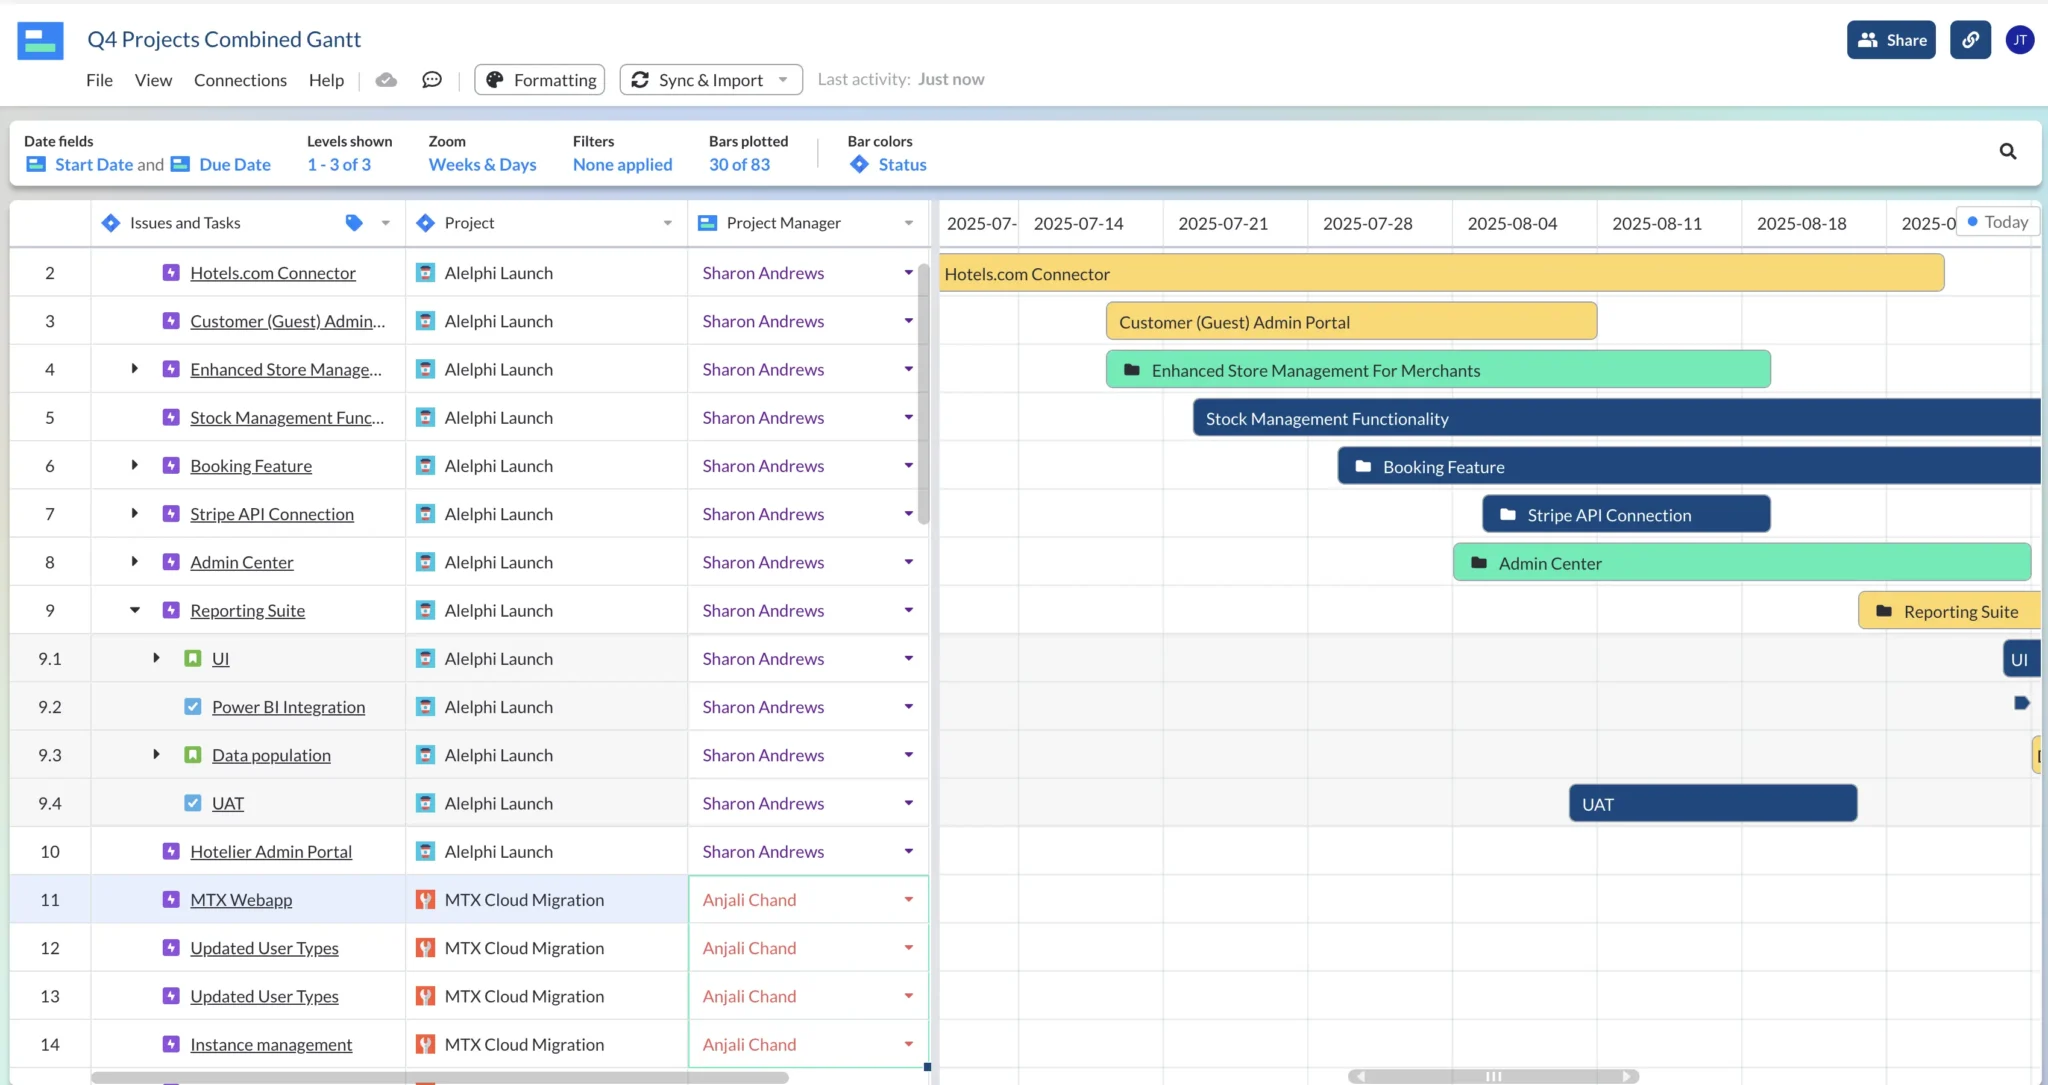
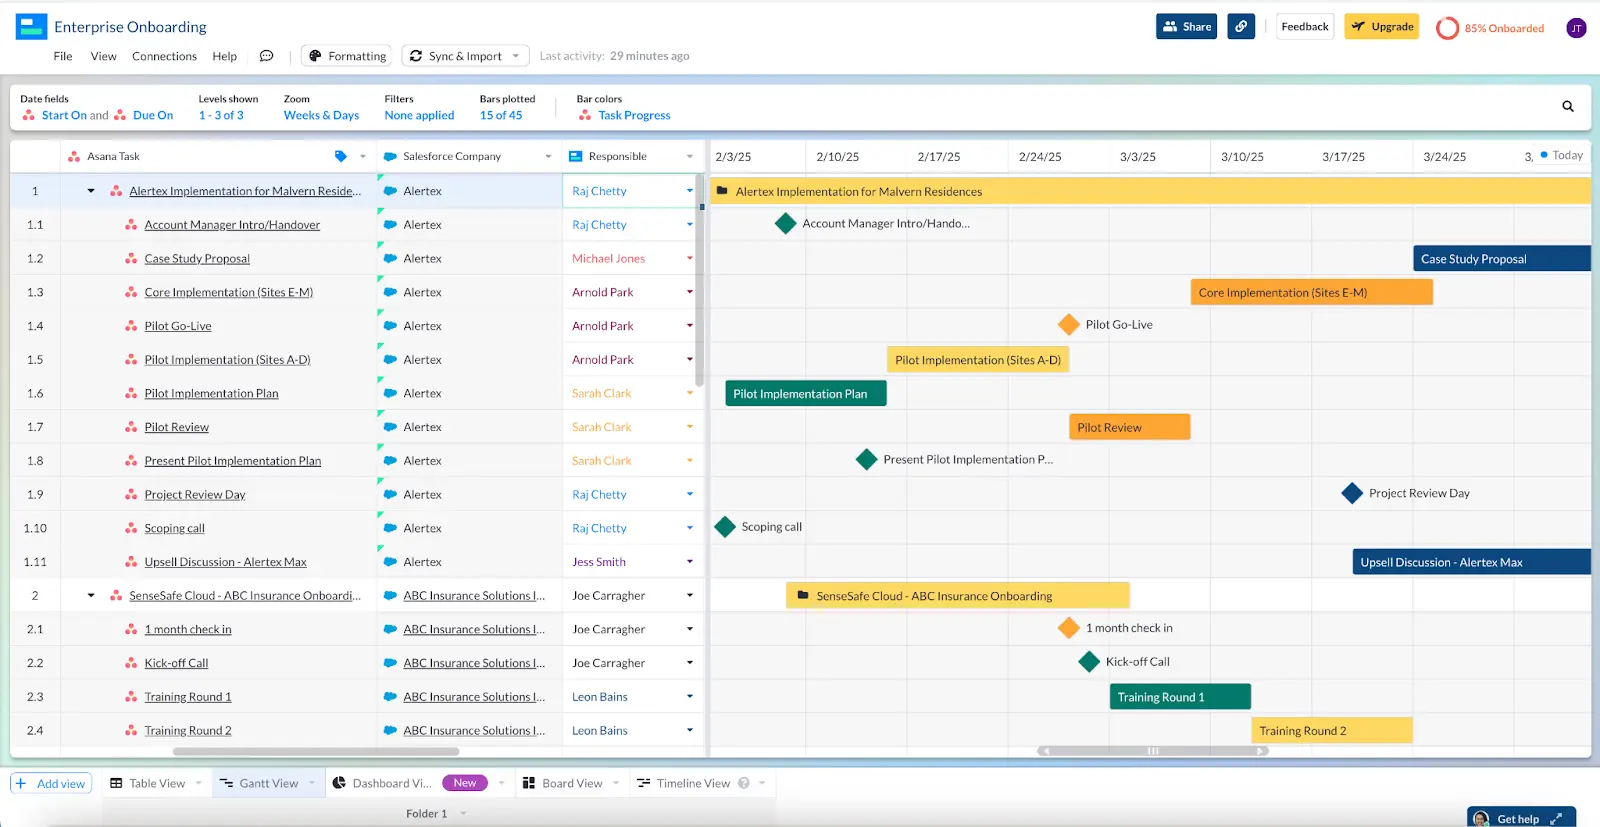
Here’s a Gantt chart with multiple projects I created using Visor’s Portfolio Gantt Chart View.
How To Create a Gantt Chart For Multiple Projects in Visor
Method #1: Use a Visor Gantt Template
If you want to configure a Gantt with multiple projects in Visor, check out the steps below.
However, you can also get started faster with Visor’s project Gantt chart template (or even our roadmap templates for product releases or projects), you can import or input data from multiple projects.
Method #2: Configure a Gantt Chart in Visor
Step 1: Get Your Free Visor Account
Set up your Visor account (all you need is an email – not a credit card!) You get a free trial of Visor’s Team plan, which gives you the chance to try out all of Visor’s premium features completely free.
Step 2: Add/Import Your Projects
If you want to import projects from Jira, Asana, Salesforce, or other apps, you can do that during the setup or later on. There’s more information on the steps to import projects into Visor from different apps in sections below.
Step 3: Start Creating Your Gantt Chart
Select the Gantt View tab in your Visor workbook or click “Add view” and select the Gantt view
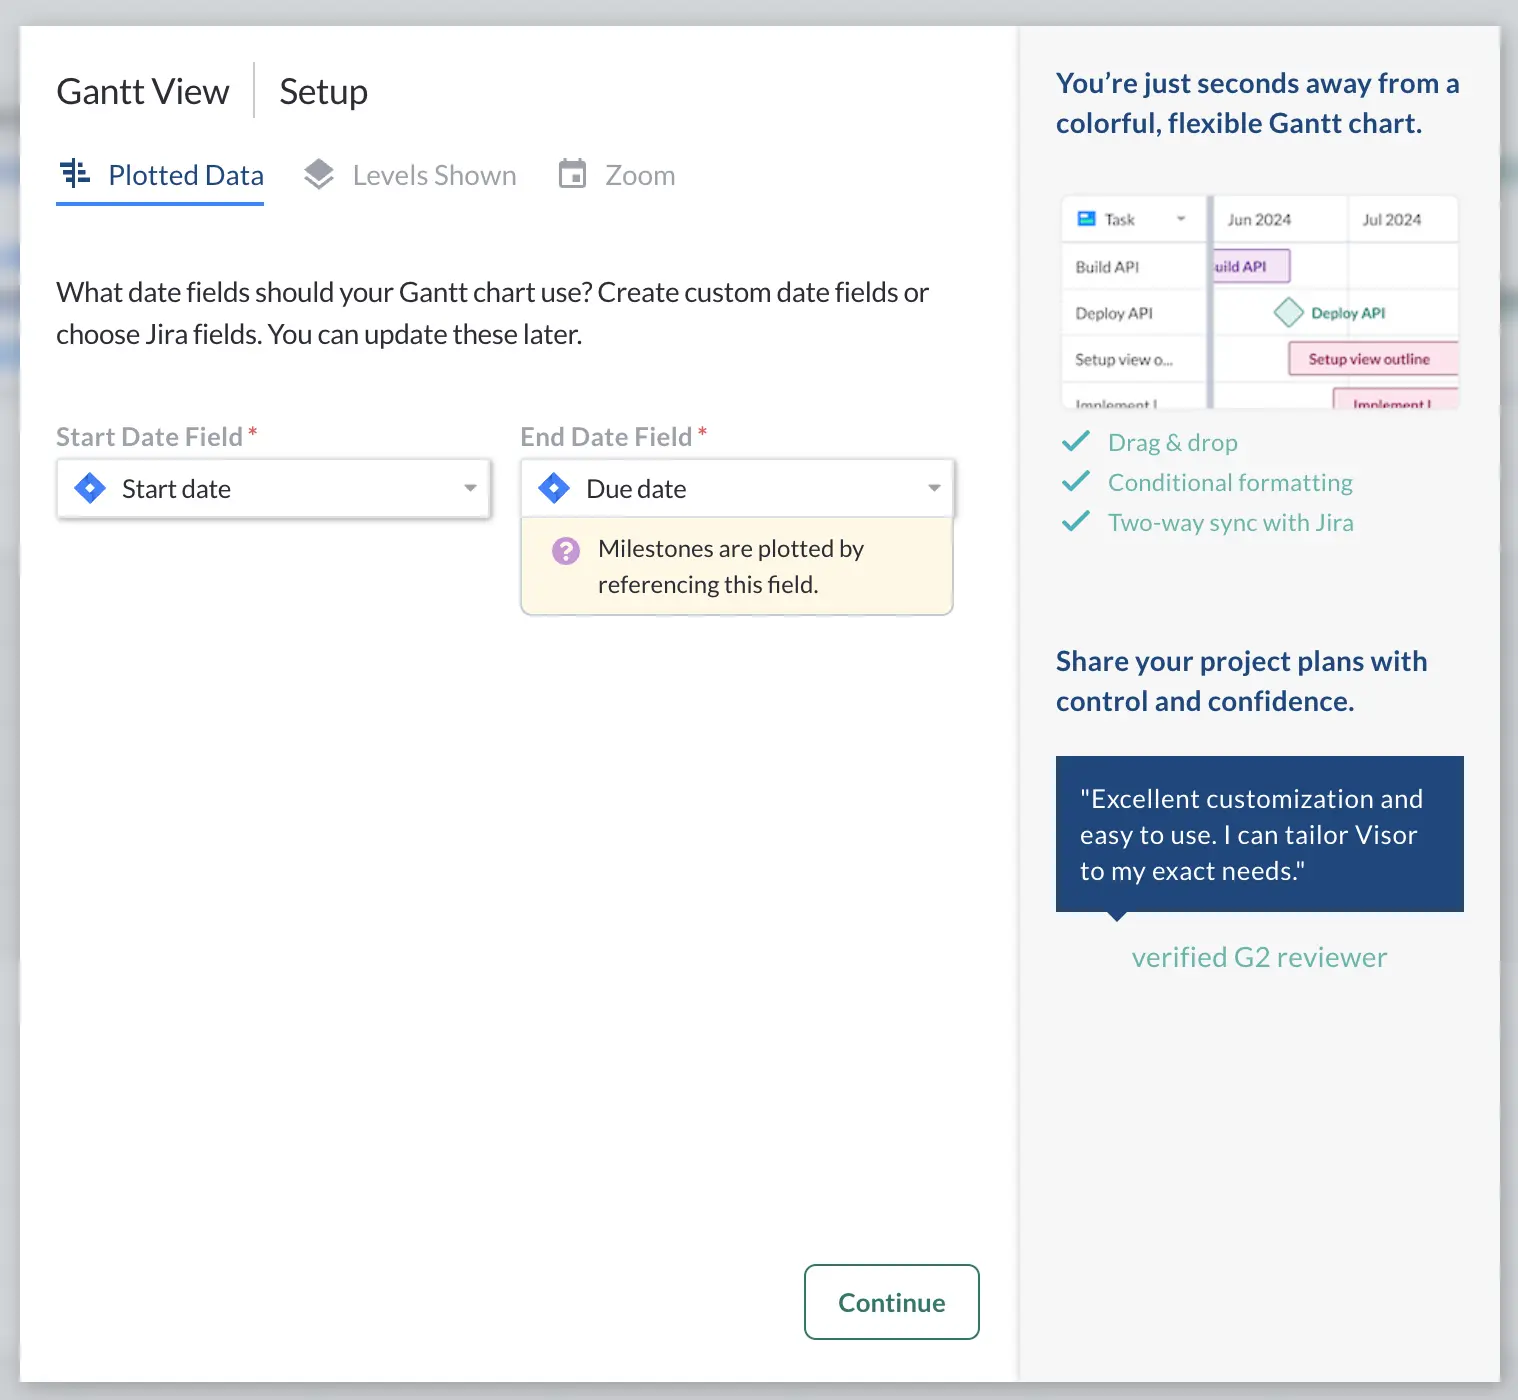
Step 4: Select Your Scheduling Fields
Select the start and end date fields to use for your Gantt chart bars:
Step 5: Set Which Task Levels You Want To Show:
Select the levels of issues or tasks you want to show, for example do you want to show just epics, or epics and tasks, or epics, tasks, and subtasks? Levels Shown determines how granular or high-level your Gantt chart is.
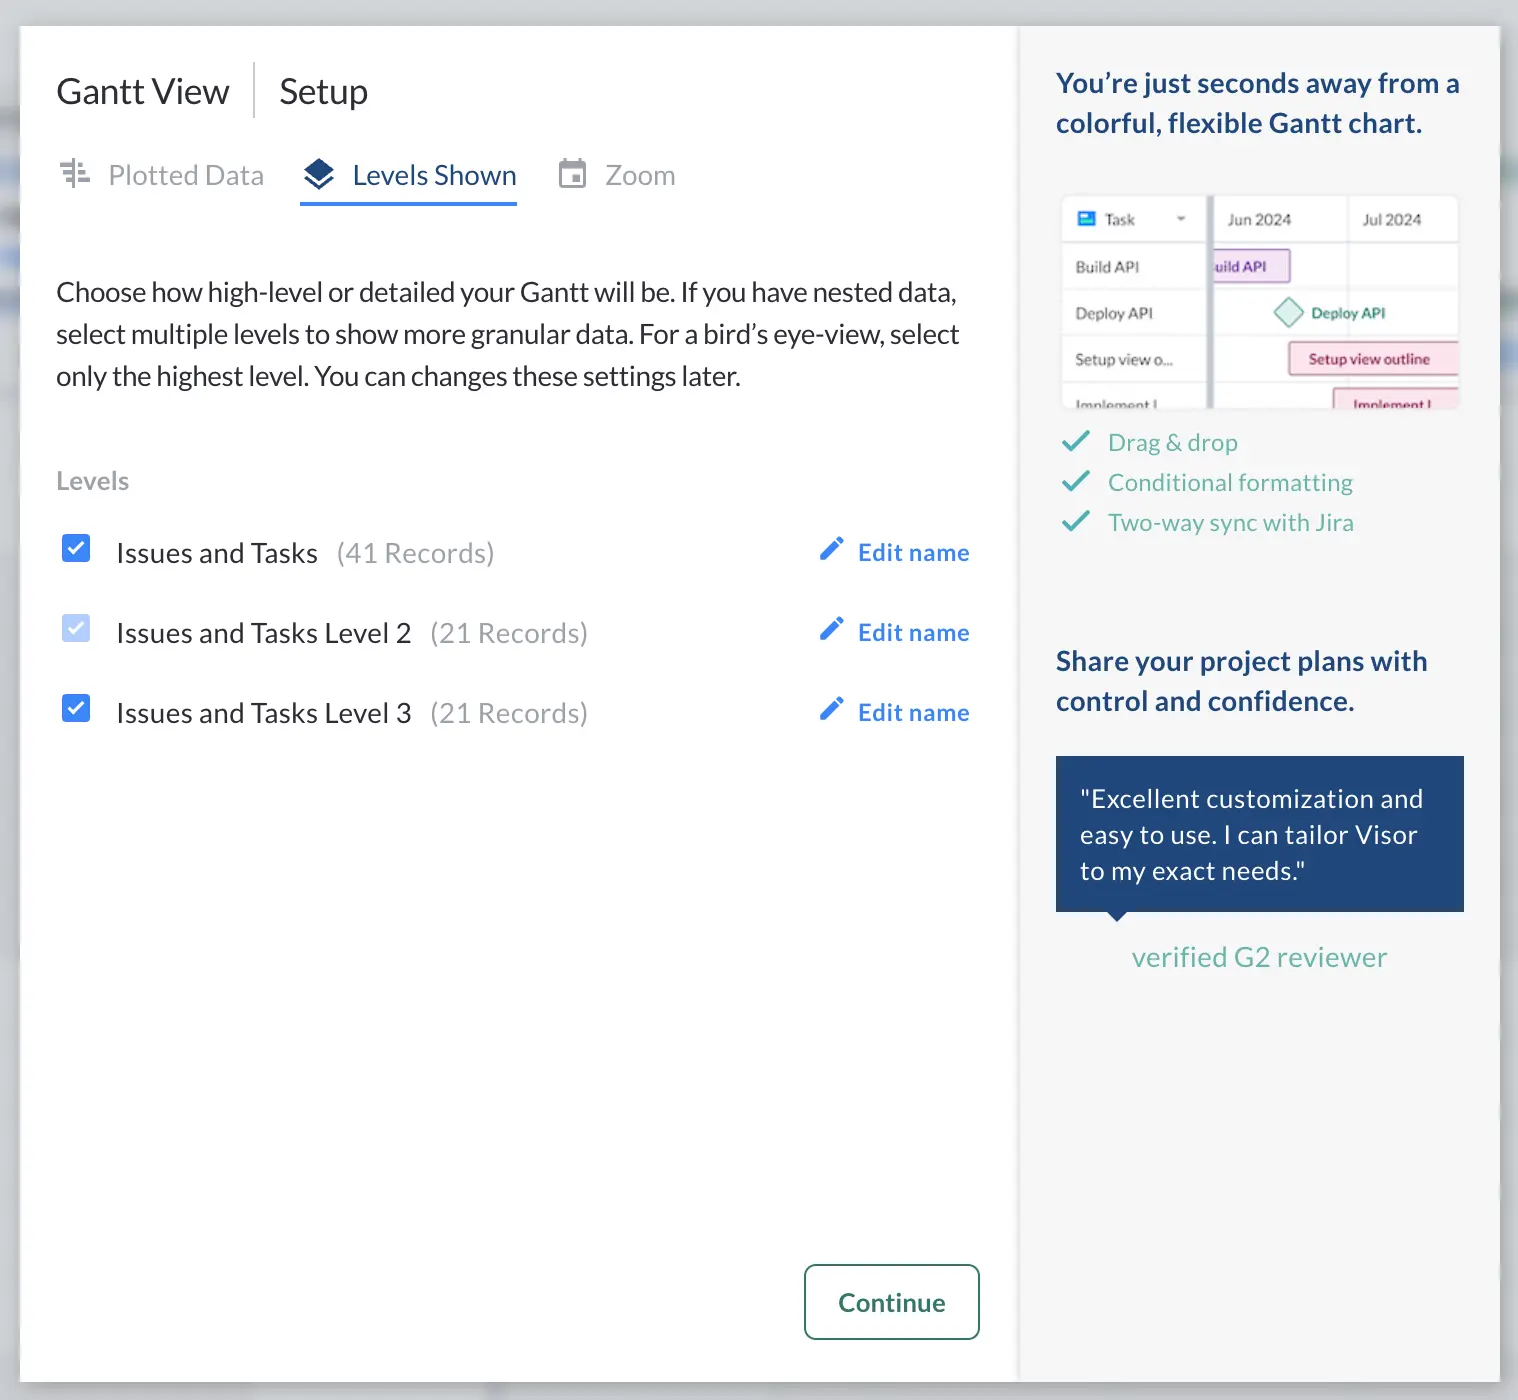
You can change these settings at any time, and create multiple views of your Gantt chart with different Levels Shown to give you a mix of high-level and granular Gantt views.
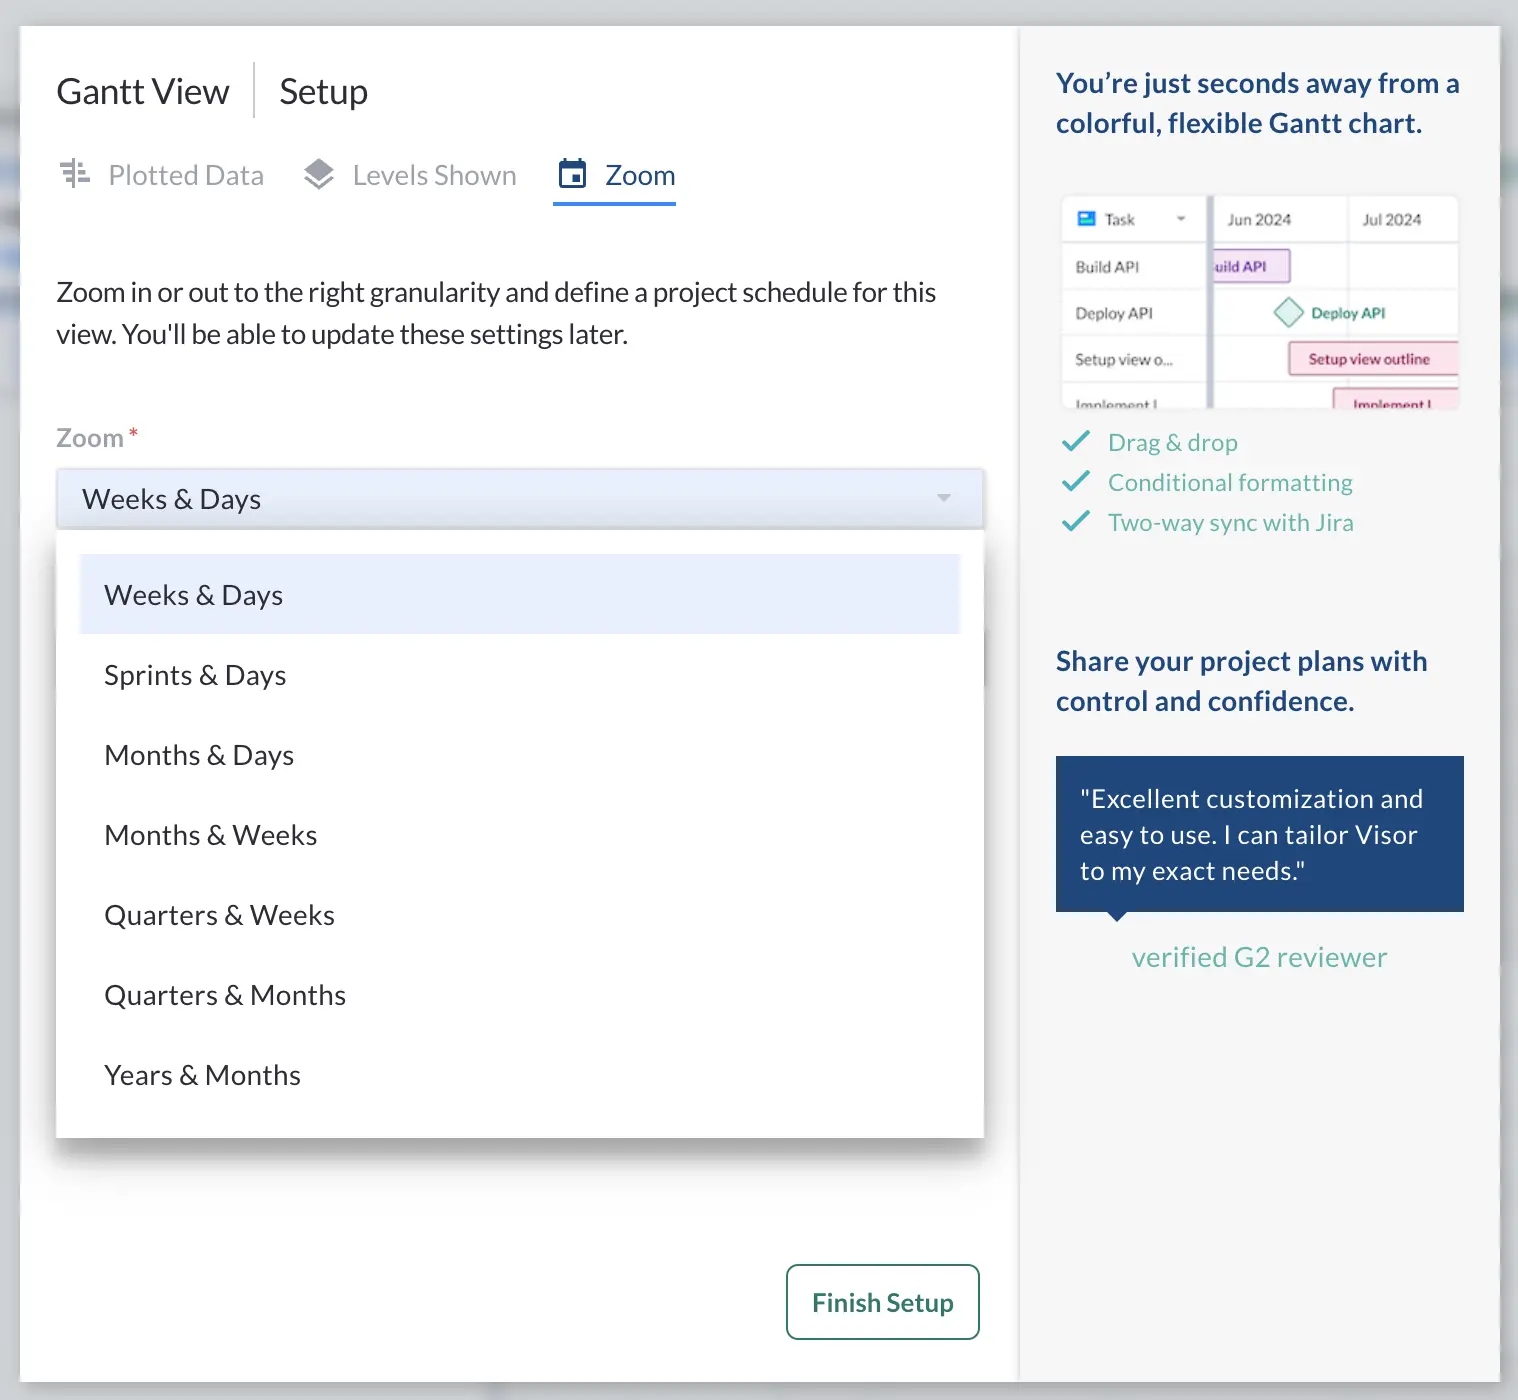
Step 6: Set The Timescale/Zoom
Next select the “Zoom”. This is the timescale shown on your Gantt chart. Do you want a monthly view, or something more detailed?
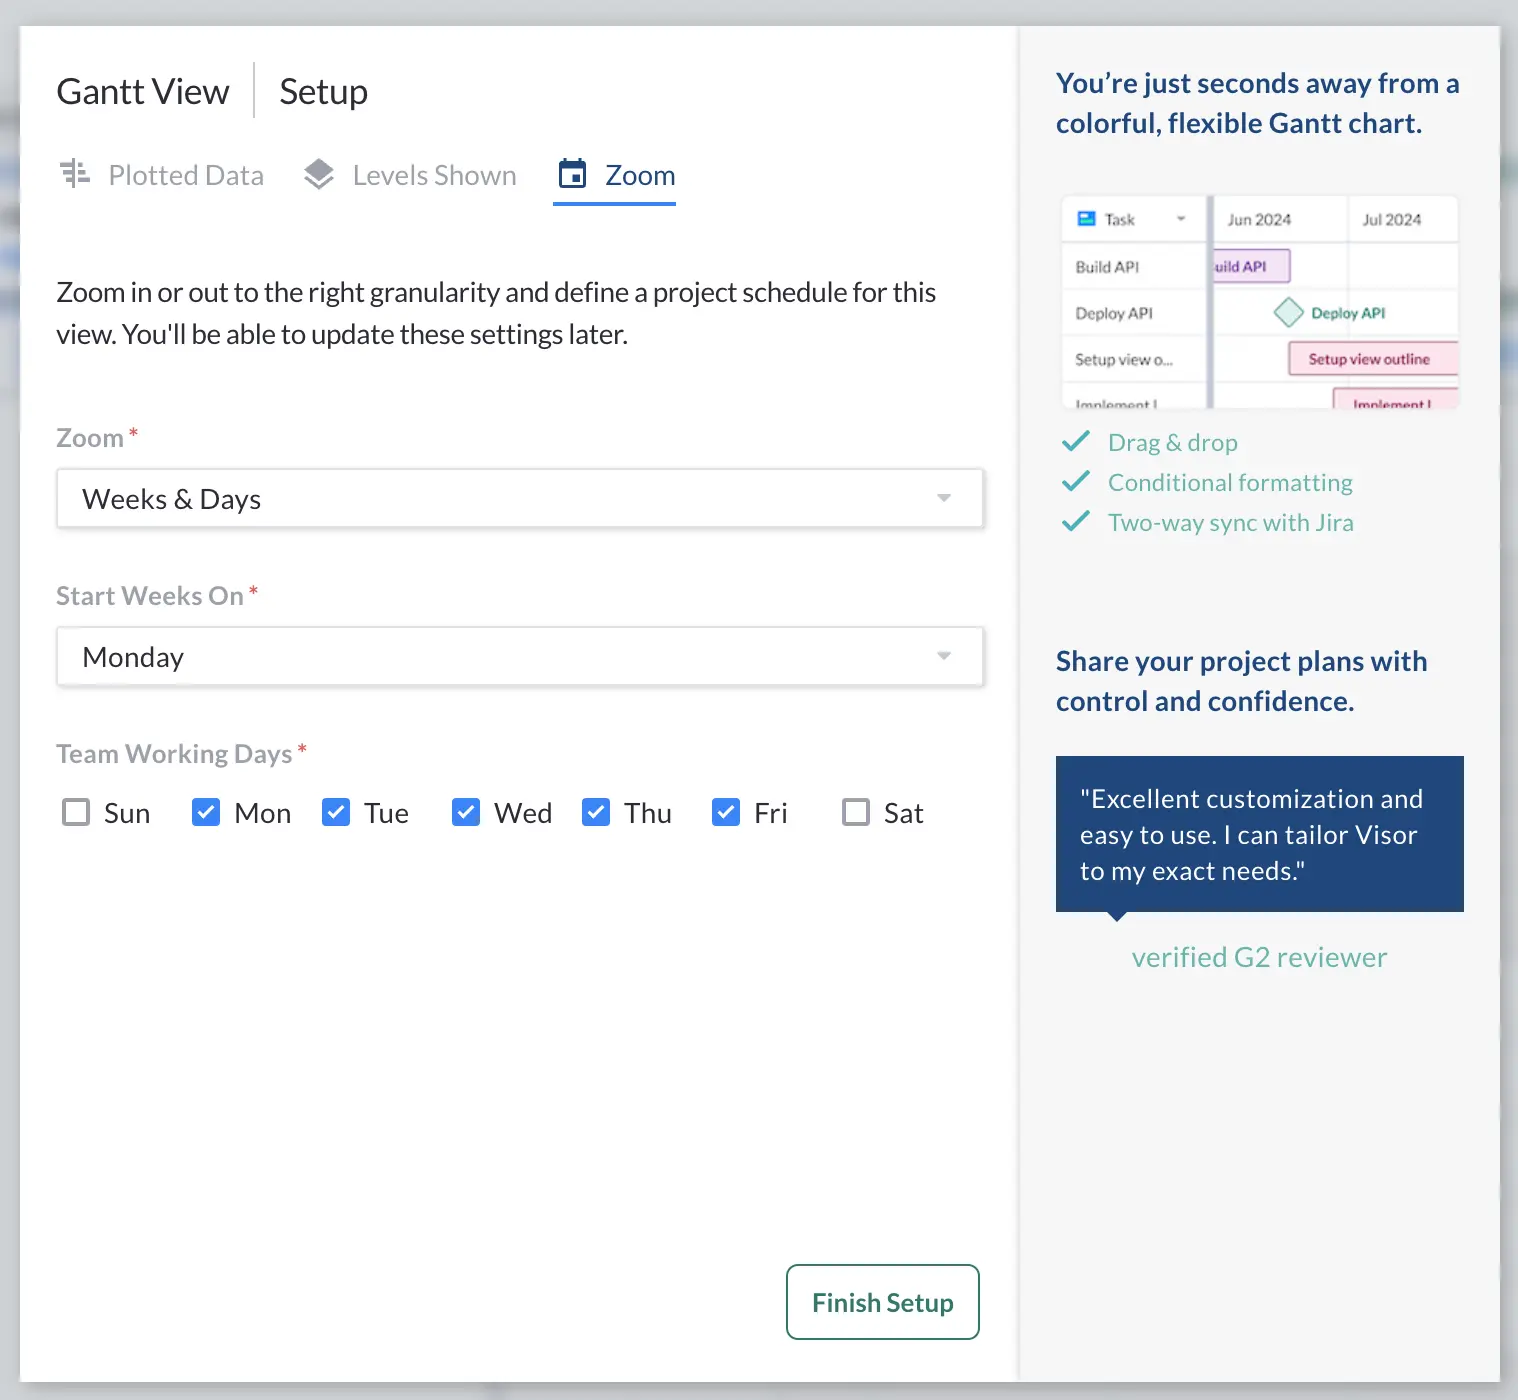
Zoom levels are another setting that you can toggle or adjust at any time, and you can create multiple views of your Gantt with different Zoom levels if preferred.
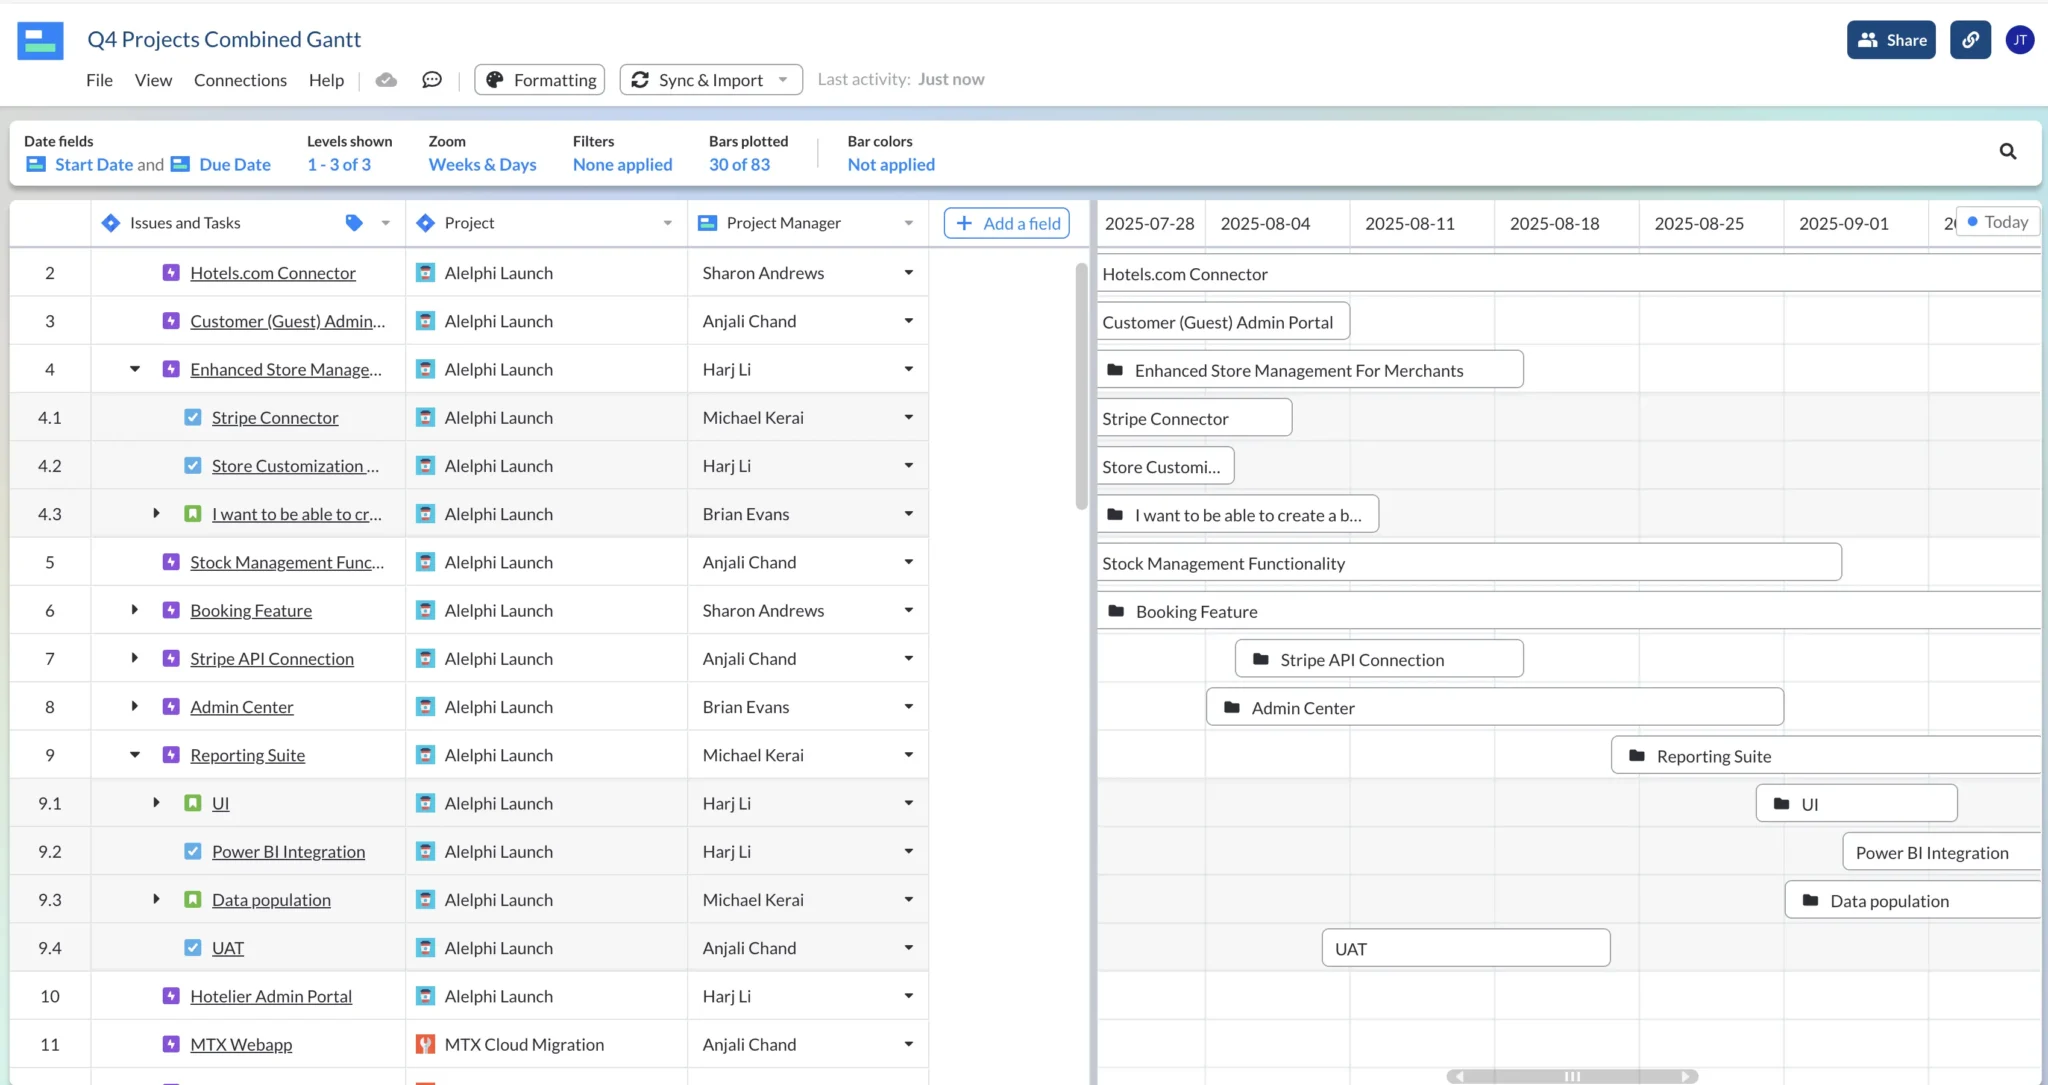
Step 7: Your Gantt Bars Will Be Added Automatically – Make Any Changes You Want
Your Gantt chart will automatically populate with the data you already have added to Visor. You don’t need to manually drag all the bars into place if your tasks already have start and due dates.
Visor’s Gantt chart view is extremely flexible and easy to customize. You can add or import more tasks and projects, adjust task schedules, show and hide fields, change column orders, and much more.
Step 8: Add Additional Fields
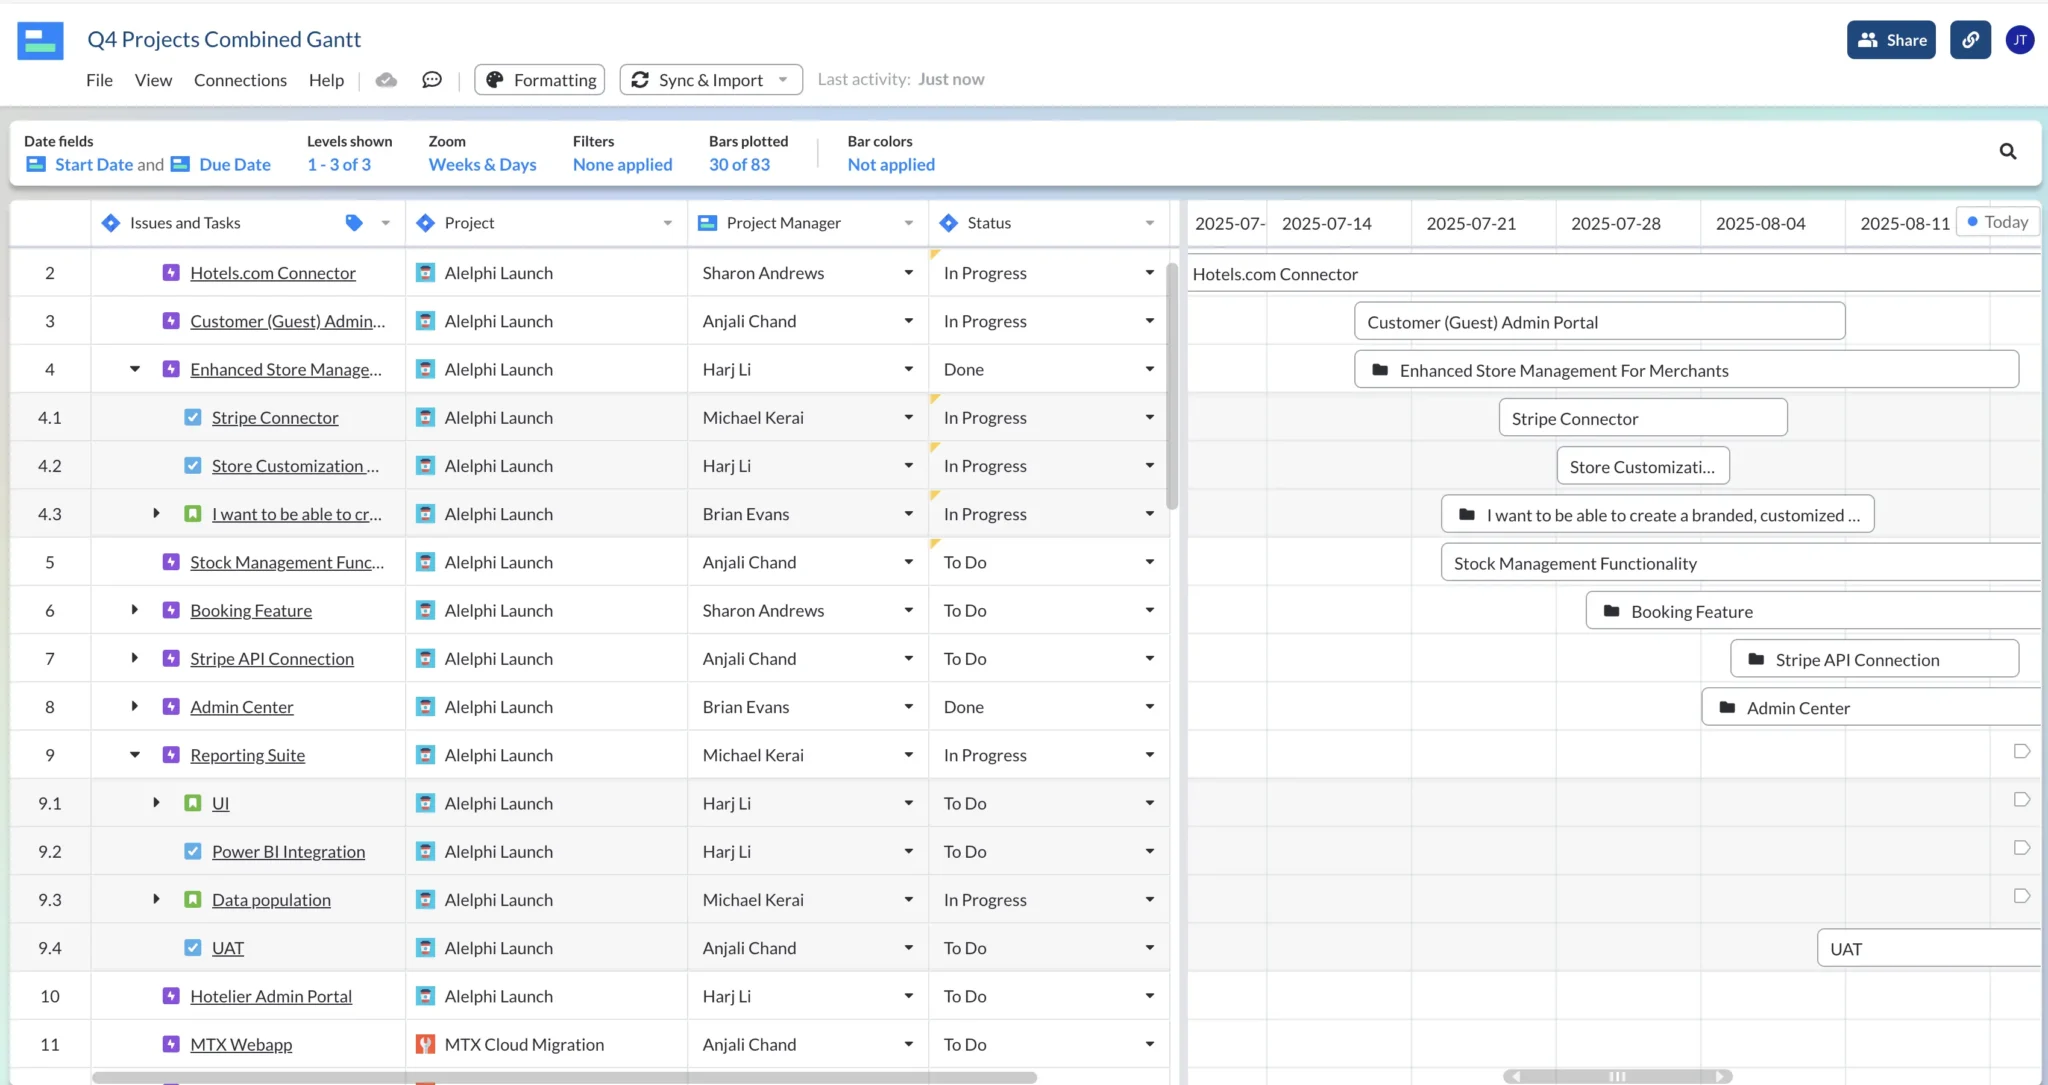
Add fields you want to display on the Gantt chart by clicking the Add Field button. In the image below I’ve added the “Status” field from Jira:
Step 9: Color Code Your Gantt Chart
Add some conditional formatting to make your Gantt chart more visually appealing, and to communicate details with color.
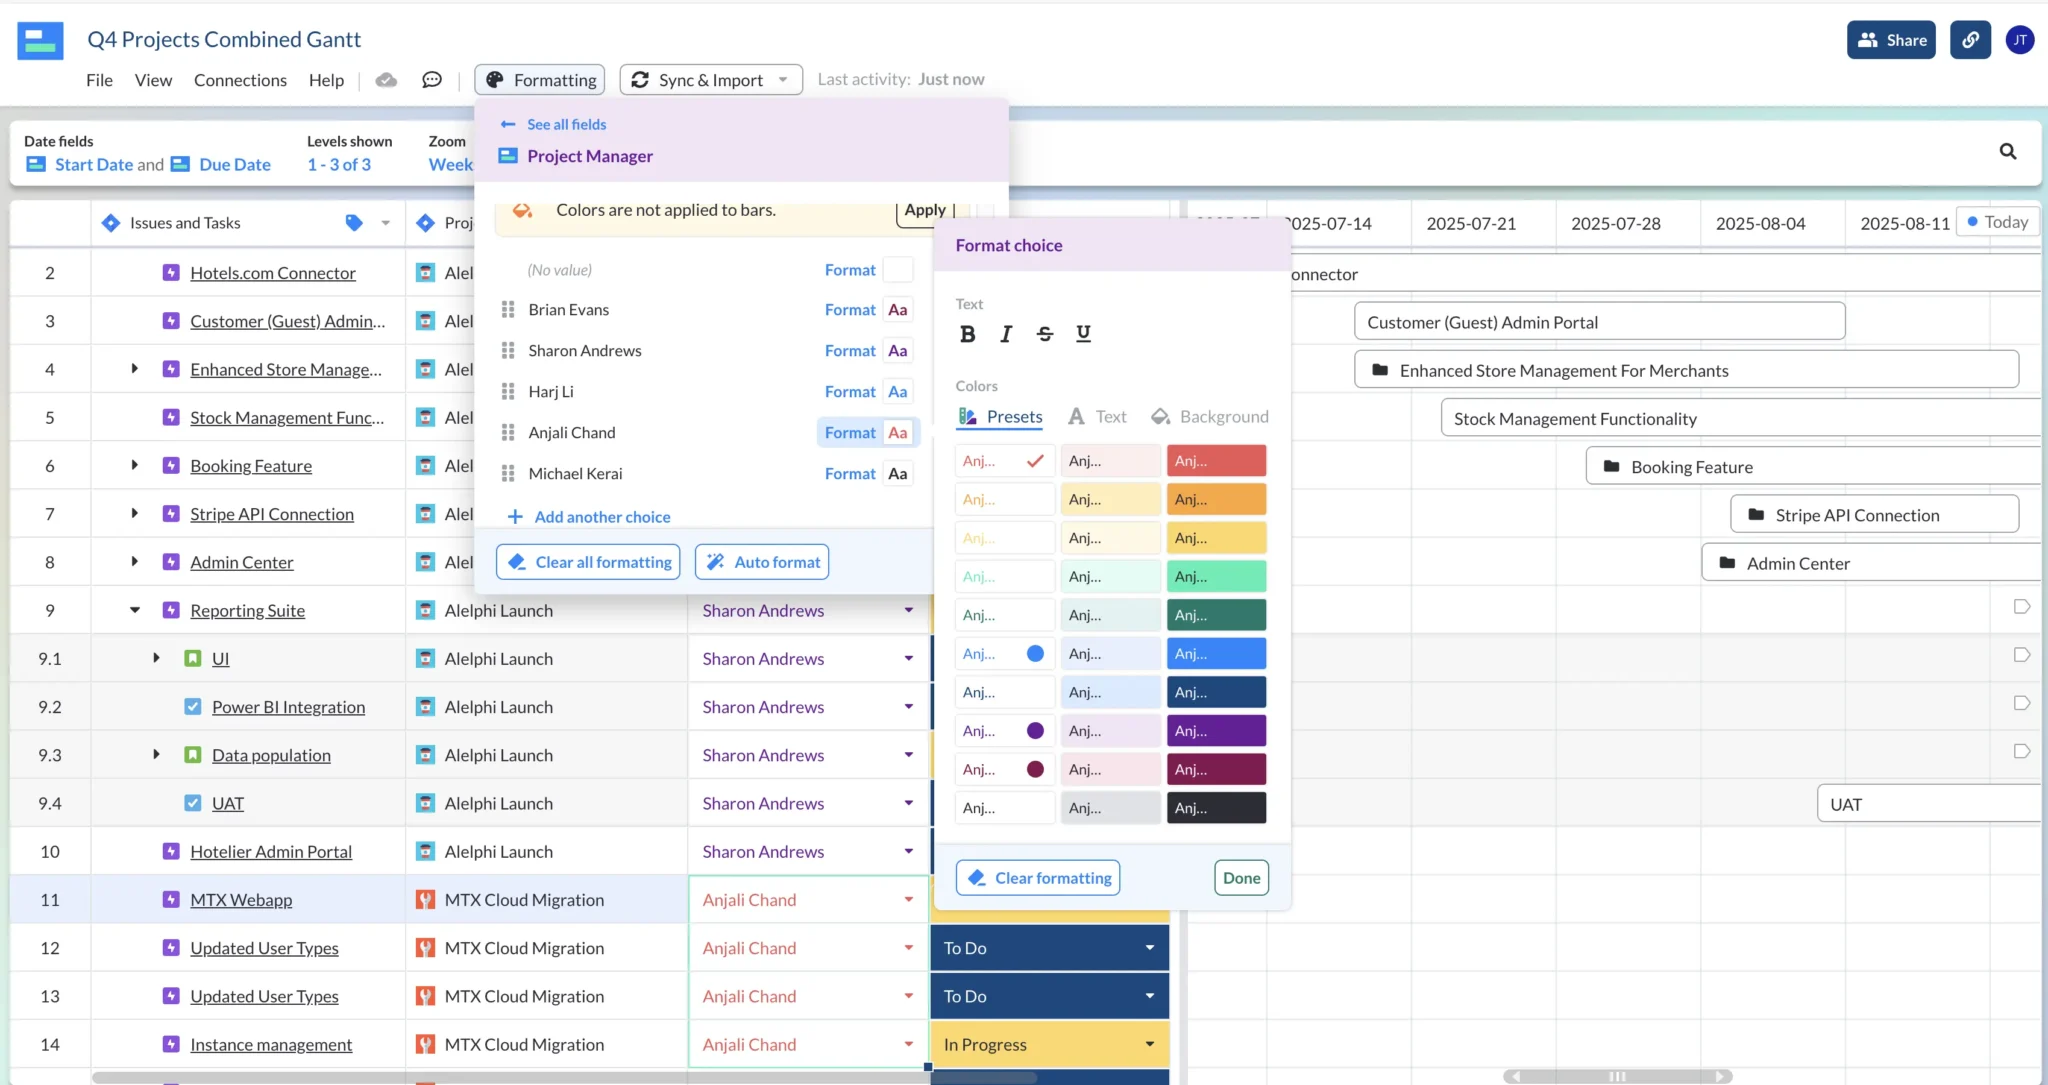
Select which field should be used to determine the color of the Gantt bars. In the image below I’ve selected the “Status” field’s colors. Now each bar is color coded according to its status (To Do = Blue, In Progress = Yellow, Done = Green):
This enables me to hide the Status field itself from the Gantt display, making more room for the Gantt bars on the timeline section of the Gantt chart (see example above).
Step 10: Add Calculated “Rollup” Fields
Rollup fields enable you to calculate a value for parent tasks based on the values in that parent’s child tasks.
For example, you could add a rollup field that shows the total number of hours allocated to all the subtasks for a task, or the average effort score for all the subtasks under a task.
It’s normal to have a hierarchy of tasks and subtasks in a Gantt chart. Rollup fields are essential to help you keep date and number fields reconciled from the subtask to task level, and they help you plan and track your projects with greater efficiency, ease, and accuracy.
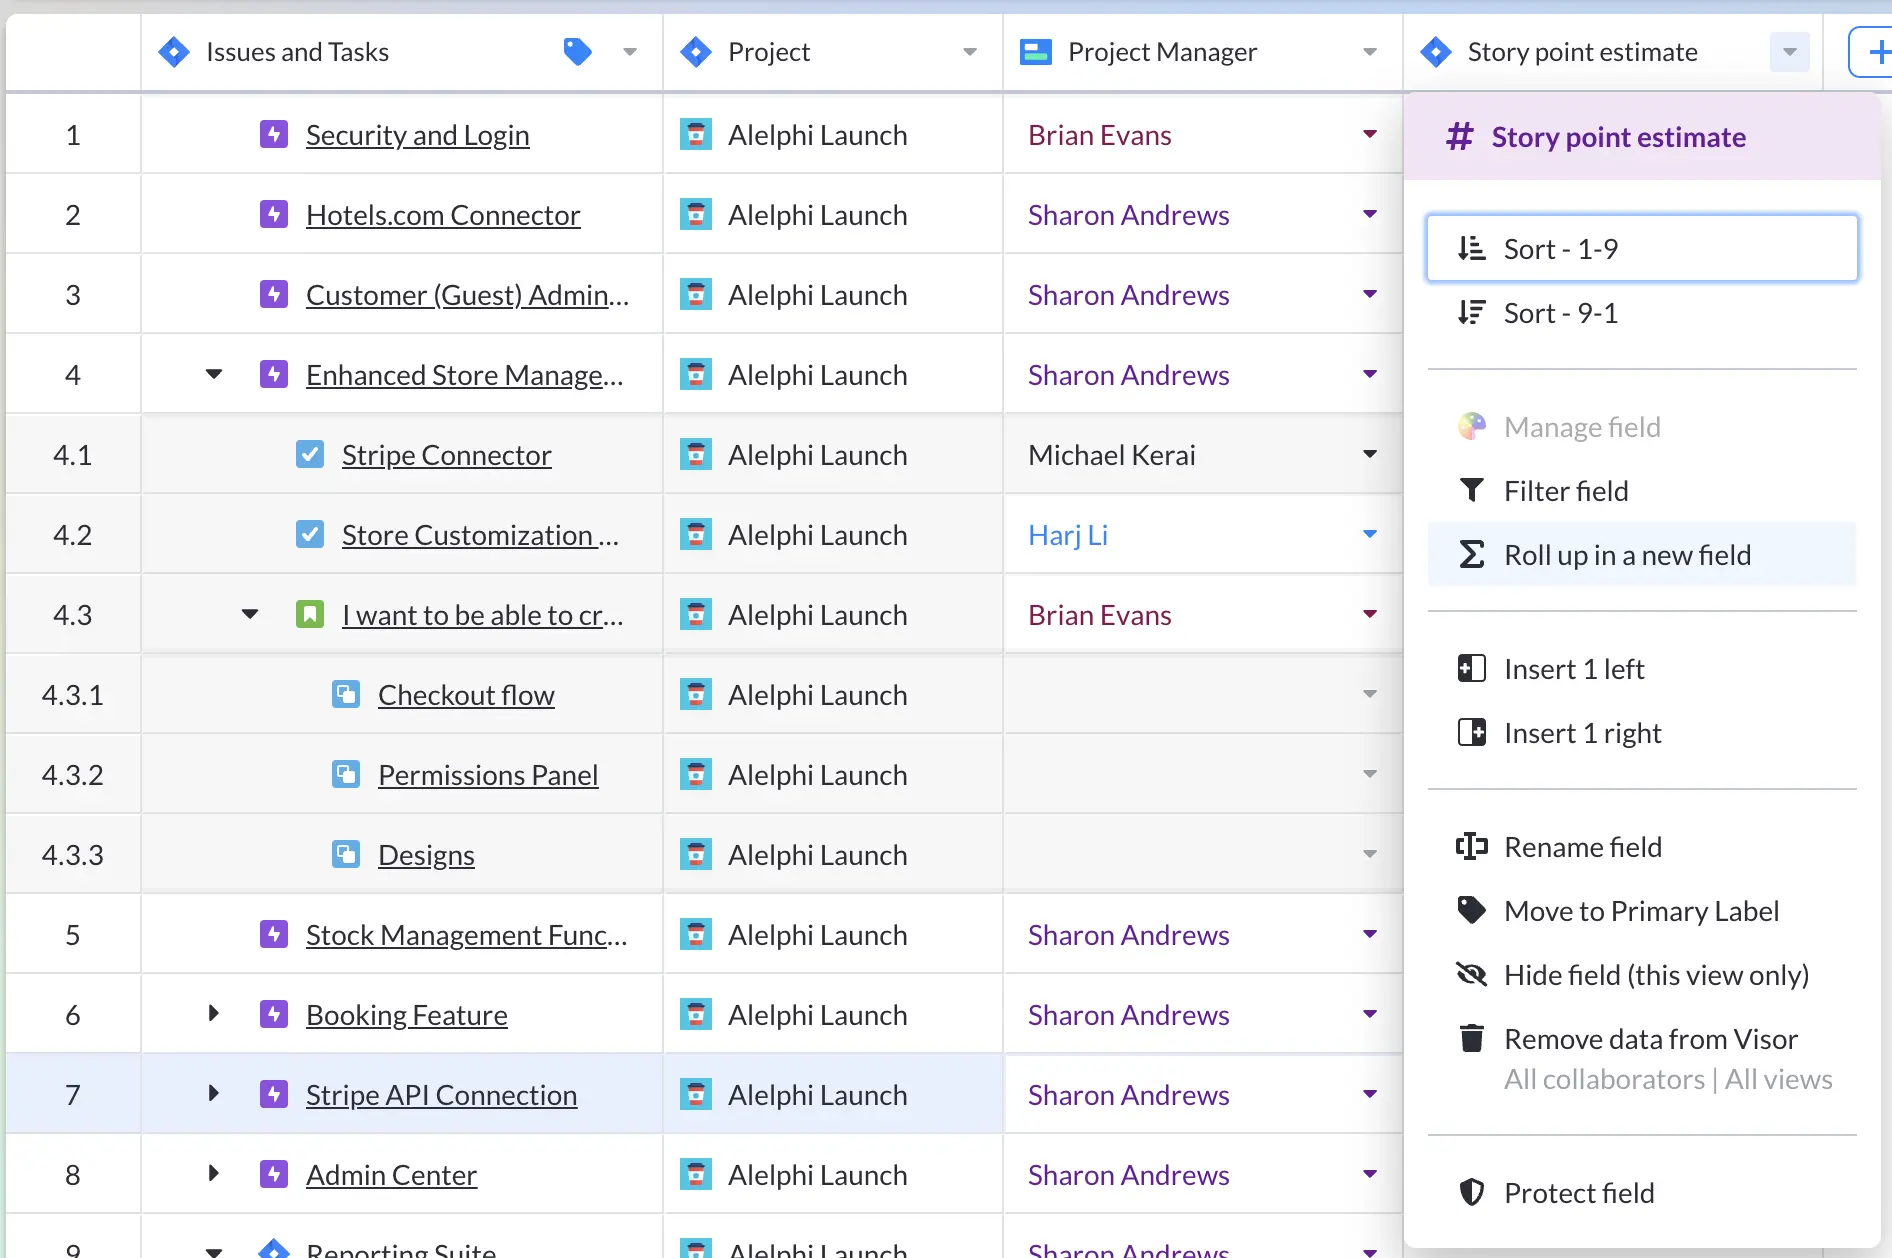
In the example in the image below I’ve added a Story Point Estimate Field from Jira, and then created a Total Estimated Story Points rollup field:
Step 10A: Select the field I want to rollup:
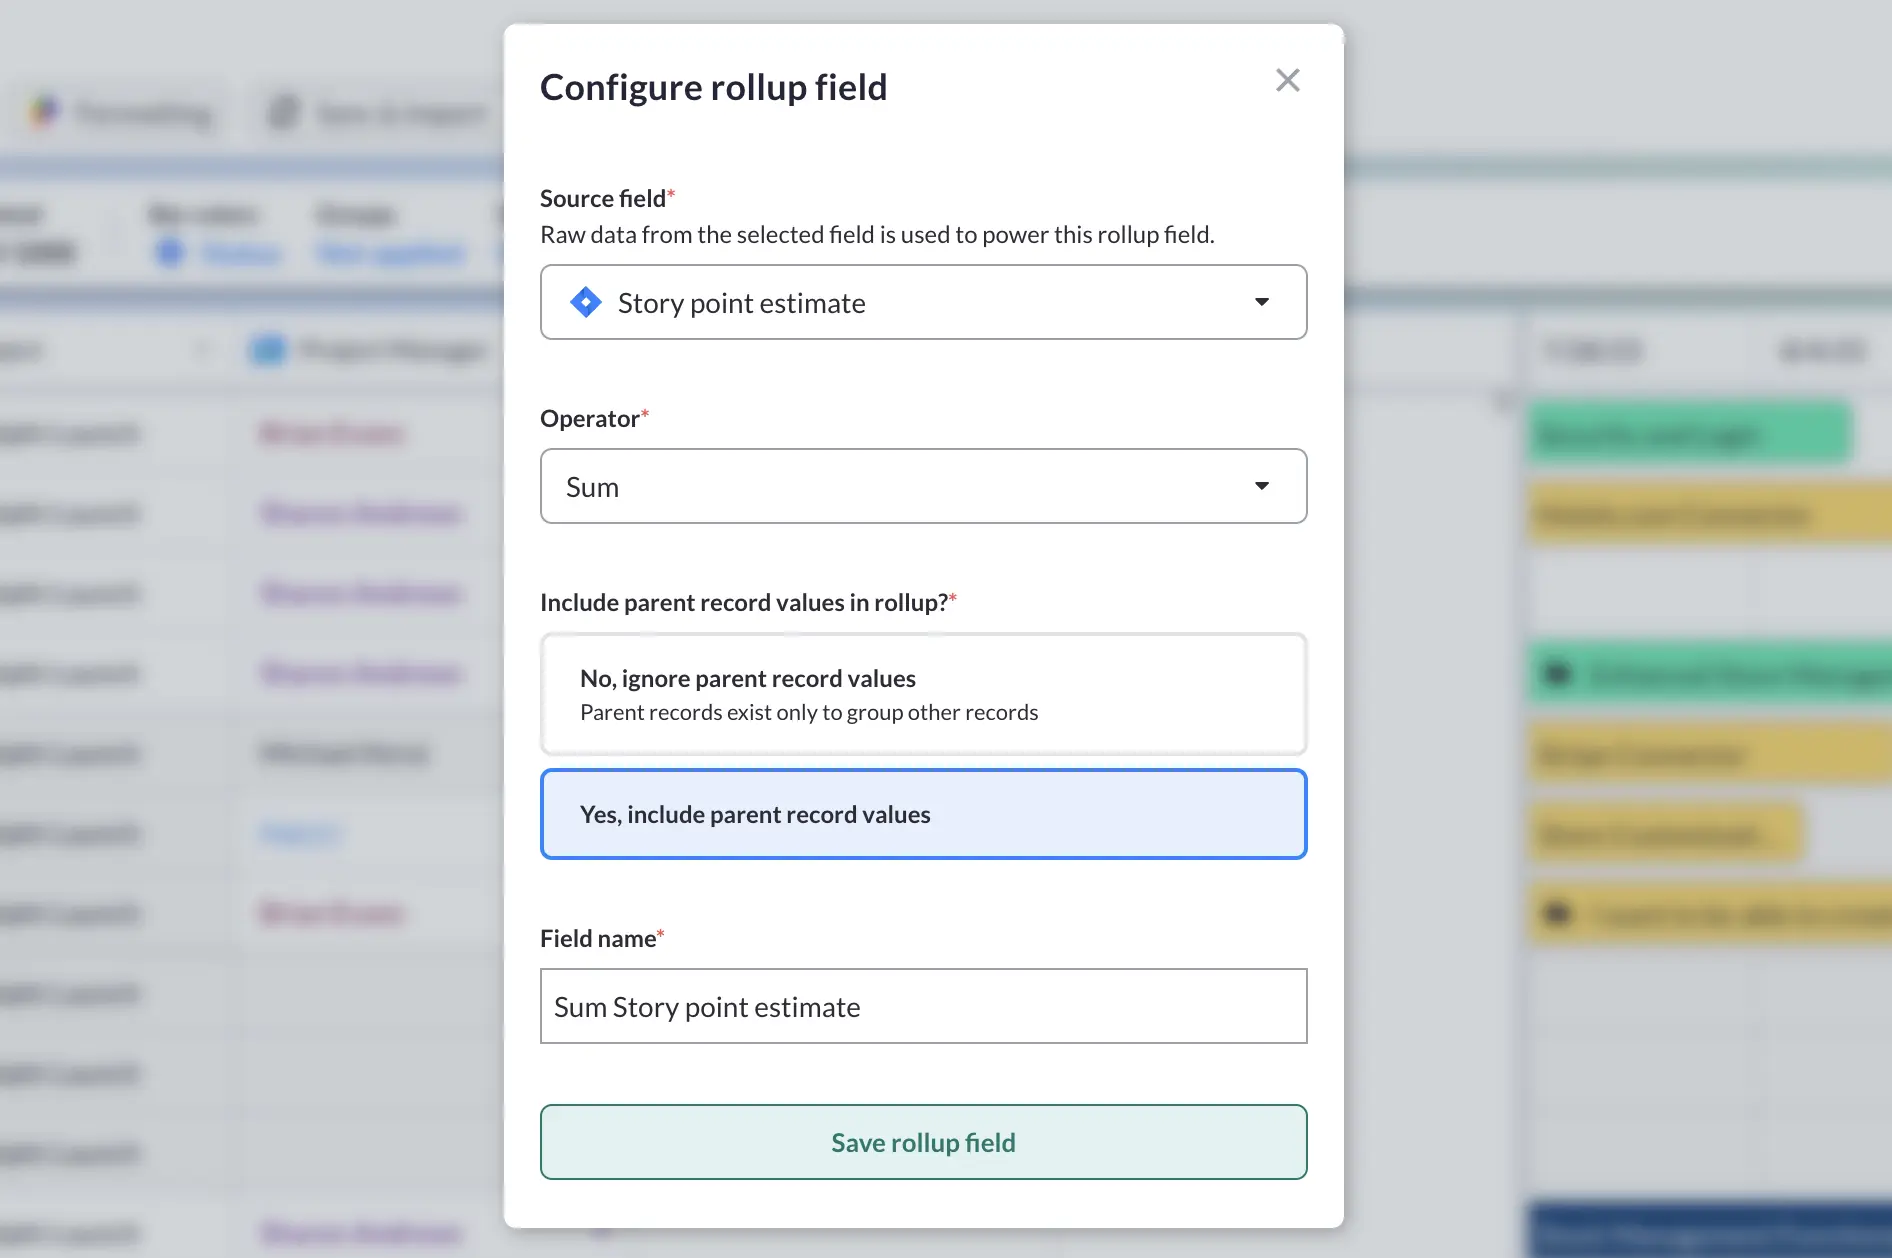
Step 10B: Configure the rollup field, choosing the operator (such as Sum, Average, Median etc.) and whether to include parent values in the calculation, then click Save:
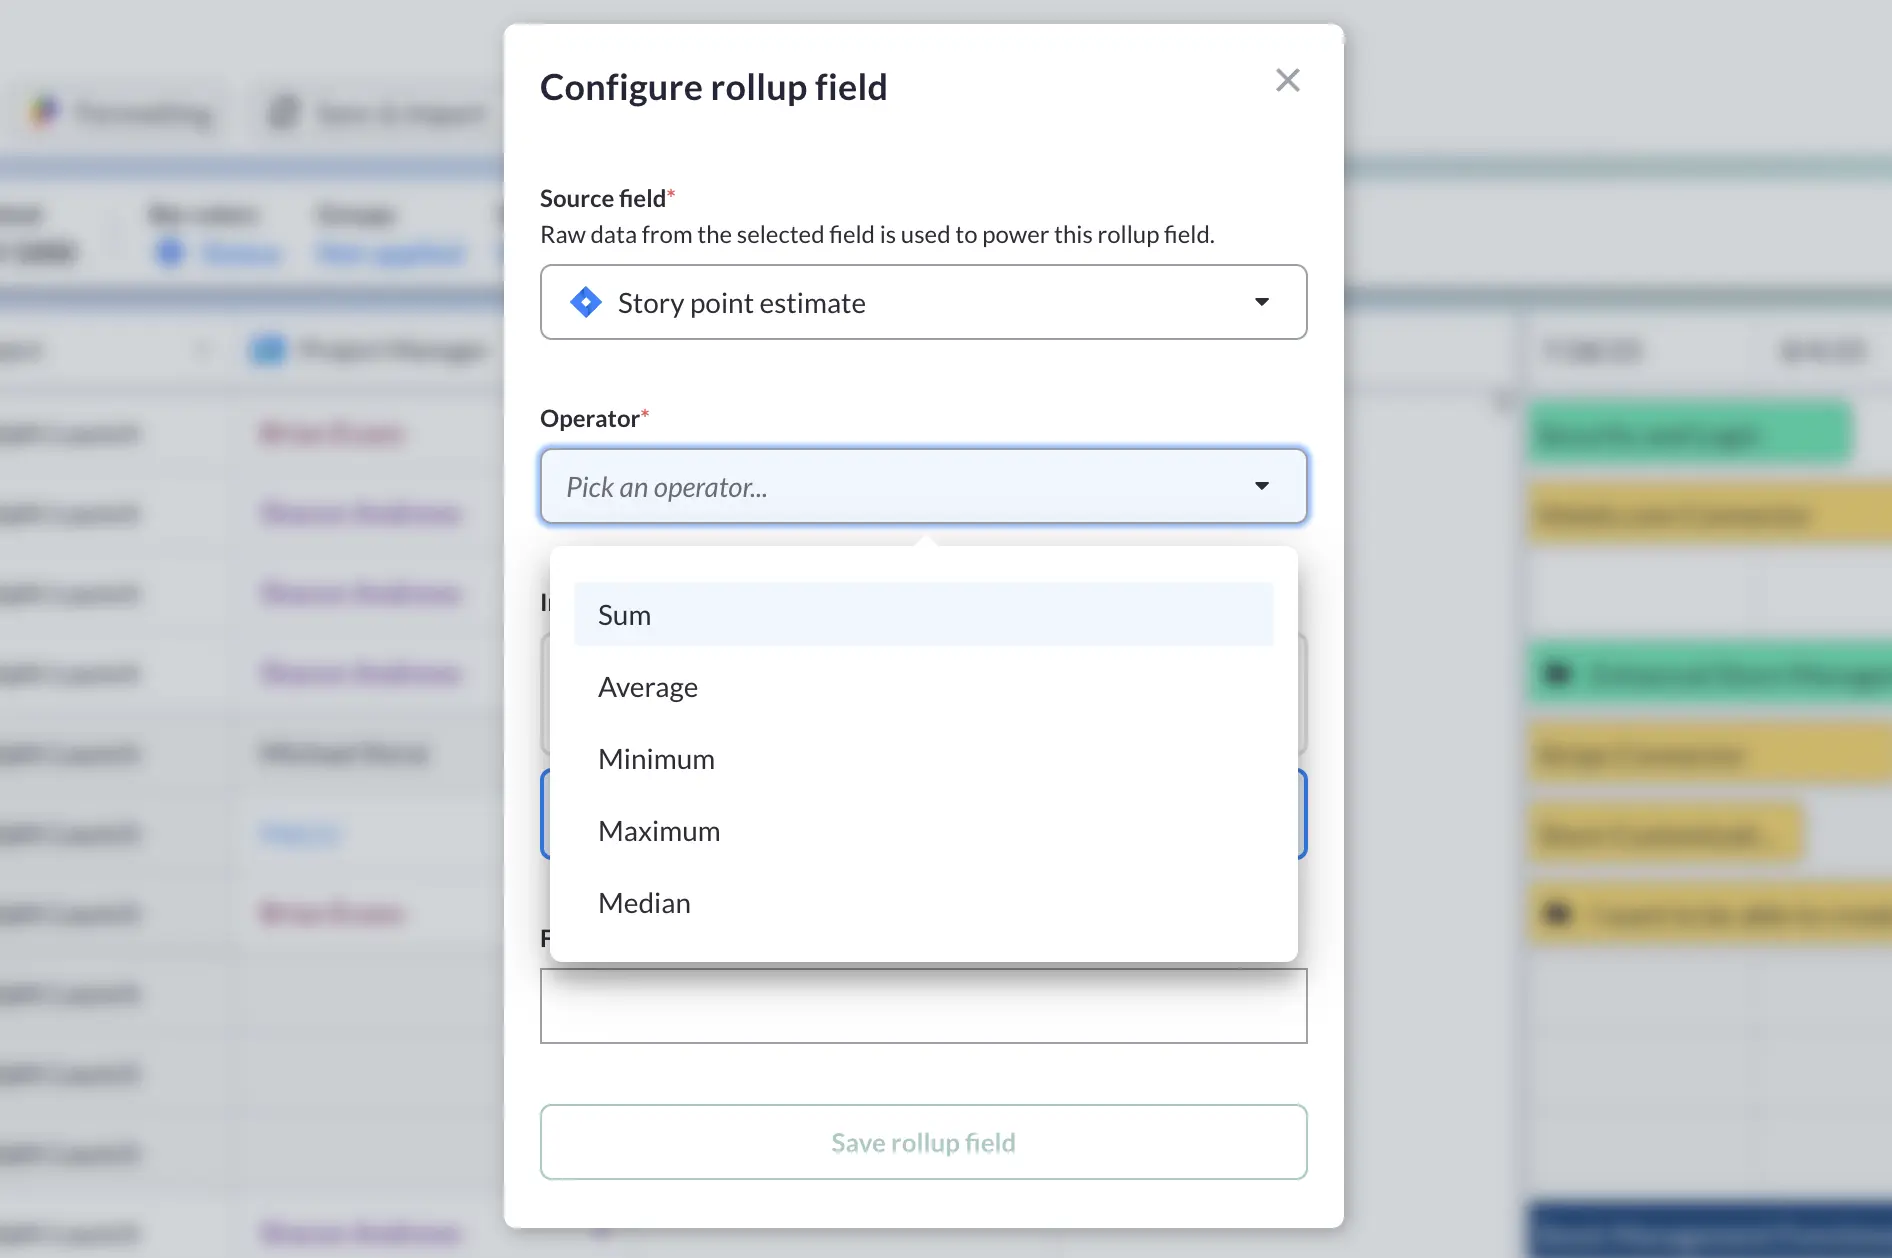
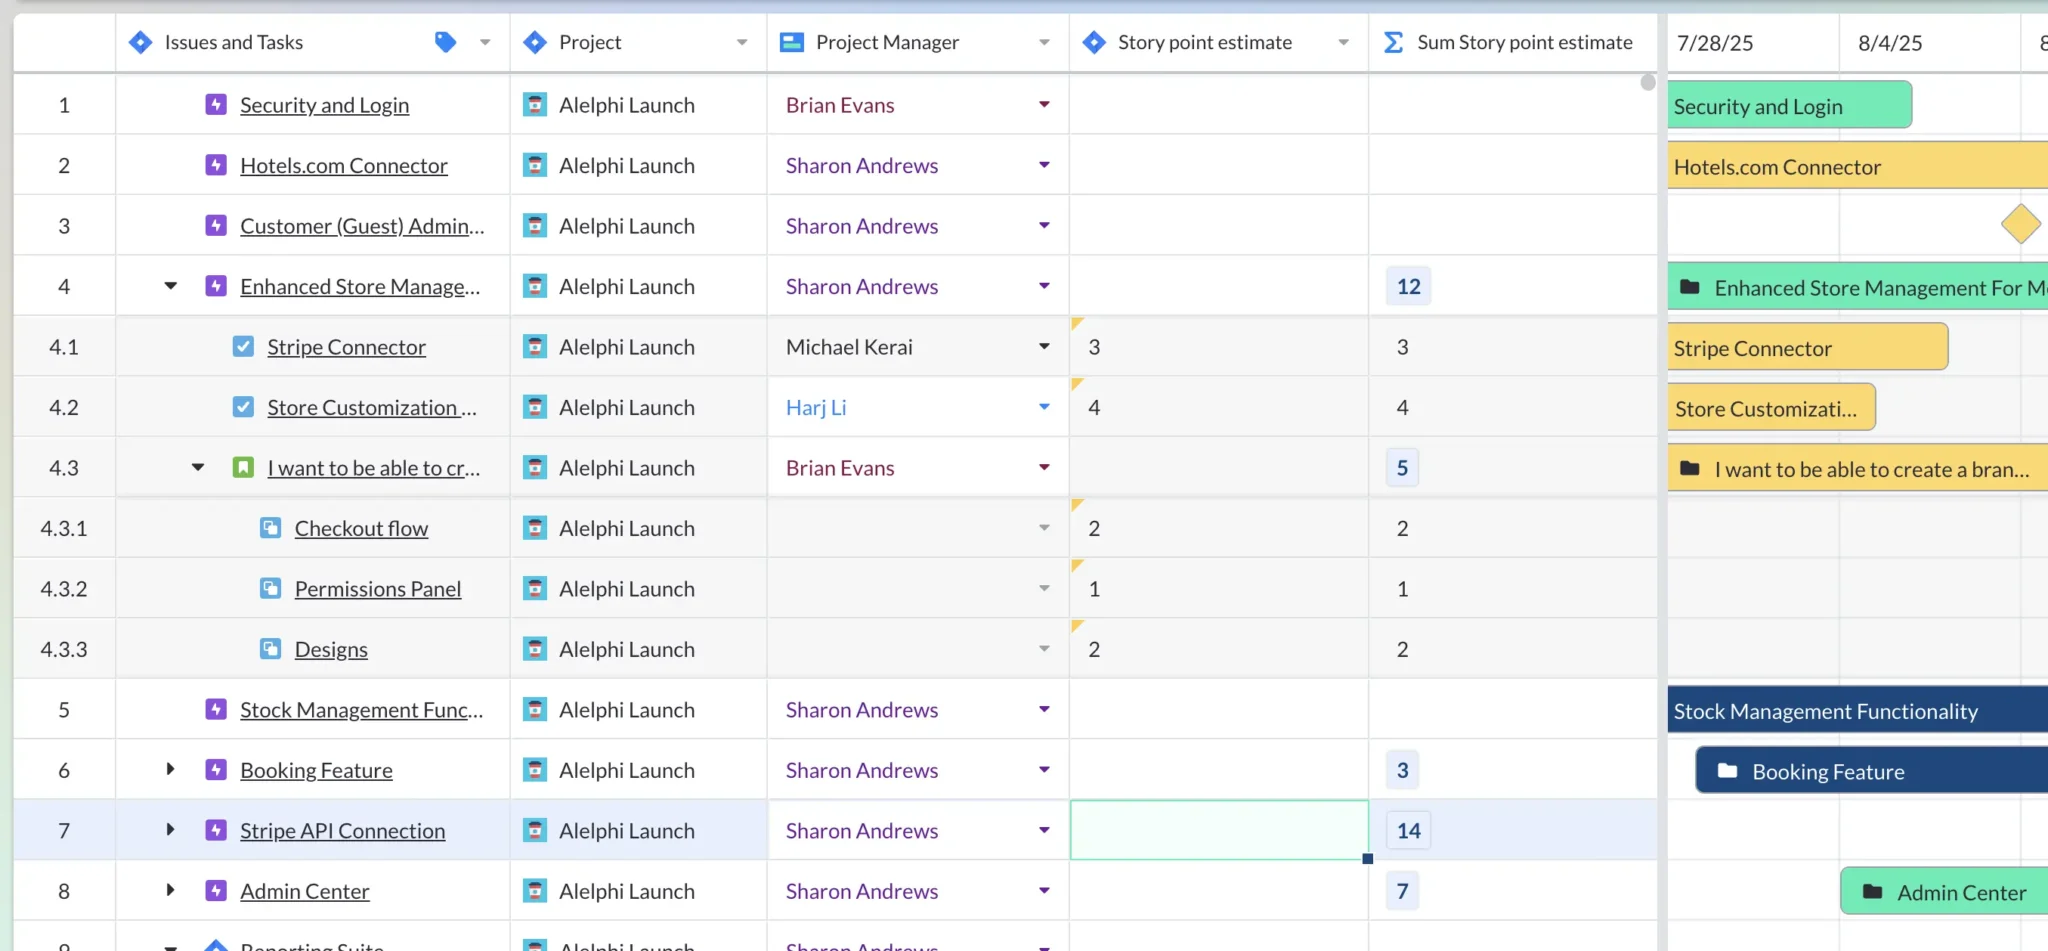
My new rollup field is added, it shows me the total number of Estimated Story Points for any parent task/record/issue type based on the sum of the story points for its child records. The rolled up values are highlighted with a light blue background:
You can add rollup fields for any date or number field, including fields imported from other apps (like Jira or Asana), or thsoe added directly in Visor.
Step 11: Group The Records In Your Gantt
In a Visor Gantt chart you can group your records (your tasks or issues) by any dropdown field.
The typical grouping people use in multi-project Gantt charts is to group records by the Project. However, other fields like Assignee, Resource Type, and Priority are also regularly used to create views for specific jobs, teams, meetings, stakeholders and so on.
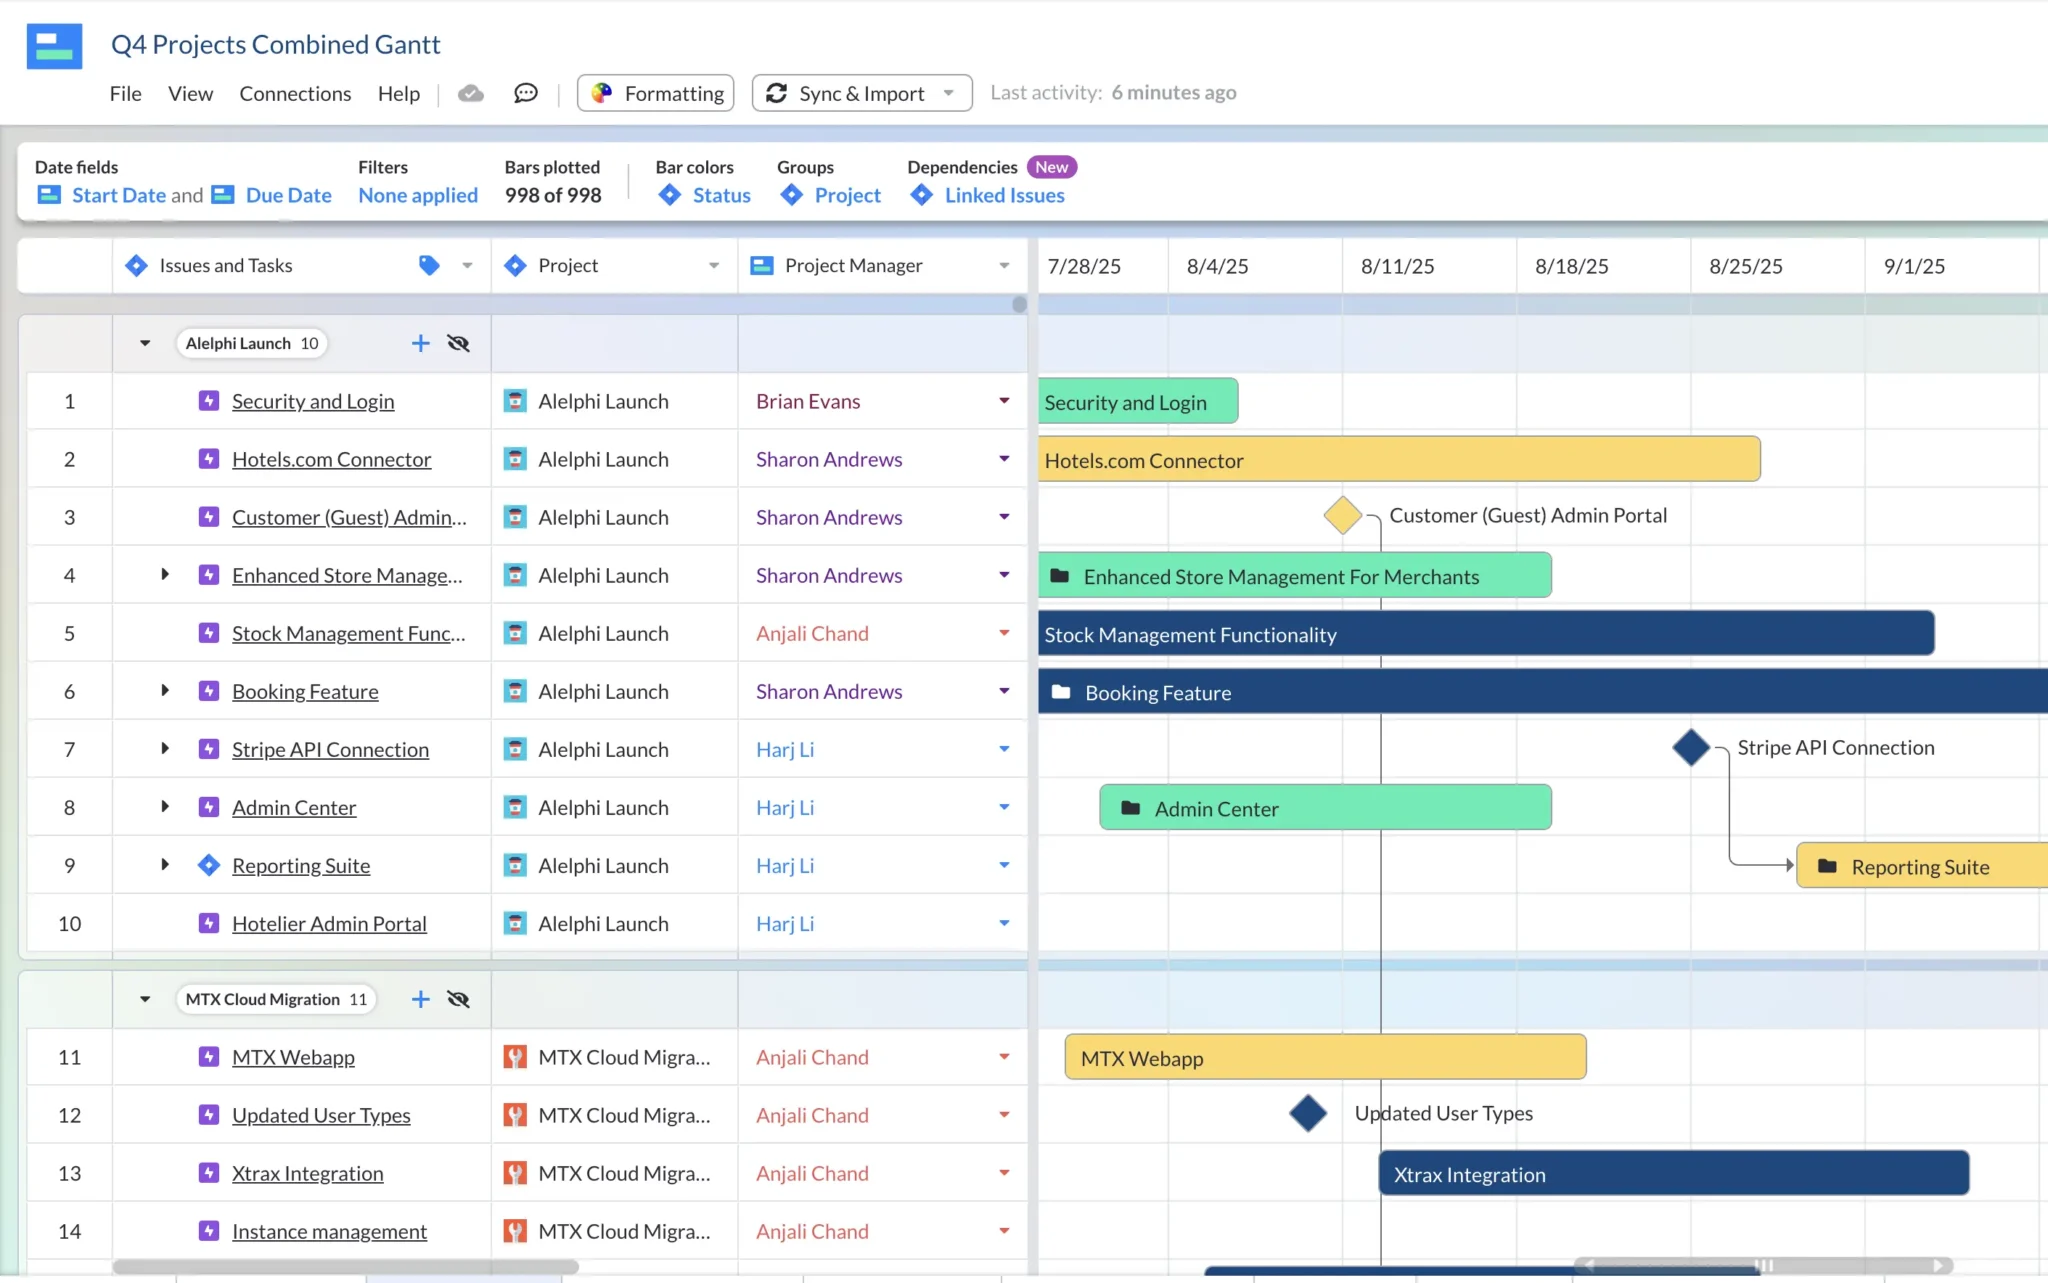
Simply click on the “Groups” button and select the field to group your records by. In the example below I’m selecting the Project field:
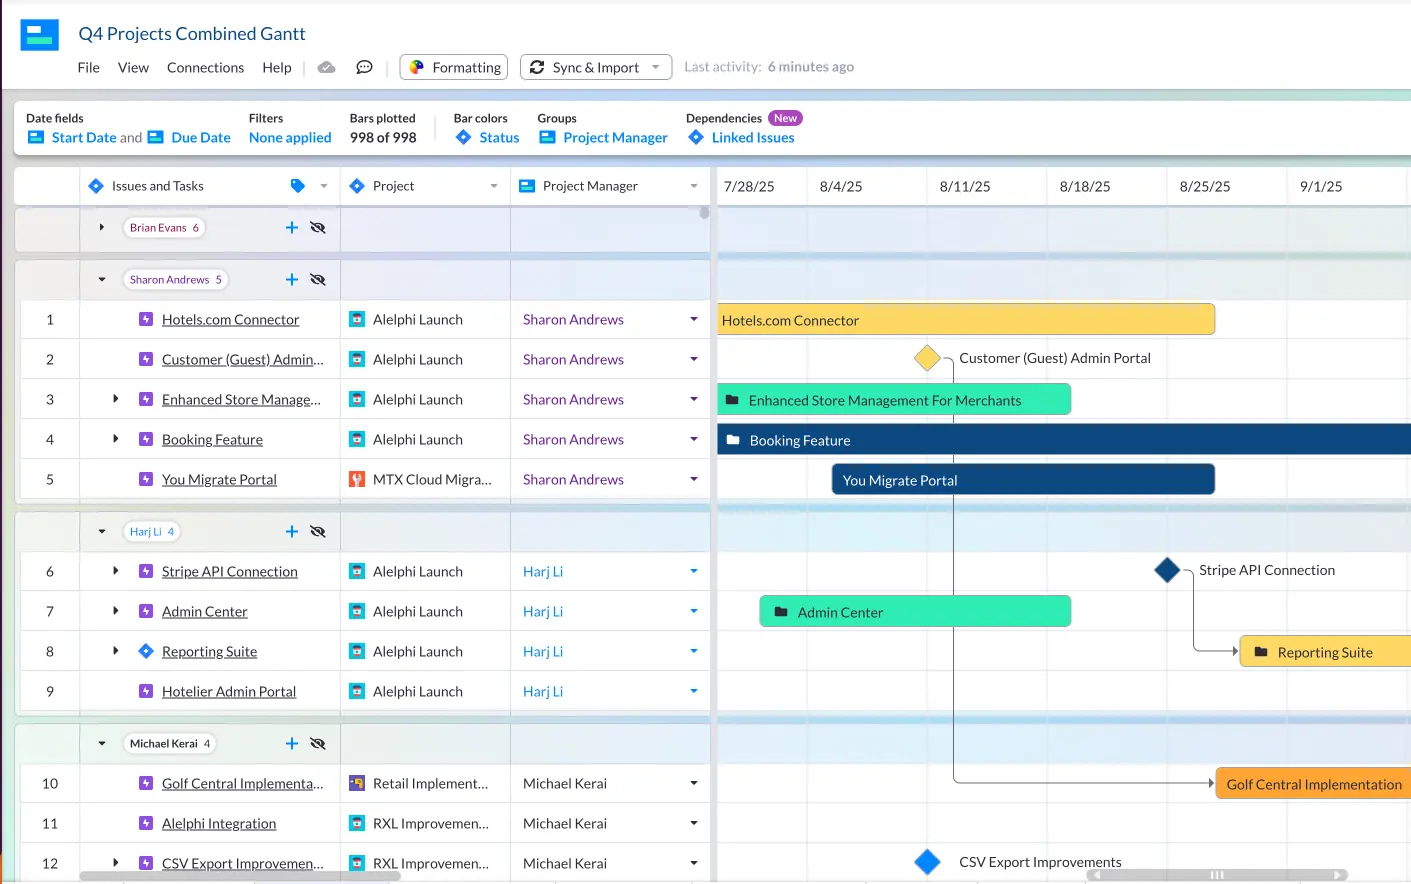
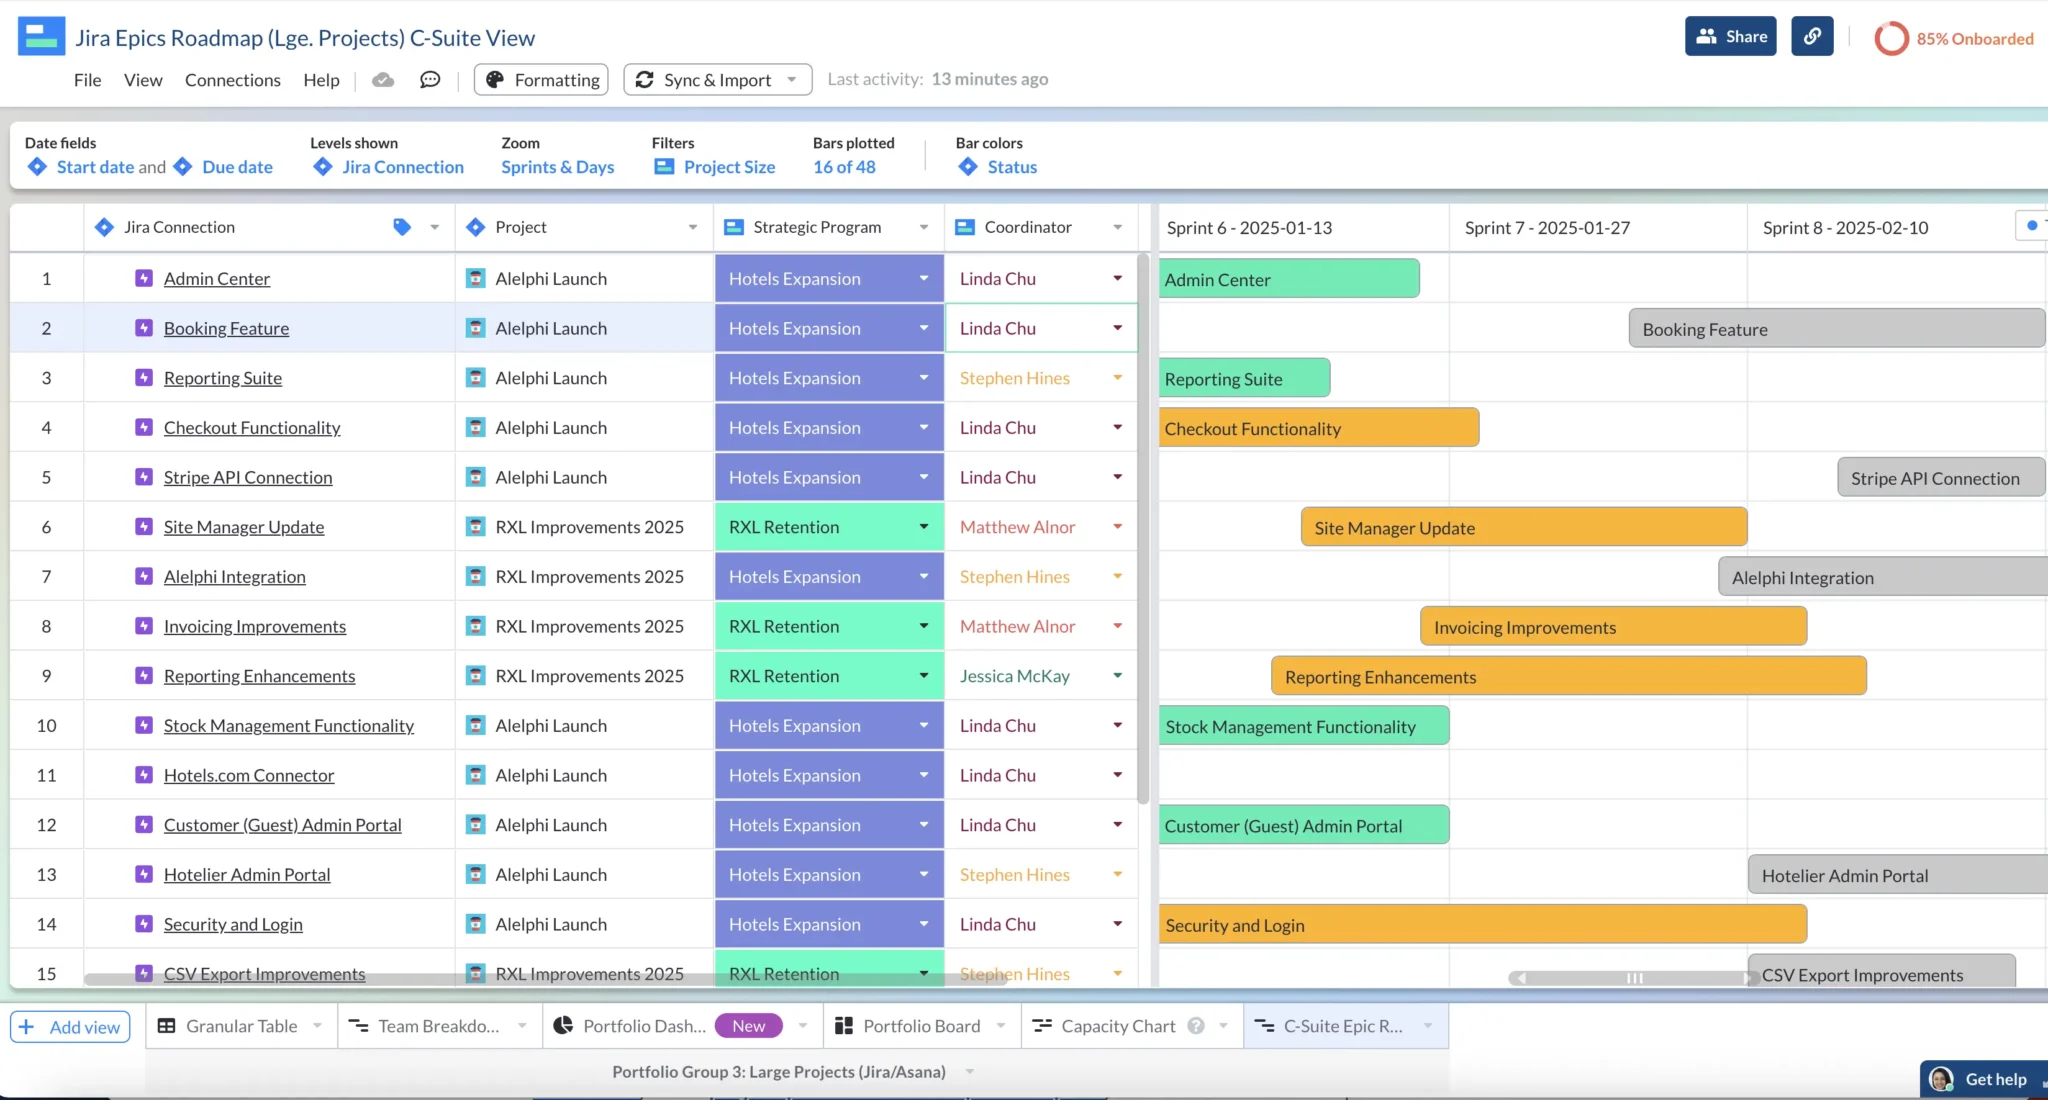
And in this example I’ve chosen to group by the Project Manager field, so I can see all the epics assigned to each project manager across all the projects in my program/portfolio:
You can group your Gantt chart by any dropdown field, including those imported from integrated apps like Jira, Asana, and Salesforce, or imported by CSV, or those fields added directly in Visor.
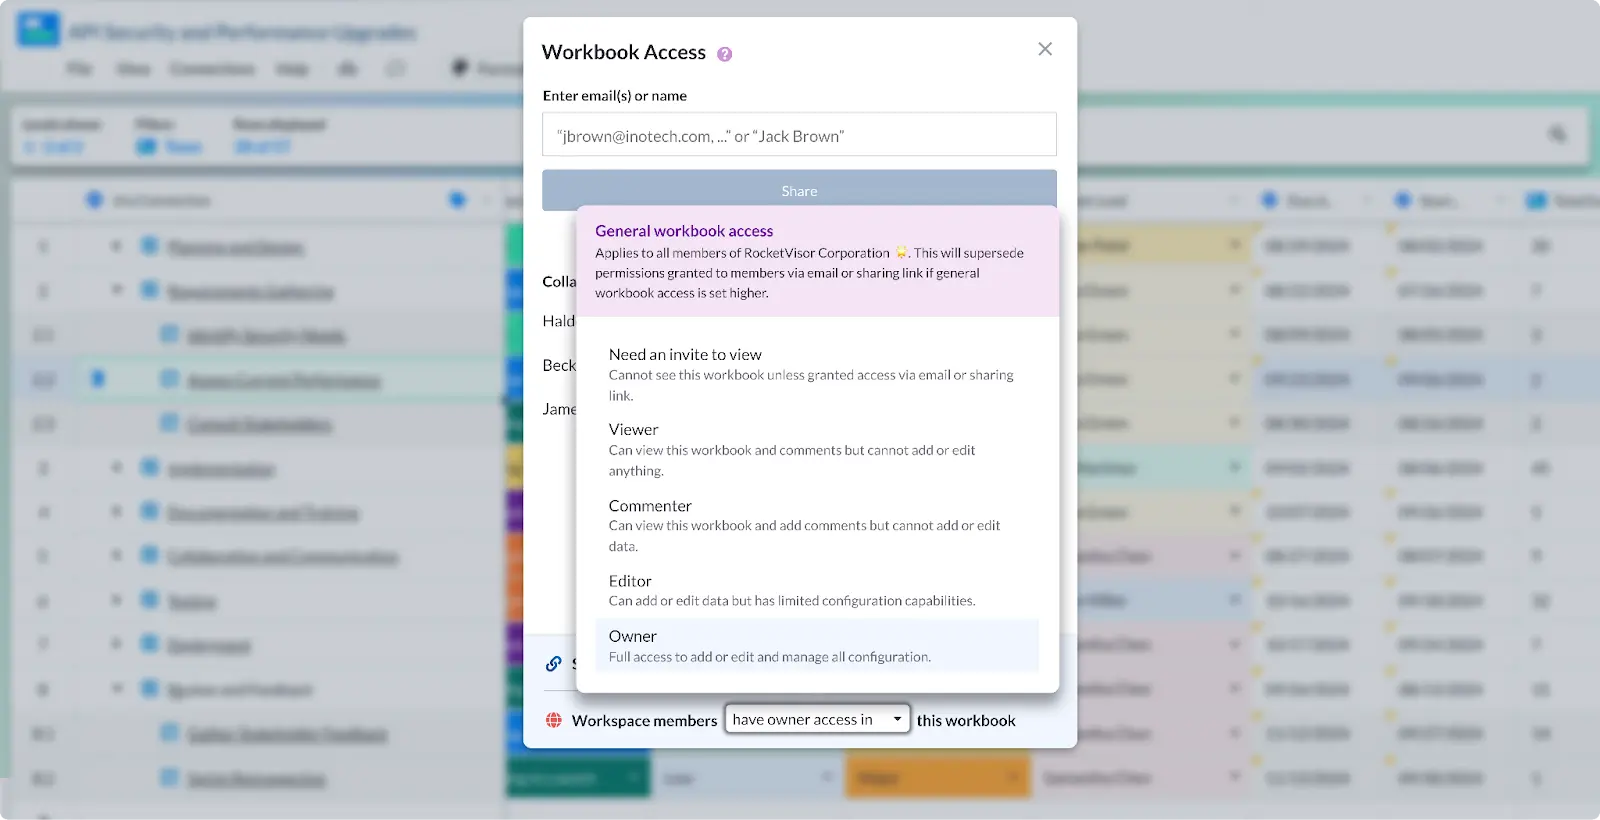
Step 12: Share Your Gantts With Your Stakeholders
Once you’re happy, share with your stakeholders. You can use the settings described above to create tailored Gantt chart views for different stakeholders, which will all stay up-to-date with the same project data.
Creating a Gantt Chart For Multiple Jira projects (in Visor)
Visor has a two-way integration with Jira. Each Jira project’s nesting, structure, and relationships are maintained when you import them to Visor.
This makes it fast and easy to create a Gantt chart that includes as many projects from Jira as you want.
You won’t waste time manually re-nesting and reconnecting your data. You can get on with making your Gantt chart look good and using it to track and manage your portfolio of Jira projects.
How To Import Jira Projects Into a Visor Gantt Chart
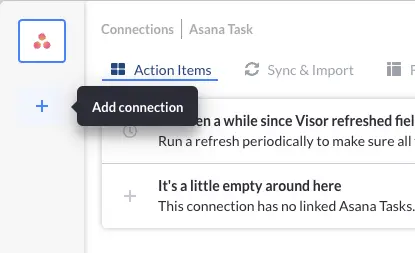
It’s easy to import multiple Jira projects into a Visor Gantt chart. You can add your Jira projects when you first set Visor up or at any time by clicking the ‘Connections” button.
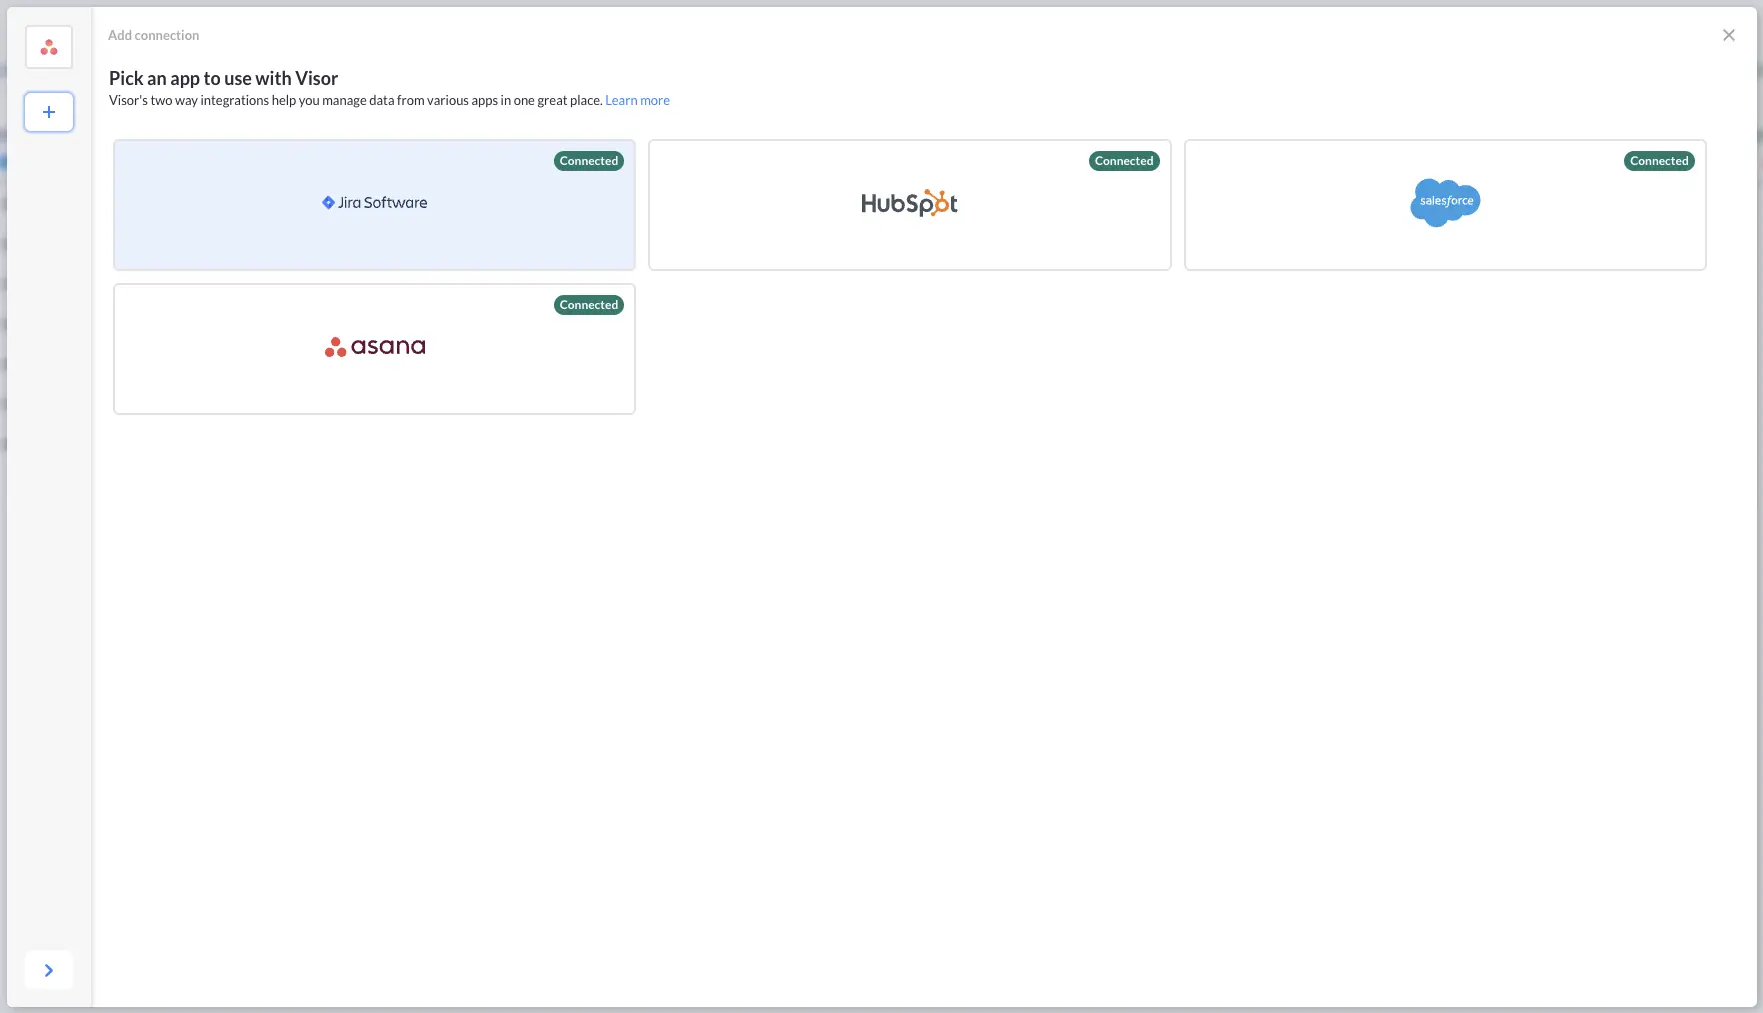
Next click the “+” button to add a new connection:
Then select Jira from the app menu:
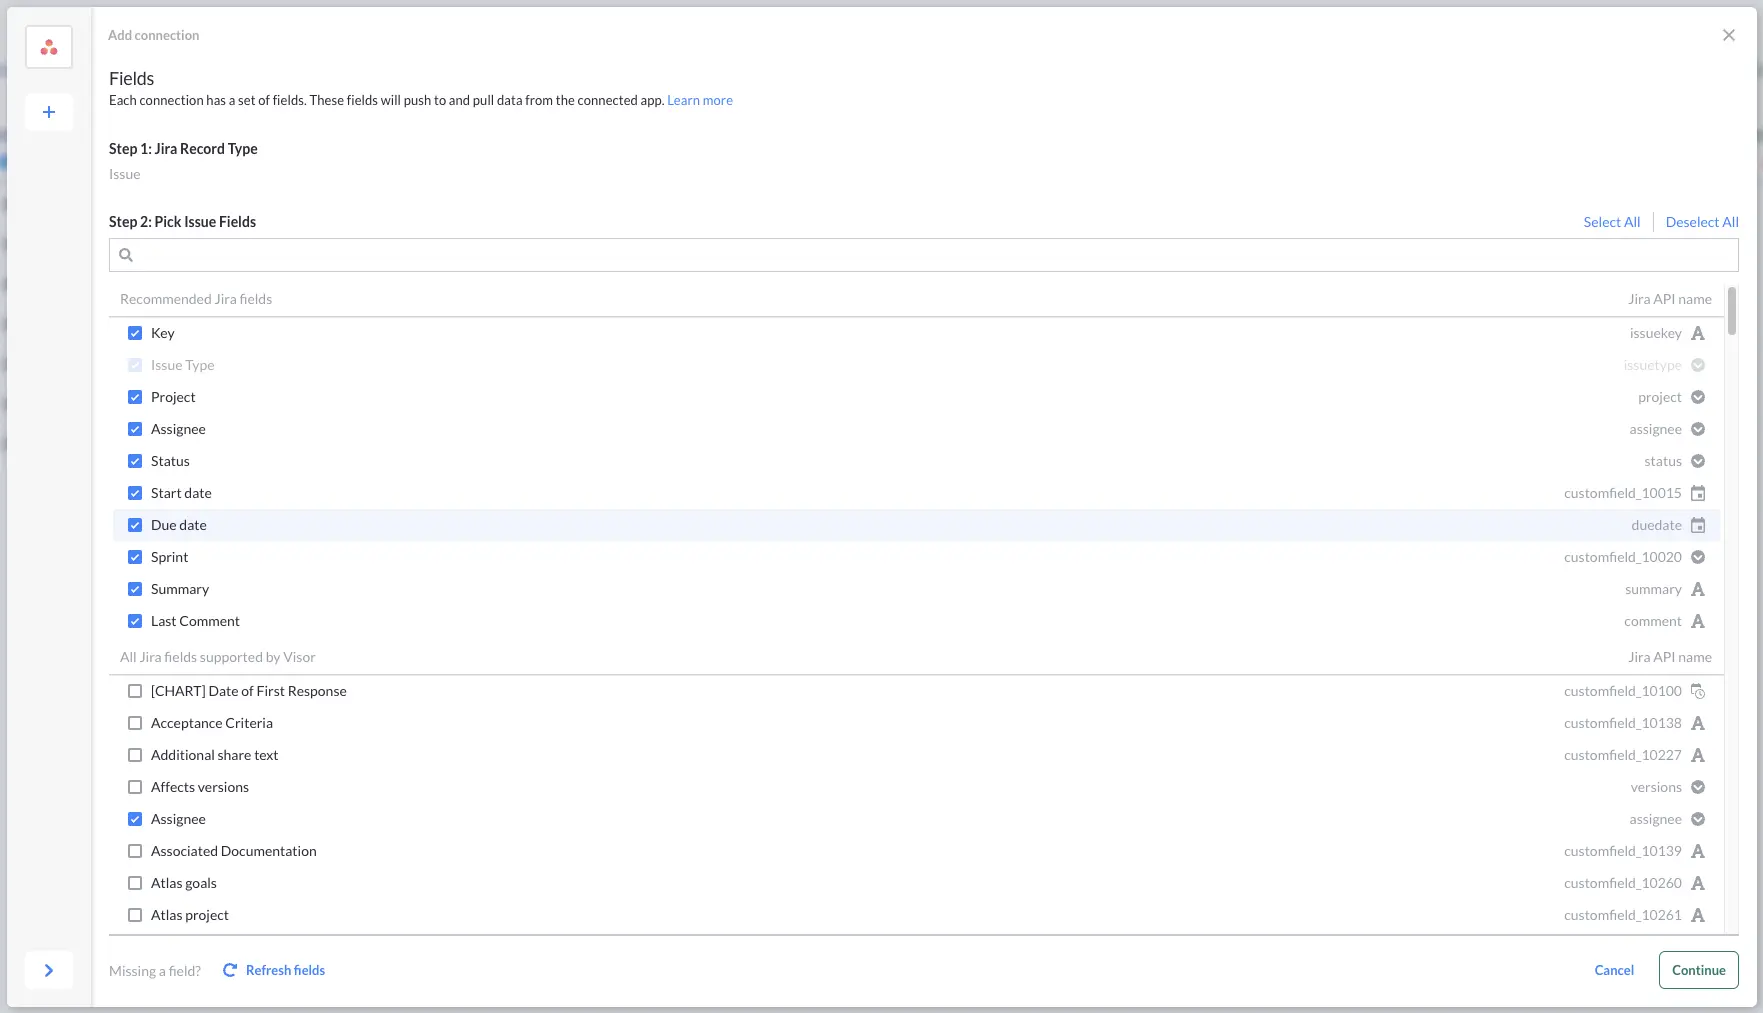
Then select the fields you want to import with your Jira projects:
Now you can use some JQL to tell Visor which Jira projects to import:
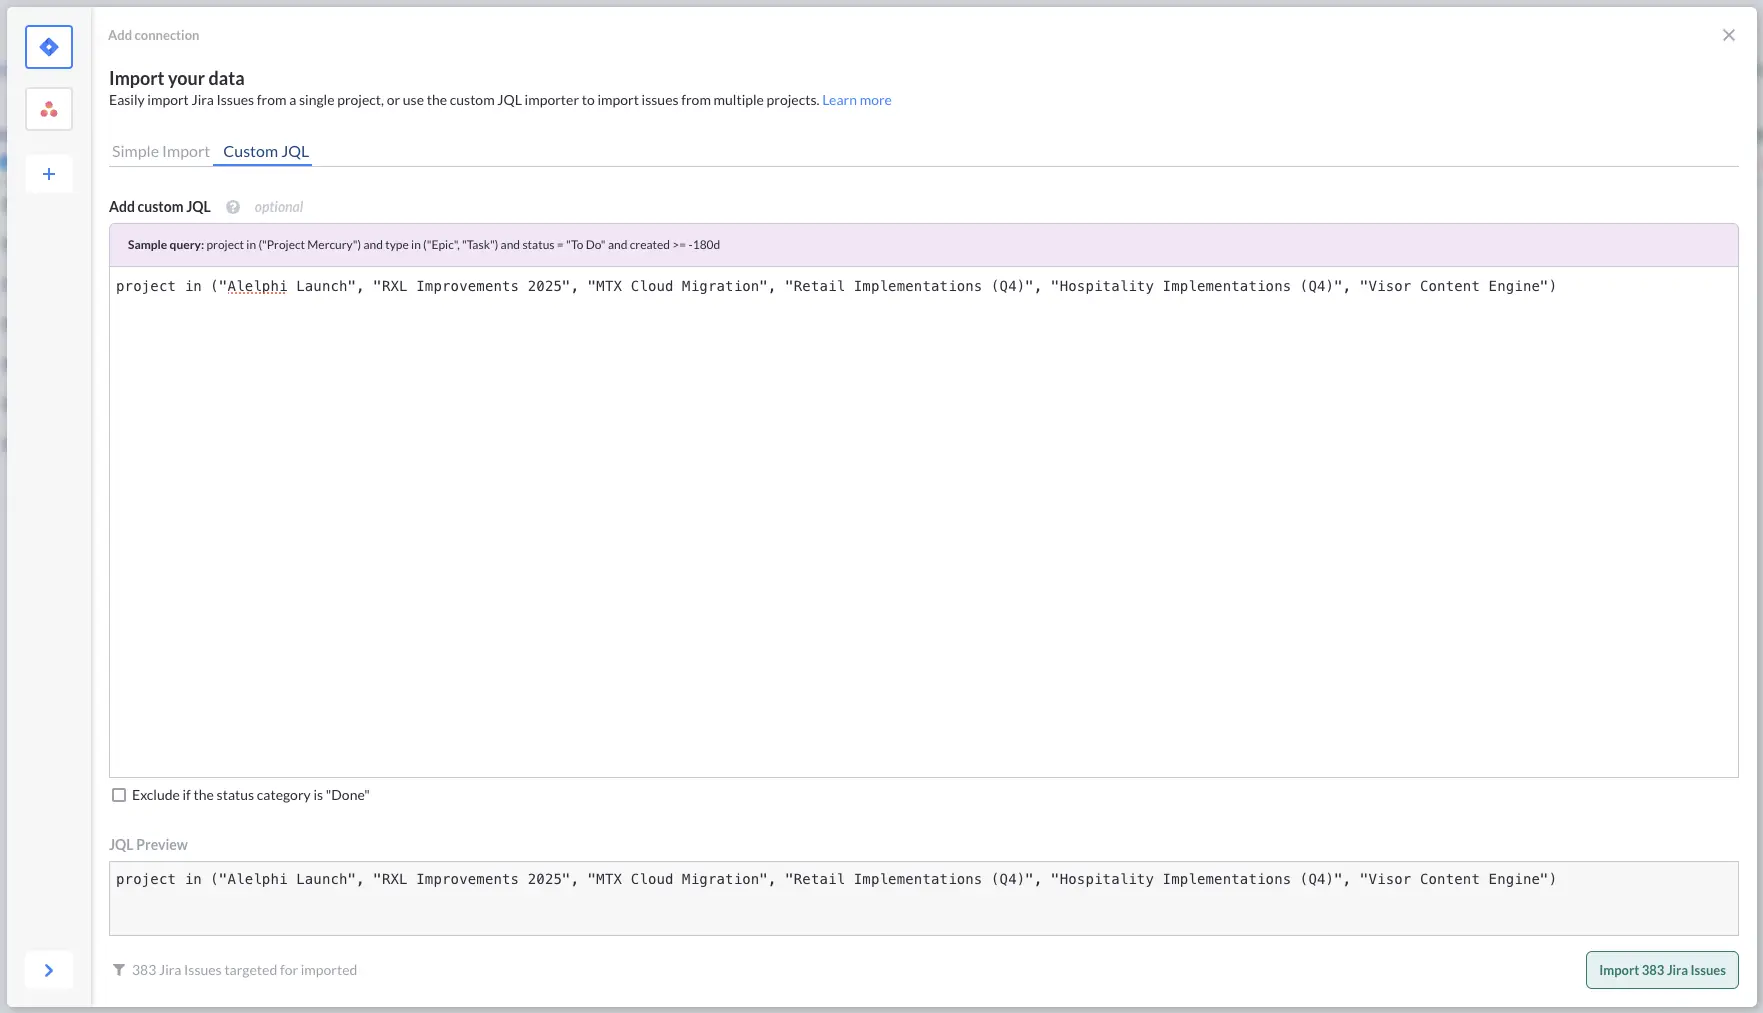
You can also use JQL to filter out certain tasks, for example by assignee, or by status, as shown in the screenshot below:
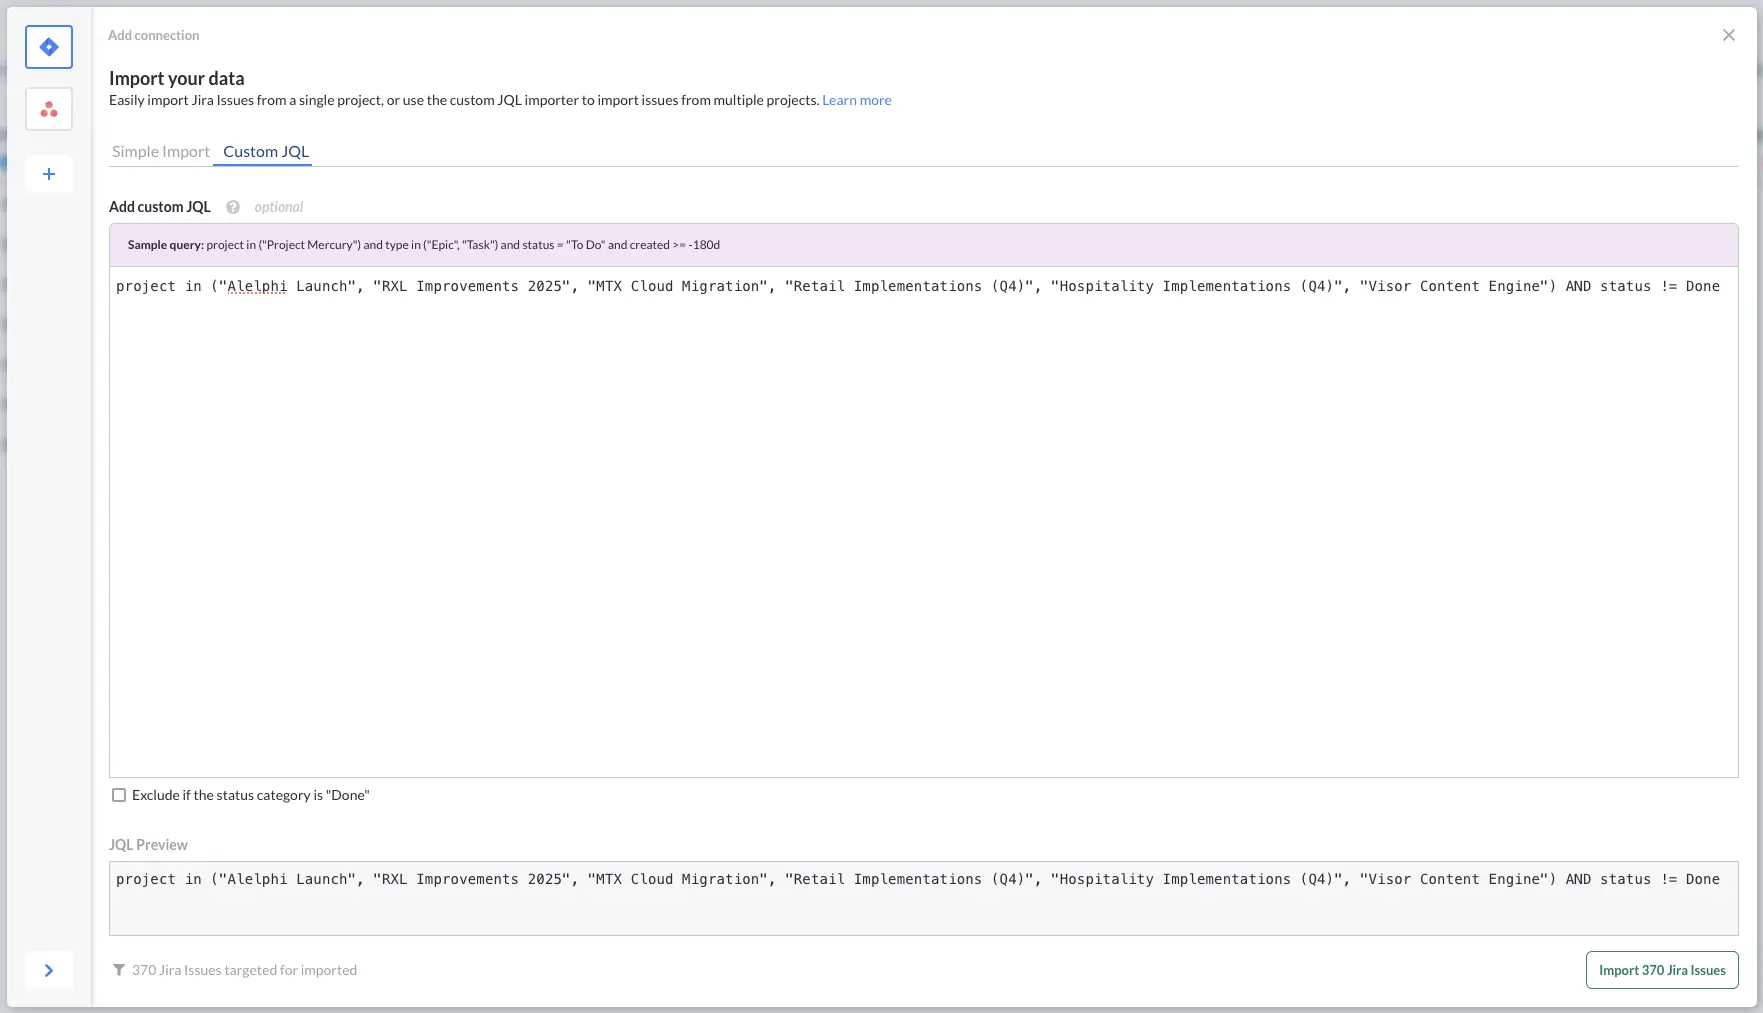
You will be shown a preview of the Jira issues that will be imported. If you’re happy click continue, if not you can tweak your JQL query until you’ve got the data you want.
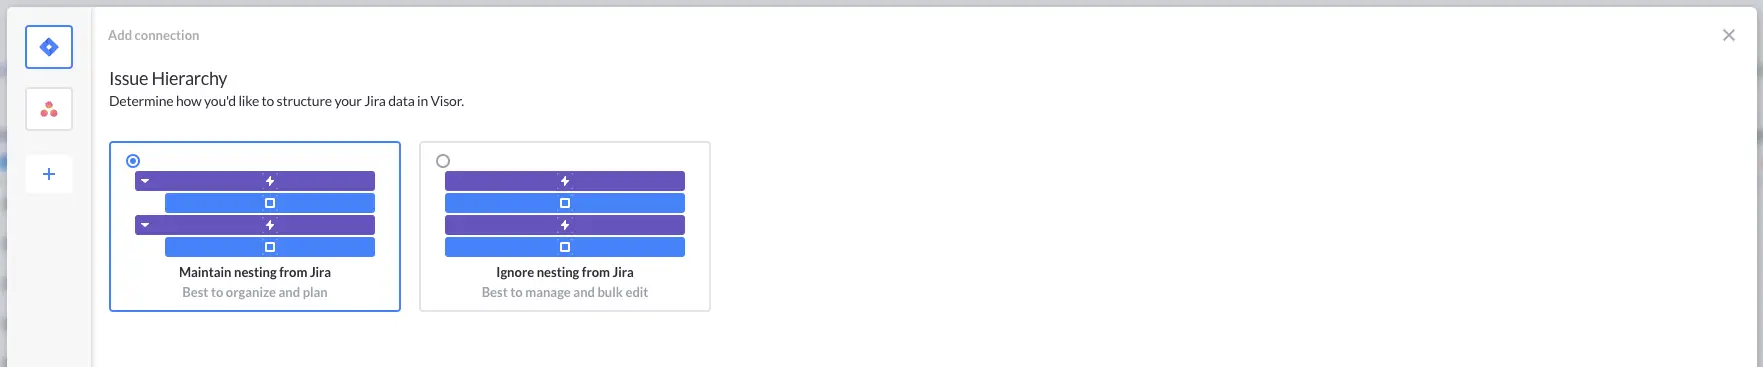
Then you have the choice of maintaining Jira nesting or not – maintaining nesting means tasks will be nested under their epics, subtasks under their tasks and so on:
Once published, you can share your Gantt chart with users that don’t have access to Jira, and embed them real-time Gantt charts in other apps. For example, many Jira users embed Gantt charts in Confluence to compliment their documentation and release notes.
Creating a Gantt Chart For Multiple Asana Projects (in Visor)
Creating a Gantt chart with multiple Asana projects in Visor is easy.
First connect Asana with Visor using their two-way integration. You can do this during the initial Visor setup or by clicking the connections button and selecting Asana.
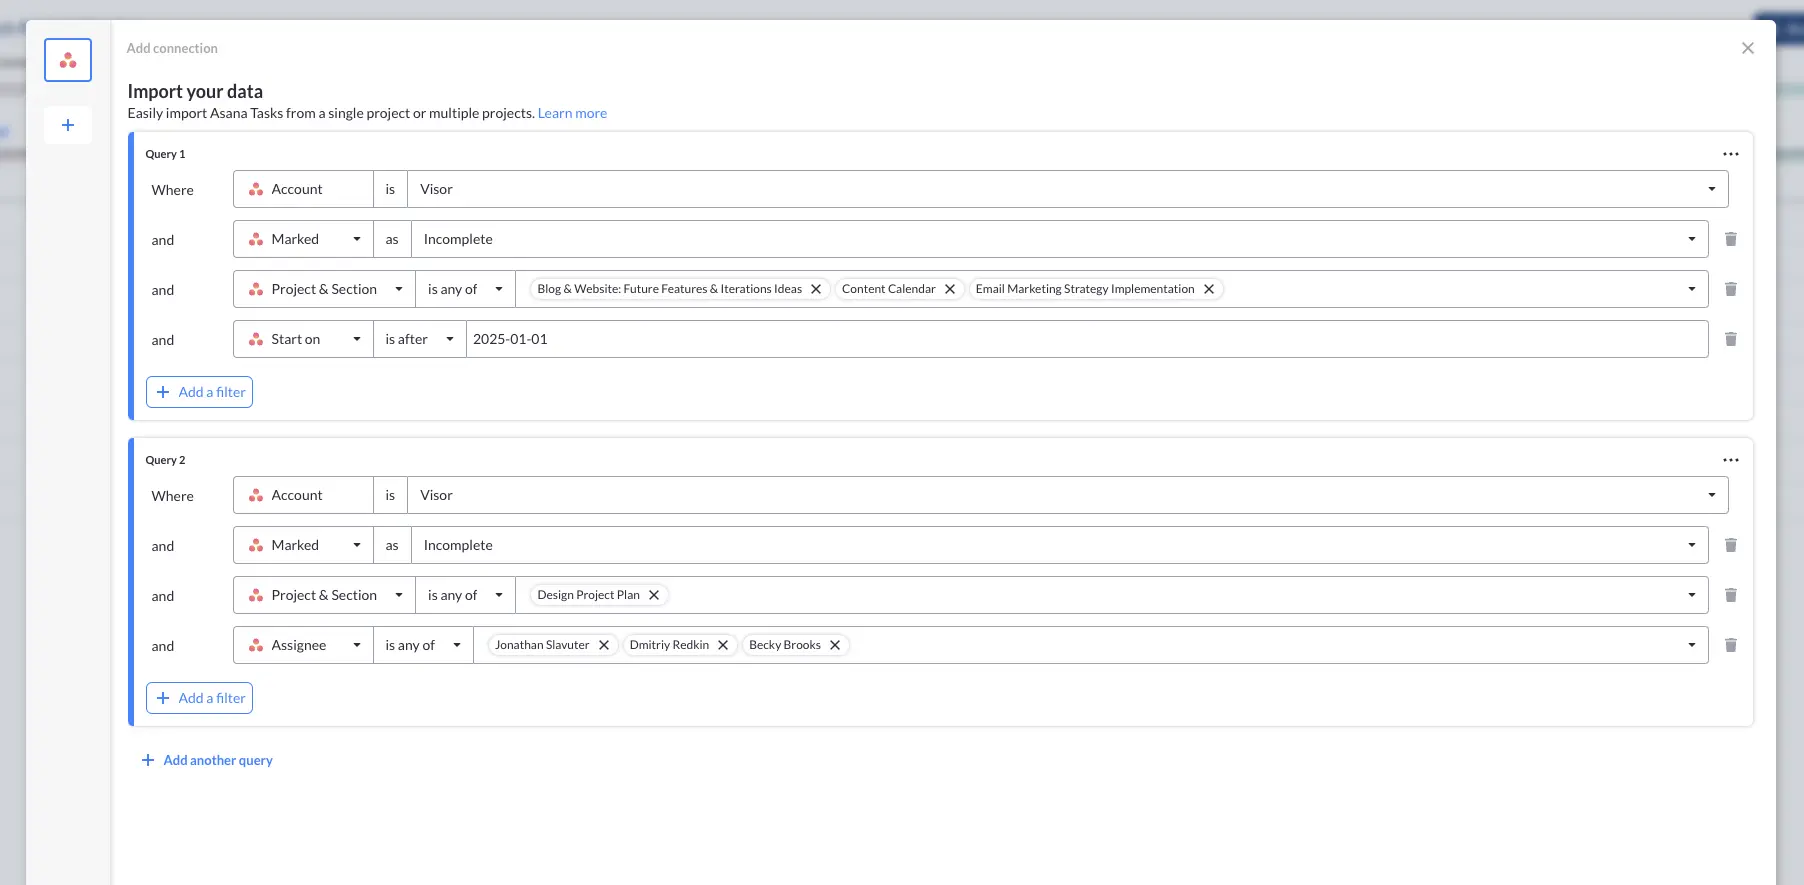
Next use the filters to select which projects you want to import from Asana:
Click “Continue” and your projects will import into Visor. Then follow steps 3 to 11 under “How To Create a Gantt Chart For Multiple Projects in Visor” above to complete the configuration of your Gantt chart.
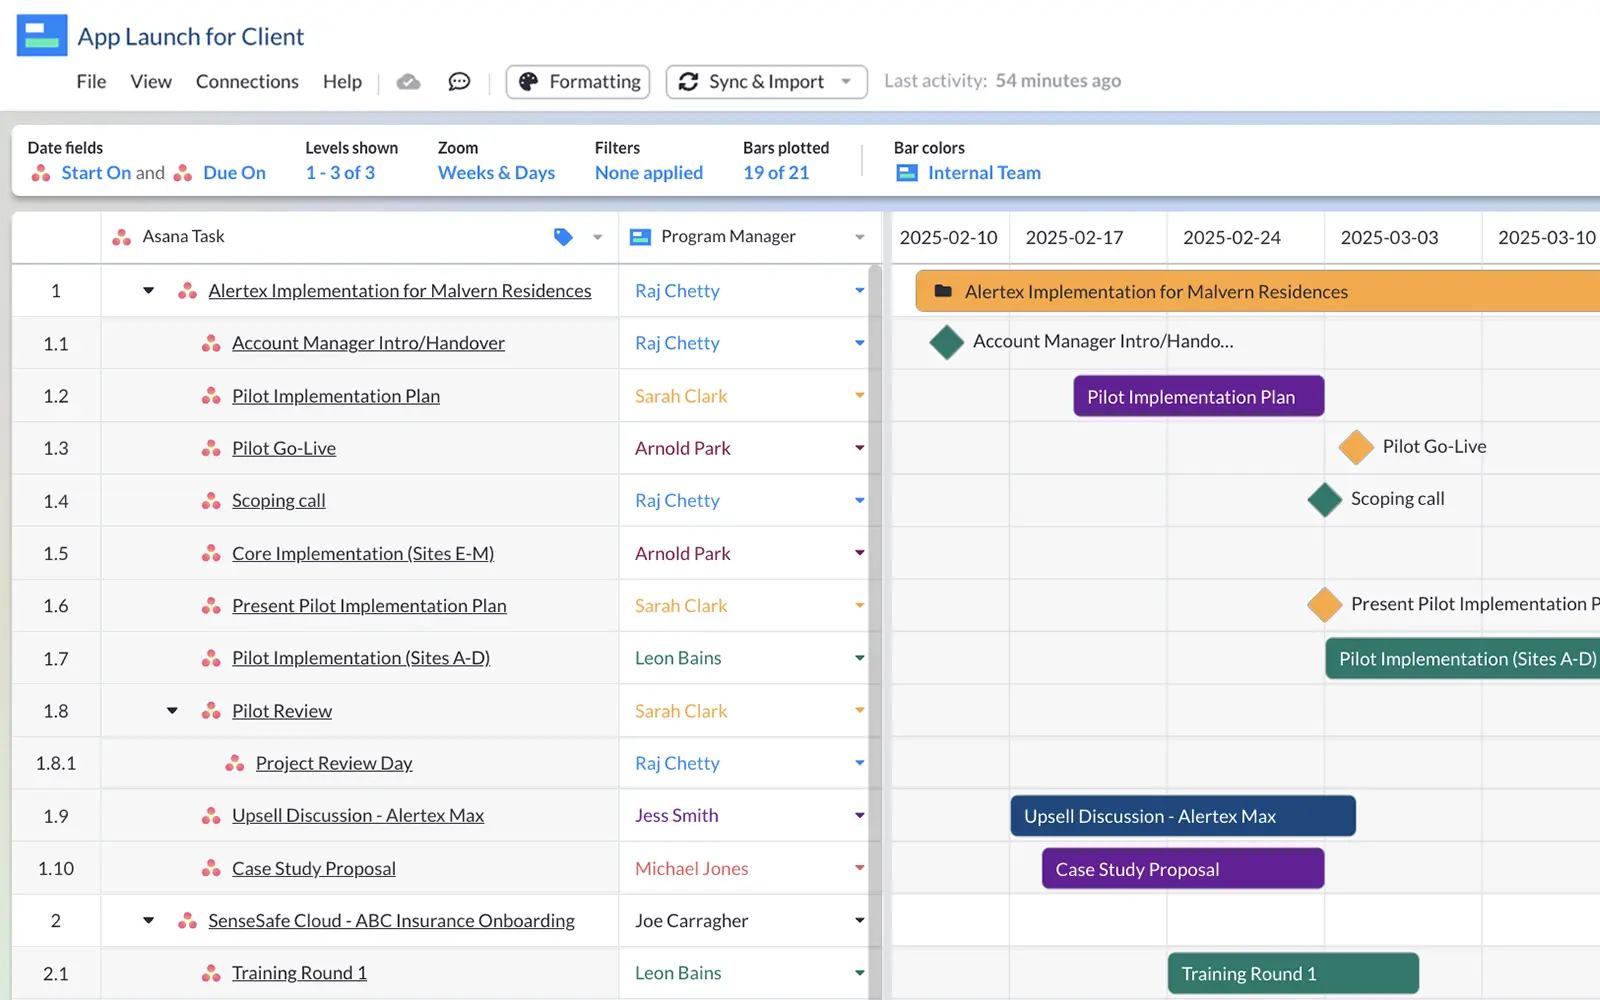
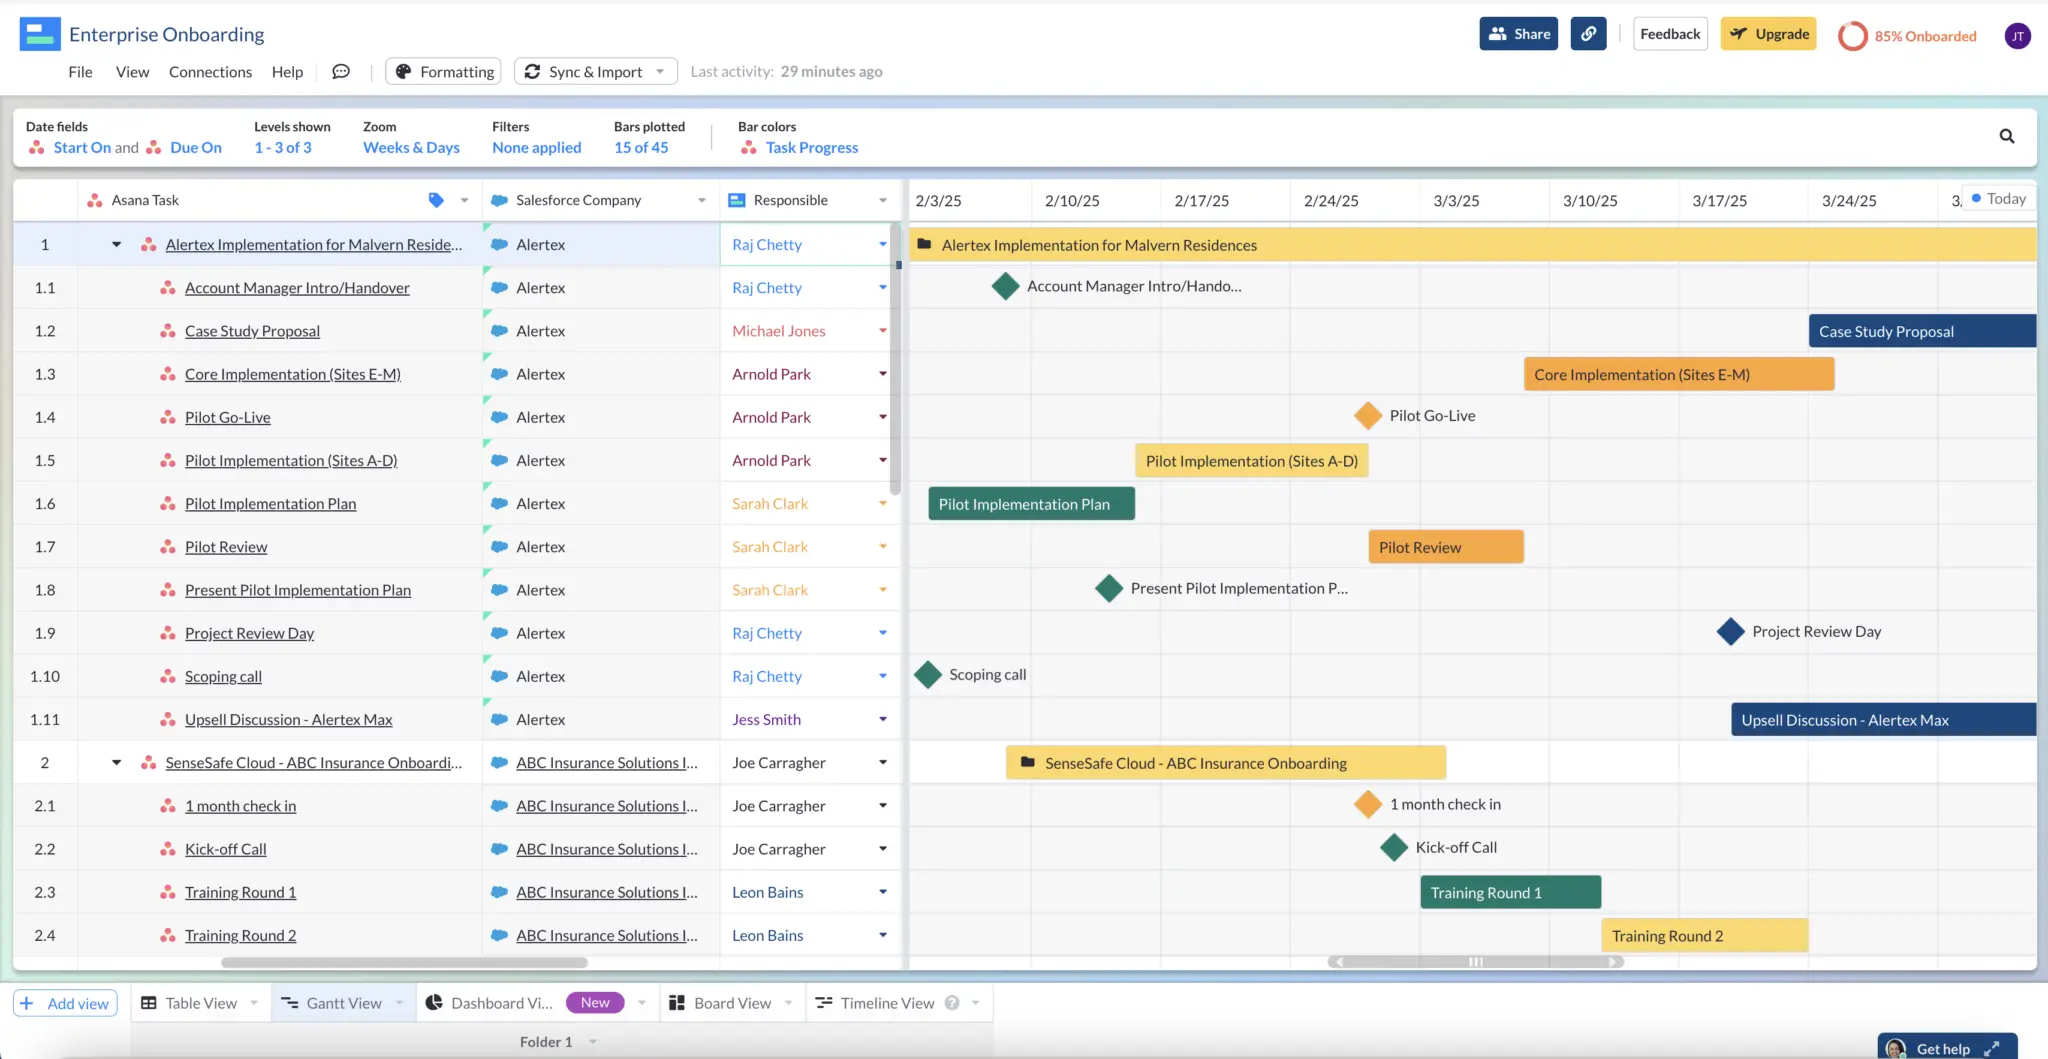
Closeup of an Gantt chart I created in Visor featuring multiple projects from Asana:
Creating a Gantt Chart For Multiple Projects, From Different PM Apps
Visor is unique in that you can use it to combine projects from different apps in a single Gantt chart.
This is a game changer when you need to make a holistic roadmap or plan that combines different business units’ projects. Or, if you need to supplement your project data with information from other apps, for example customer data from your CRM.
All you need to do is connect your apps to Visor by clicking the “Connections” button in Visor, select the app you want to connect and follow the steps to create the connection with the filters and settings you want.
Repeat this for your other apps and then you can open a Gantt chart view in Visor and you’ll see you can add any projects and fields from each app that you have connected.
For example, here is a Gantt chart for implementation projects, with the projects themselves coming from Asana and linked customer fields from Salesforce:
Using a Gantt Charts With Multiple Projects – Best Practice
OK, so you’ve added your projects onto one Gantt chart. Great, but how are you going to get the most out of it? How will it help you to plan, track, and oversee all these projects at a bird’s eye level?
Below are some key elements you’ll want to include in your multi-project Gantt chart to make it a project and project portfolio management tool that is full of information you can use to drive project success.
Build in Roll Up Calculations
Combining multiple projects on a single Gantt chart might give you a visual representation of your portfolios of projects, but without roll up calculations you won’t get the crucial summary details that enable you to manage on a project-by-project (or portfolio) level.
Roll up calculations summarize data from tasks and/or subtasks within a project, to give you a total, average, aggregate, or other summary calculation for that project.
For example, common roll up calculations in Gantt charts include:
- Project percentage complete
- Total hours scheduled minus total hours used
- Total budget used
- Task overdue rate (average)
- Days/Hours over schedule (vs. planned)
As you can tell, these project-level metrics give you an instant view of project performance that stays accurate and up to date without having to do manual calculations yourself. When placed on your Gantt chart, these calculated fields highlight areas of concern so you can take appropriate action.
You can create these calculations yourself in an Excel or Google Sheets Gantt chart, but that can prove to be clunky and fragile. Most people use a Gantt chart app like Visor, which has these capabilities built in.
Use Expanding and Collapsing Nesting of Tasks and Subtasks
If you’re visualizing multiple projects on a Gantt chart you will mainly be looking at details at a project level, rather than seeing the individual tasks that constitute a project.
However, there are many instances where you will need the ability to go a level deeper into a project to view at a task, or even subtask level.
For example, if a project is delayed, or its overall budget is going way beyond what was planned, then you’re going to want to dig down and uncover if there are any particular culprits and take action to get them back on track.
In order to do this you need a system that allows you to expand and collapse nested tasks and subtasks under projects on your Gantt chart, and ideally gives you the option of which levels you want to display on your Gantt chart.
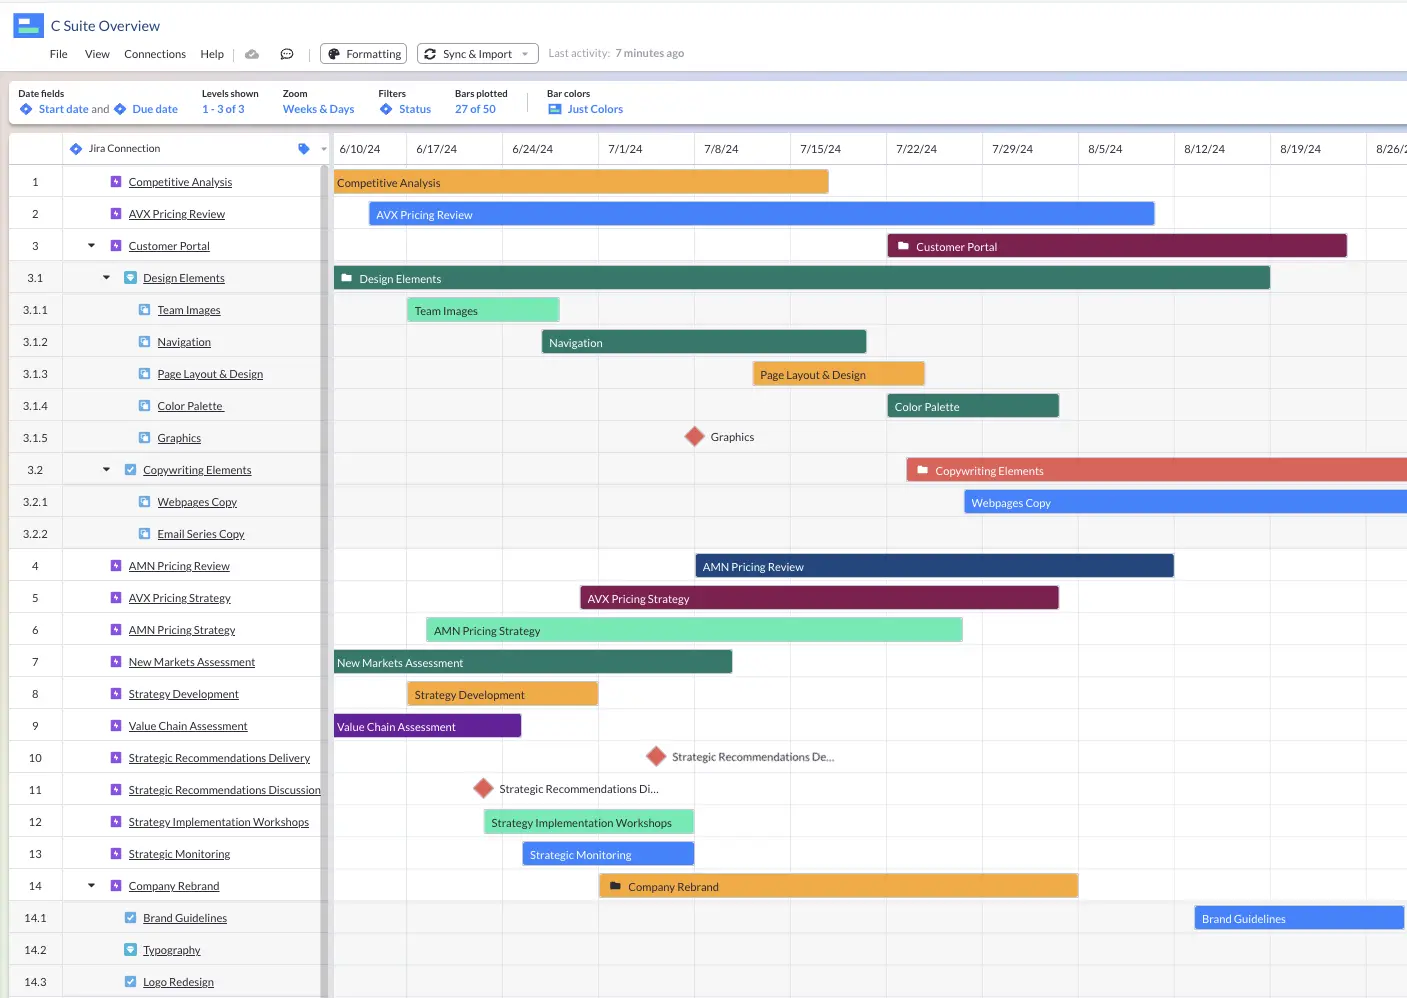
Tasks and subtasks nested under projects in a Visor Gantt chart:
Create multiple but synchronized versions of your Gantt chart
Some apps (like Visor) enable you to create multiple versions of your multi-project Gantt chart that use the same source data.
This enables you to create different versions of the Gantt chart for different stakeholders, teams, or tasks, without having to manually update any of them.
You can create different Gantt charts using the same data to serve up the right level of data for each audience (or for different jobs you may need to do) without having to manage and update any data yourself.
A Gantt chart (roadmap) I created in Visor for my C-Suite containing epics from multiple Jira projects. Note only the epic level of task/issues is shown:
Best Gantt Chart Apps For Showing Multiple Projects
Many Gantt chart apps and project management software will tell you that you can use them to create Gantt charts for multiple projects, and this is usually true!
But many of these apps don’t have the necessary features and functionality to make multi project Gantt charts truly useful and practical.
Putting all your projects on a single Gantt chart is not the same as being able to quickly understand key aspects of performance, including:
- Performance by project
- Capacity and resourcing across projects
- Dependencies between tasks in different projects
- Budget consumption and availability across your portfolio of projects
- Trends and patterns across multiple projects
And other key capabilities that are crucial to achieve the goals that led you to create a multi project Gantt chart in the first place.
Based on my own experience using different project and portfolio management apps, here are the best for creating and using Gantt charts with multiple projects:
Visor
Visor is a versatile project portfolio management tool that makes it easy to create beautiful multi-project Gantt charts that you can share with all your stakeholders and collaborators.
Visor’s Gantt charts include roll up calculations, cross-project dependencies, and flexible nesting, combining maximum flexibility with actionable insights into project and portfolio performance, to support your strategic decision making.
Bi-directional integrations with Jira, Asana, and Salesforce, mean that your project management apps and your Visor Gantt charts stay in sync, preserving your single version of truth.
Visor is ideal for you if you need a way to create stunningly clear Gantt charts featuring multiple projects quickly and easily. Especially if you want to use project data from other apps.
Price
Visor has four pricing plans:
- Free plan ($0 per user per month)
- Starter Plan ($18 per user per month – with a free trial available now)
- Team Plan ($24 per user per month – with a free trial available now)
- Business Plan ($525 per month – unlimited users)
MS Project
Microsoft Project is a robust project and portfolio management tool. It has a huge range of features and functionality to support intense portfolio management, including the management of multiple projects simultaneously. This has made it a mainstay of experienced program managers at large, complex organizations.
I would place MS Project second behind Visor, because although it has more functionality, much of this will be irrelevant to the majority of people creating a Gantt chart with multiple projects. Additionally it lacks integrations with project management apps like Jira and Asana.
The complexity also adds a massive learning curve to accomplish basic tasks, and most MS Project users require dedicated training. MS Project has been around for a long time and has accumulated a lot of baggage (some useful, some cumbersome).
While MS Project’s Gantts might not look very attractive, it is still the Swiss army knife of project portfolio management systems for those who need it and have the training to use it properly.
Price
- Standard: $679.99 (One off payment – no trial available)
- Professional: $1,129.99 (One off payment – no trial available)
Why use Visor to create a gantt chart with multiple projects?
Now you should understand how to create a Gantt chart with multiple projects using an app like Visor, and the key elements to include in your multi-project Gantt chart to ensure it helps you manage your project portfolio and improve its performance.
Visor is ideal for creating Gantt charts that include multiple projects. It has a level of flexibility that most Gantt chart apps don’t have, and that users need when they are working with multiple projects.
While most apps are designed to handle one project at a time, Visor excels when you need to work with multiple projects, or even multiple projects from different apps.
You can try Visor for free now, and there’s also a Free plan if you decide that’s better for you at the end of your free trial.