Project Health Checks – How To Improve Yours
Project health checks are an essential but often overlooked aspect of effective project management. Here I’ll explain why, and how you can implement project health checks, metrics, and indicators to ensure your project stay on track.
It all seems fine. Your project is clicking along, everyone is doing their jobs, and you’re coming in at budget and on time. Until suddenly, seemingly out of nowhere, something takes the project completely off the rails.
If only there was a way to catch onto problems before they started.
Well, luckily enough, there is. Project health assessments are a proactive way to spot potential problem areas before they get out of control, and diagnose ways to keep your project on track.
The only problem is that these checks can themselves slow down or throw off your project’s flow. To fix that issue, Visor has devised a method of integrating project health assessments into your process. Here’s how we recommend you tackle it so that it feels like second nature.
If you need a better way to gain end-to-end insight into your team’s projects, way before you need to check their health, try Visor. This free tool is an intuitive, easy to use spreadsheet that pulls data from your other tools to create a single source of truth.
What is a project health check? When do you need them?
A project health check is a process of assessing if a project is meeting objectives and adhering to best practices. The purpose is to help make sure a project is clicking along properly, and to ID problems before they grow big enough to impact your overall project.
You ideally want to go through with a health check before you’ve seen a problem, though they can also serve as the first step of management and mitigation once a problem arises.
The problem, of course, is the same as any other element of a process that’s intended to be used “before it’s needed” – they’re easy to de-prioritize. And when you de-prioritize these types of tasks, you won’t have the best opportunity to use them, so they seem useless when an actual problem surfaces, and then you’re so busy fixing the problem that you’re less likely to use the process next time and so you de-prioritize using it and then…
You get it. It’s a vicious cycle. But it’s one you can break by breaking the health check procedure down into smaller, more manageable chunks.
We recommend you think of it like “micro-cleaning.” Instead of tackling every task all at once, you spend a little bit of time doing a small task each day or week, then repeat. It forms a habit while feeling like much less effort.
A Visor Table view used to monitor project health and conduct checks:

Let’s start with what you’ll want to be checking, then get into Visor’s methodology. We won’t be getting into what to do when an item falls short on an audit in this article, but we’ll publish more on that soon.
Project Health Indicators To Look Out For
There are as many different elements to assess for project health as there are projects. Here’s a few examples, along with some of the questions and indicators you might want to explore.
- Goal progression
- What were the original goals of the project? Is the project on track to meet those goals?
- If not on track, where is it falling short?
- Do the goals need to change, or does the project?
- Risks
- Are there any identified risks you need to be concerned about?
- Are there new potential risks that have arisen over the course of this project?
- How can you mitigate risks at this stage?
- Budget
- Where is the project in terms of budget expenditure?
- Has the budget changed?
- Does the budget need to change?
- If the team is coming in over-budget, what can be done to help?
- Resource management
- Is the flow of resources healthy?
- Does the team have everything they need to do the work?
- Is anything missing?
- Do you have the tools you need for these tasks?
- Are there tools you’re not using?
- Are all tools being used correctly?
- Do you need new or different tools?
- Quality control
- Is all work being produced up to the quality standard expected?
- If work is falling short of the bar, what can be done to improve the quality?
- Stakeholder engagement and approval
- Are all stakeholders up to date on necessary information?
- Are stakeholders appropriately informed and engaged?
- Are there areas where stakeholders have expressed concern or feel changes need to be made?
- Team responsibilities
- Are team members working on the right tasks for their job?
- Is team bandwidth being utilized effectively?
- Should tasks be re-allocated? How?
- Best practice adherence
- Is this project sticking to chosen methodologies?
- Are all other aspects of this project in line with known best practices?
- Is more education needed for the team on best practices and, if so, where and how?
- Communication
- Does everyone know who to go to for various needs?
- Is everyone communicating in the right ways?
- Are communications happening in the right places?
- Is everyone following the same communication guidelines?
Project Health Metrics & How To Use Them:
Project health metrics enable you to measure overall project performance and health, and quickly identify areas of concern. You can use project health metrics to identify issues and even trends earlier, so that you can take action to address those issues and get your project back on track before it deteriorates.
There’s a list below that shows you the most important project health metrics, broken down into categories.
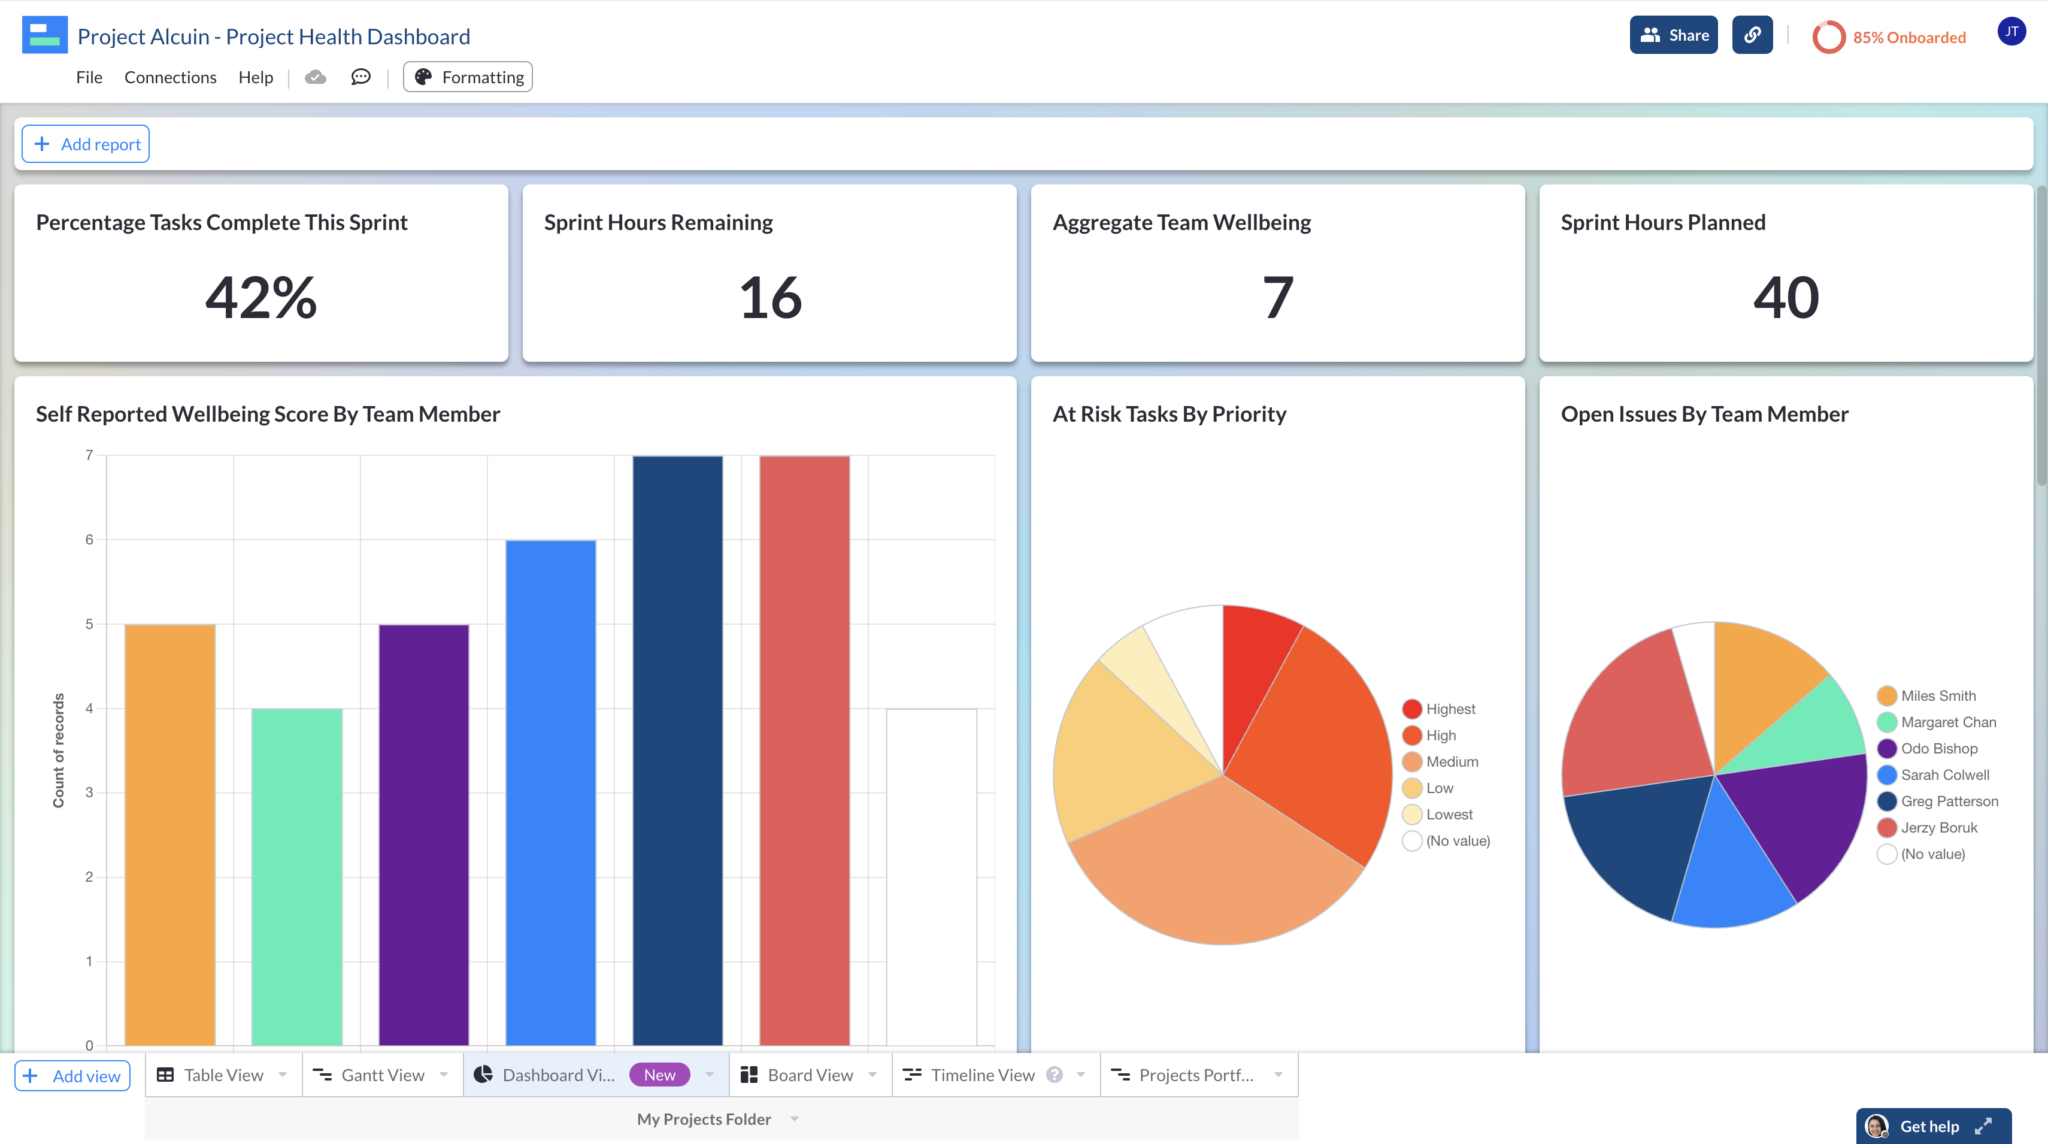
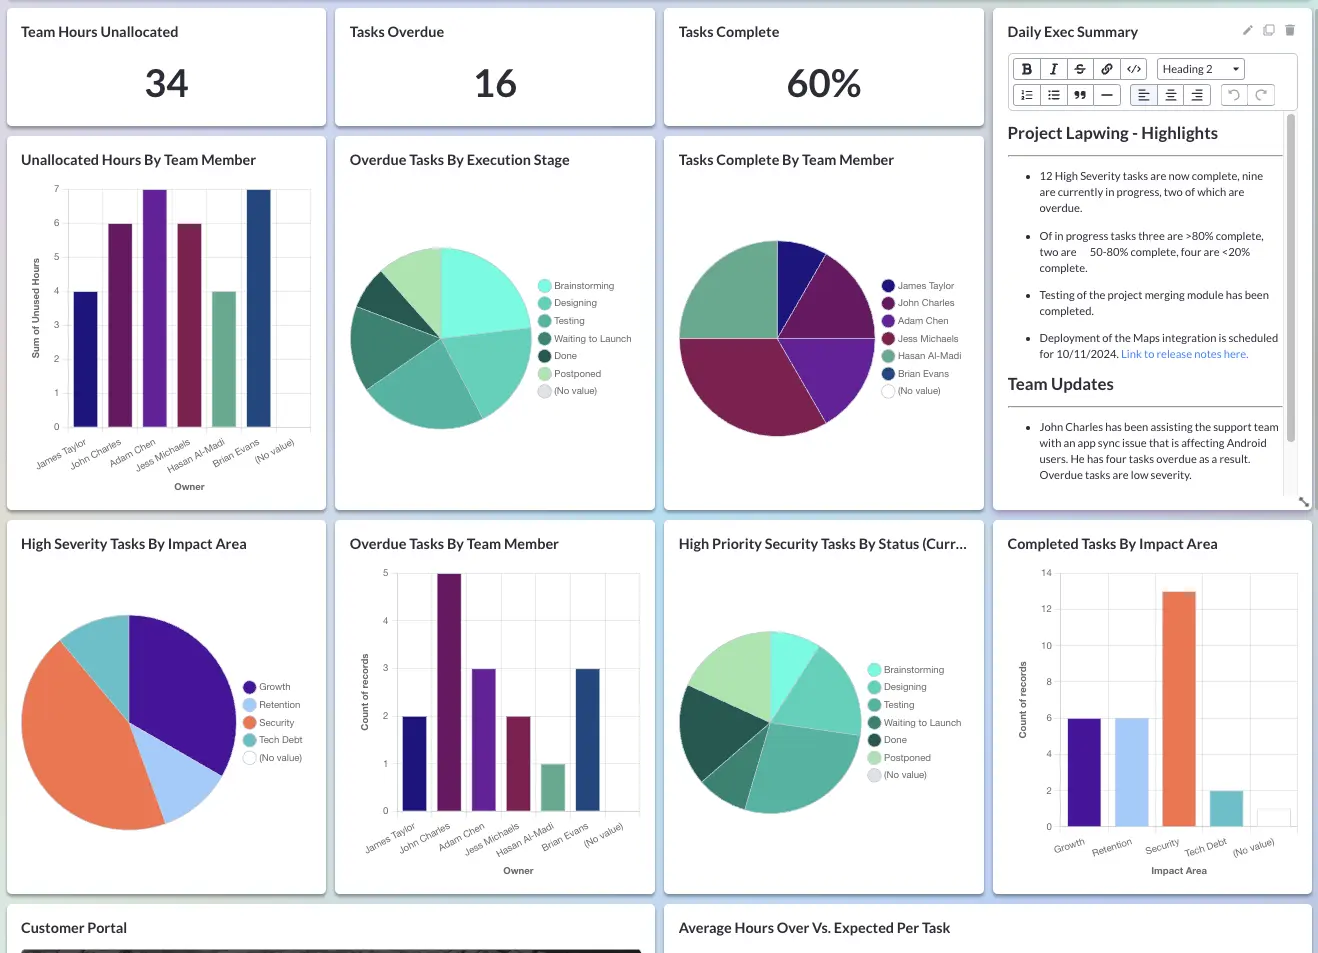
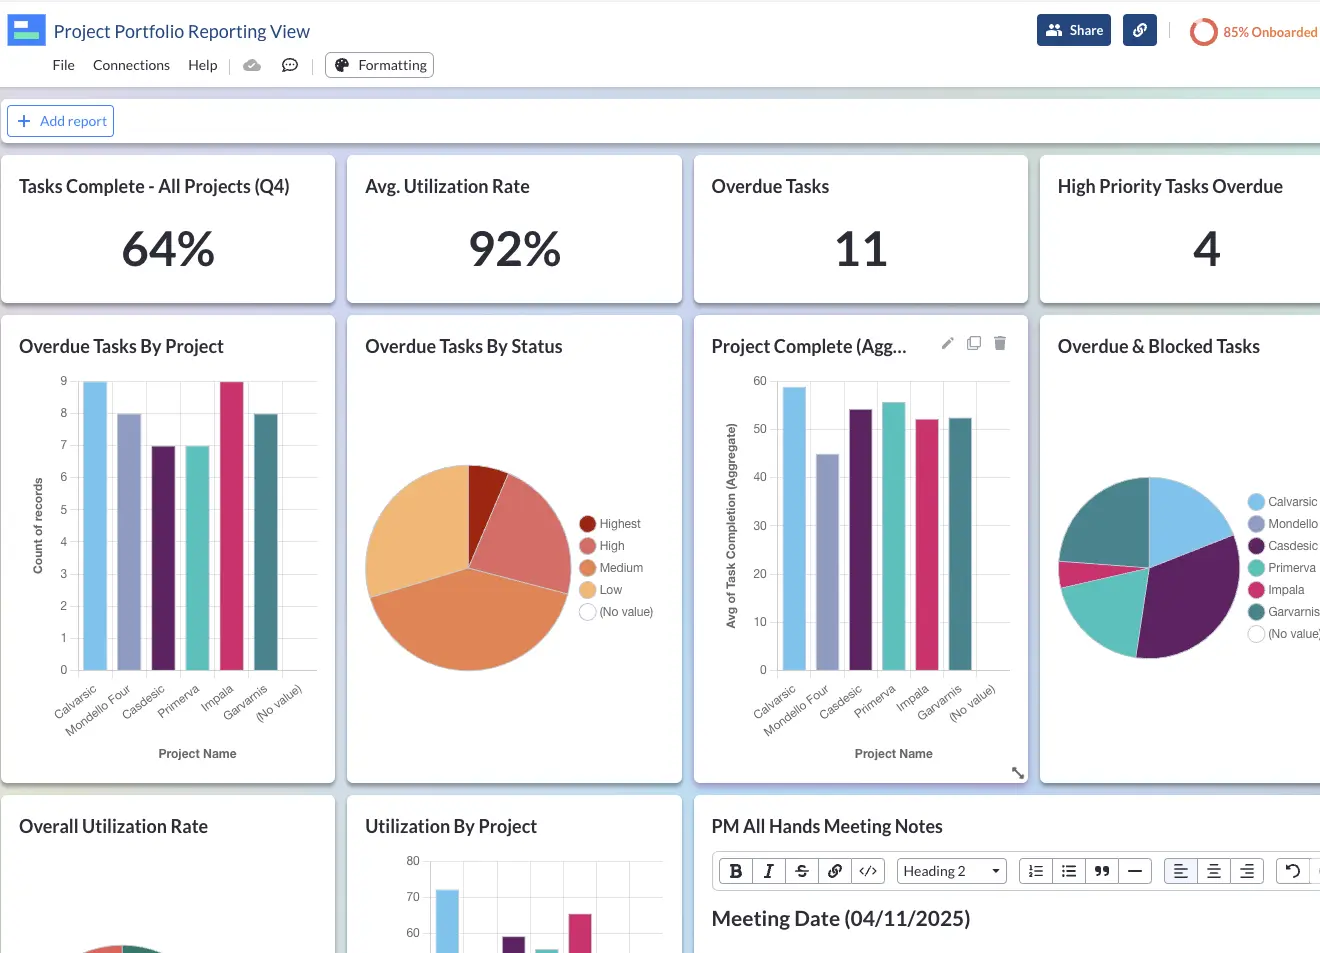
If you’re using Visor’s Dashboard view you can track these metrics with precision to uncover what’s causing any issues.
Examples of a project health dashboards that you can create using Visor, to track some key project health metrics:
And here’s another example of a dashboard you could easily make in g Visor, to track project health (and lots of other) metrics:
Schedule/Timing Metrics:
These metrics help you to determine if your project is on track, if you have any significant delays, or if your project is encountering frequent delays, which could indicate deeper underlying resourcing or planning issues.
Timing/Schedule Metrics Include:
- Planned vs actual timeline: Does the project’s planned start and end dates, and overall hours planned, match up with the actual planned start and end dates. What is the delay? What will be the impact? How can it be mitigated?
- Milestone Achievement: What percentage of milestones are being completed on time?
- Task On-Time Rate: The proportion of tasks completed on time or early, expressed as a percentage.
- Task Overdue Rate: The proportion of tasks that are overdue, or were completed late expressed as a percentage (you may choose to include open tasks, or completed tasks only).
- Burn Rate: Tracks what proportion of tasks are being completed, and how quickly. Typically used in software development and often shown in burndown charts.
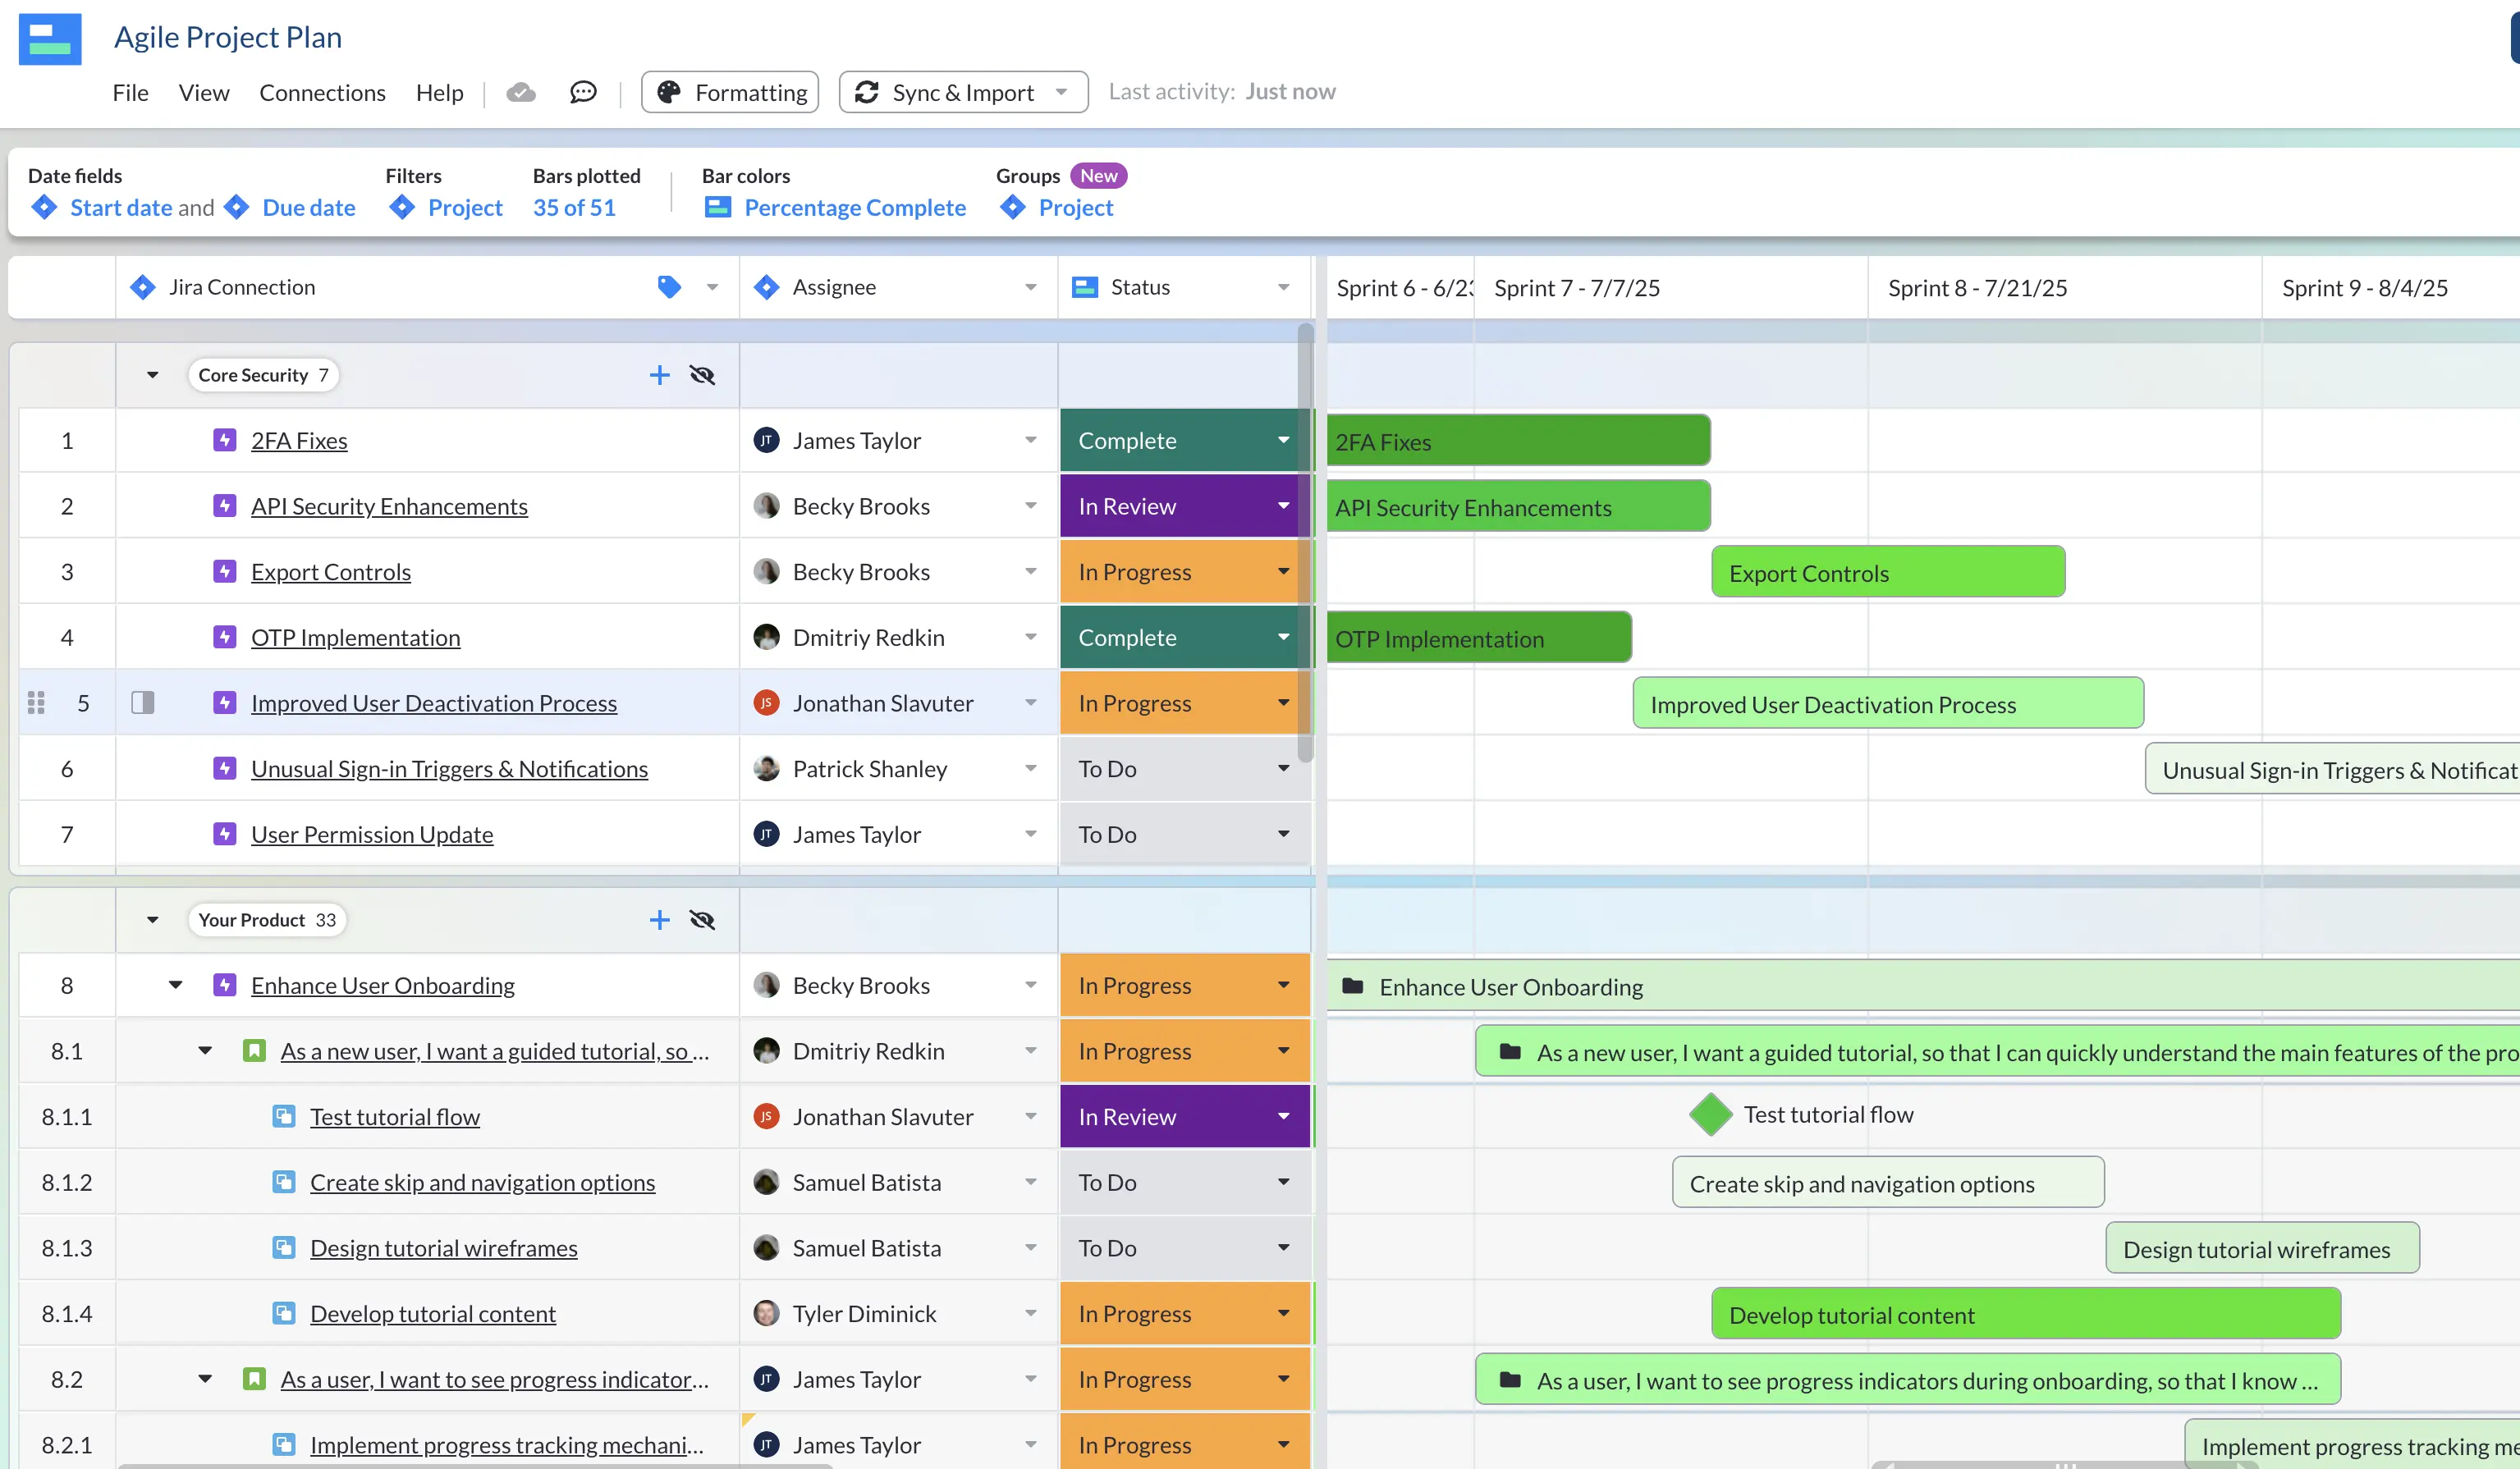
You can use tools like Visor to create Timeline views, or alternatively, Gantt charts, to track how completed tasks are progressing against their expected due dates.
A Gantt Chart using Visor’s Agile Project Plan Template:
A Gantt Chart Using an IT Project Plan Template in Visor:
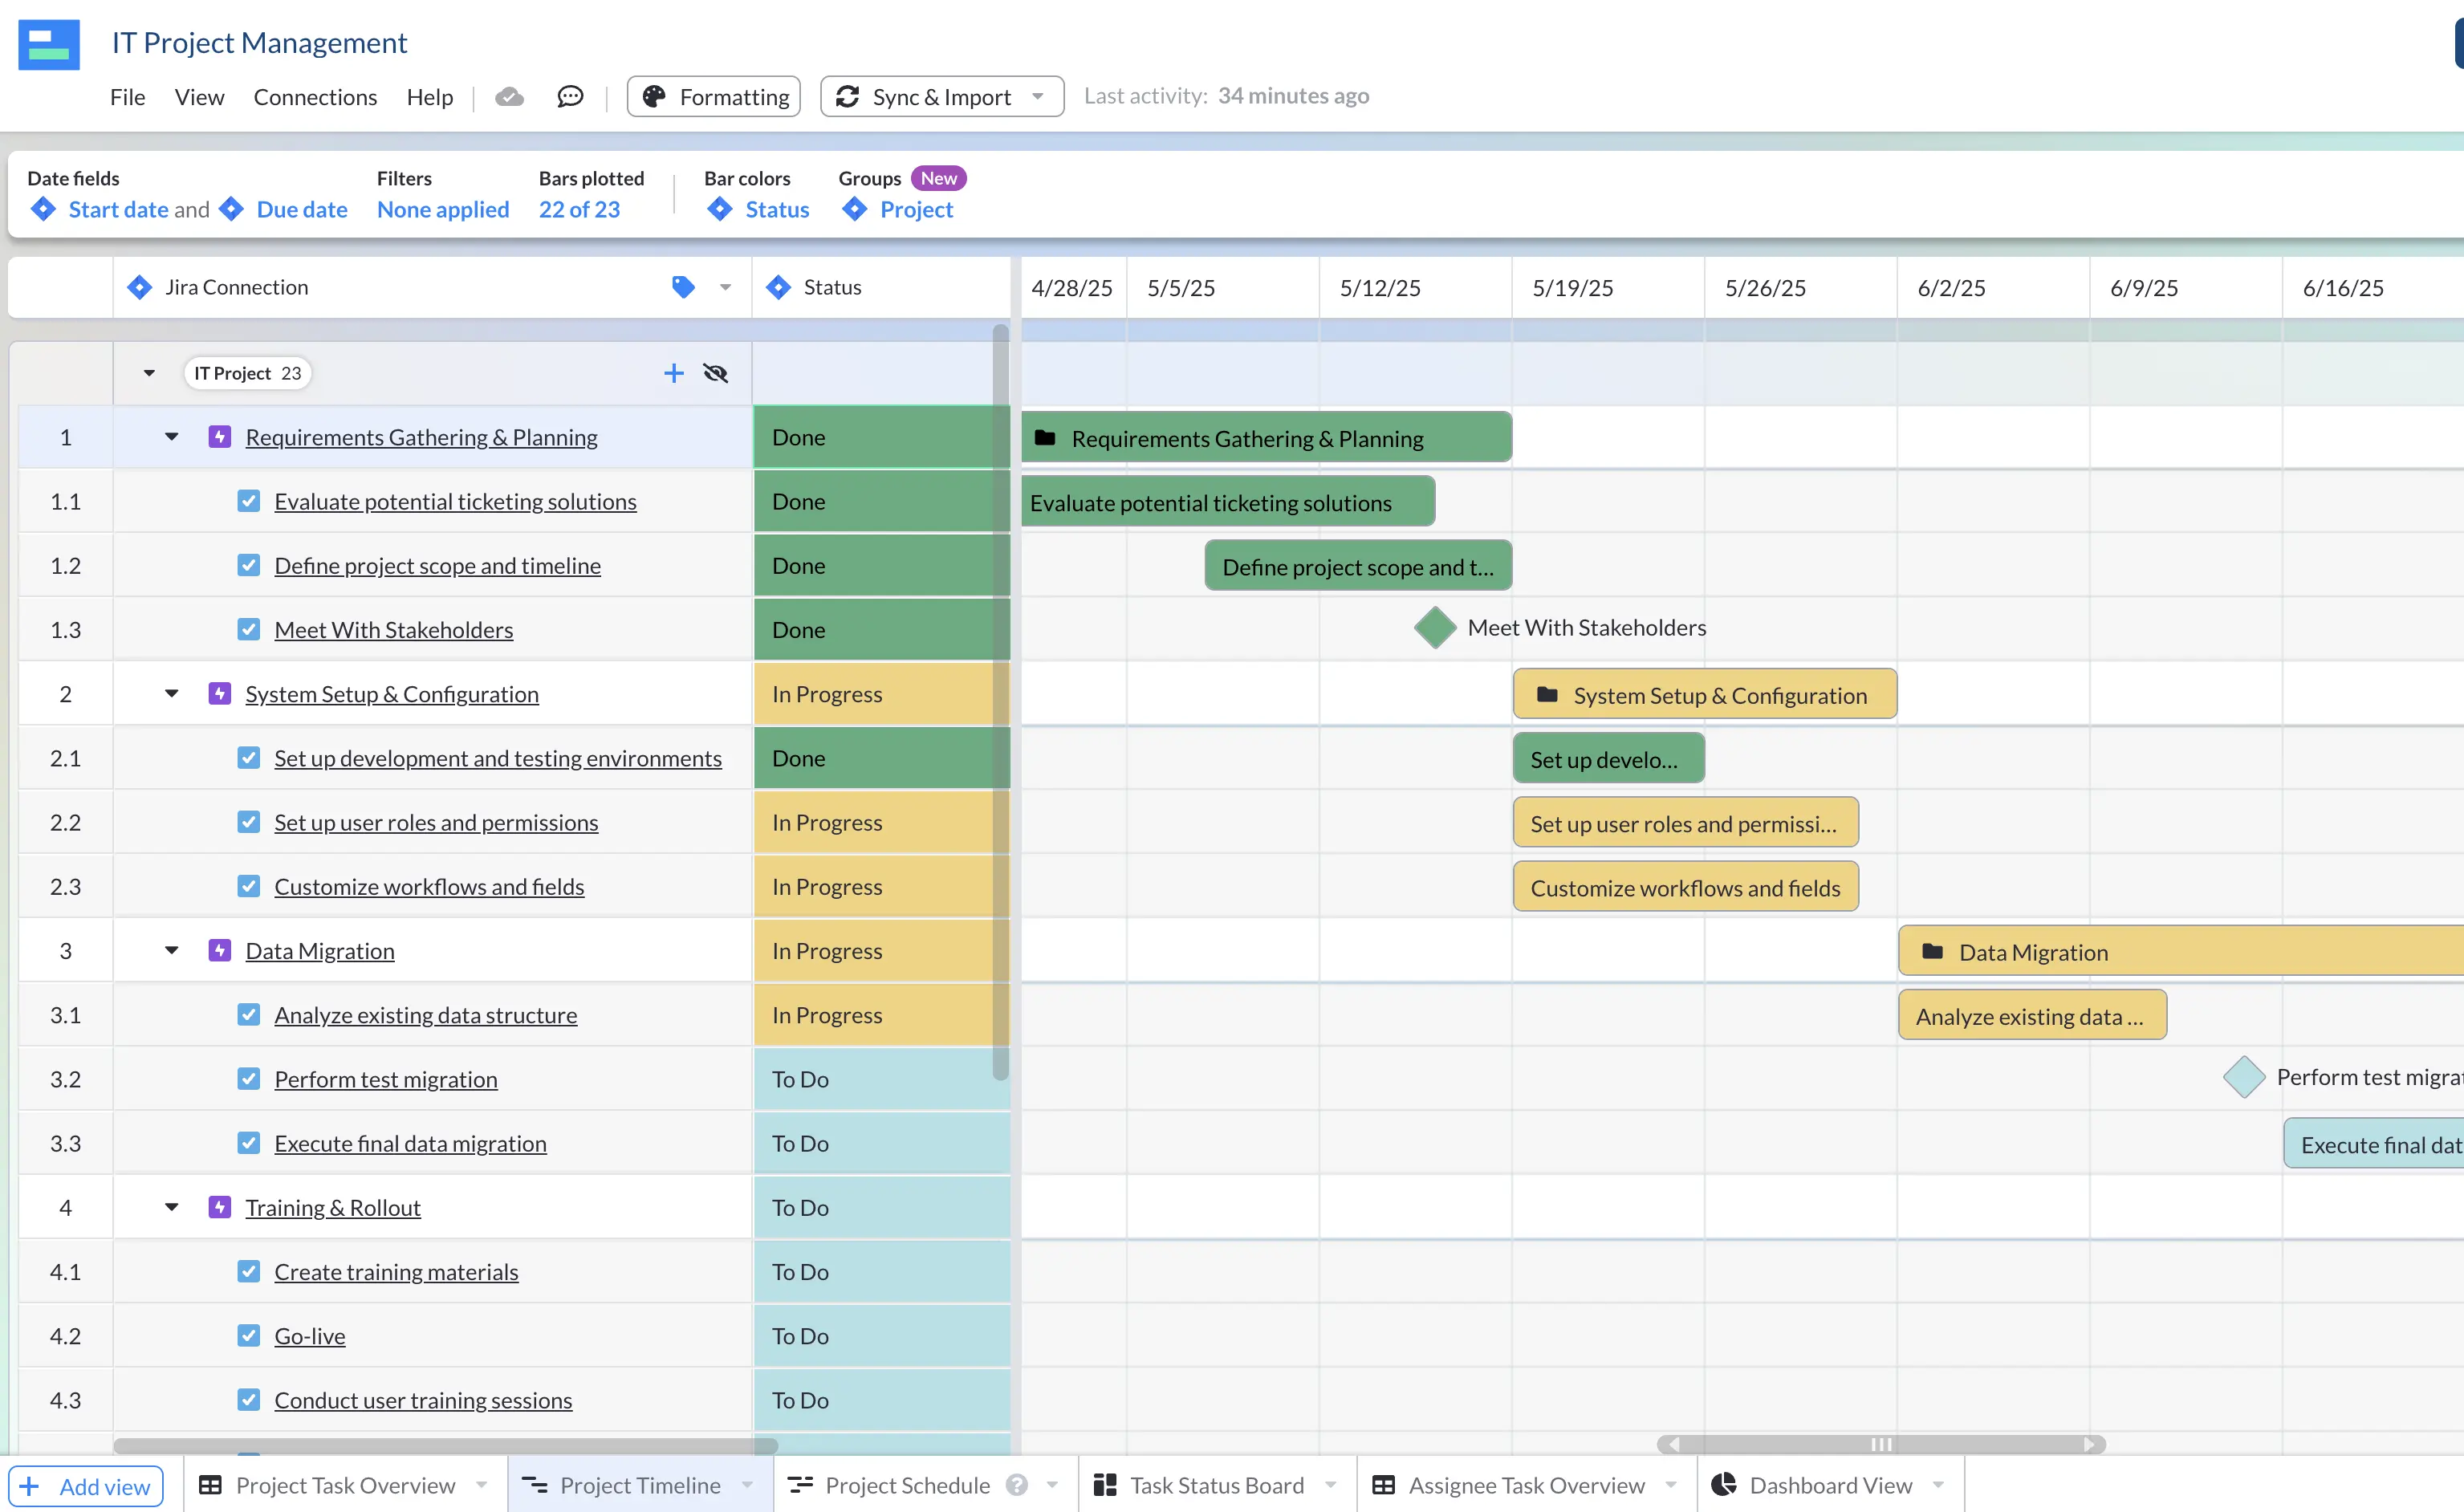
The Gantt chart view in Visor, Timeline ciew, and all other views are connected so that as people progress or complete their tasks (for example in the Kanban board view), the Gantt chart and timeline are updated in sync.
You can also use Visor’s two-way integrations to visualize, manage, analyze, and share your live project data from apps like Asana and Jira.
Resource Metrics:
Resource metrics measure how over or underworked your team is. Being able to quickly see who has extra capacity means you can ask for their assistance with tasks that have fallen behind schedule and need an extra pair of hands.
Conversely, seeing which individuals or teams are over-stretched can help you take steps to avoid burnout in your projects, and to assess whether tasks those teams or indviduals are planned to work on next or simultaneously might be compromised as they don’t have the necessary capacity to complete them.
Resource Metrics Include:
- Utilization rate (by project, team, or individual)
- Absence rates (by project, team, or individual)
- Average hours over allocated (by project, team, or individual)
- Team satisfaction or engagement measures
Quality Metrics
Quality metrics give you an indication of whether the project tasks and outputs are being completed to a high-enough standard. Low quality outputs typically cause further delays as they’re improved or fixed. This is true whether you’re delivering an advertising campaign or developing a new app.
Maintaining a high level of quality in your deliverables leads to:
- Reduced friction
- Reduced delays
- Improved team morale
- Better customer/stakeholder satisfaction
Quality Metrics Include:
- Defects or Bug Counts (or amendment/review rounds in sectors like marketing or design)
- Bug resolution speed
- Customer Satisfaction/NPS Scores (both now and how it has changed over the lifetime of the project – plotted on a line chart)
- Average bugs per epic (for agile development teams)
- Average reworks or amendments per task (for other teams)
- Deliverable rejection and acceptance rates (what percentage of deliverables were accepted as delivered or with a small number of changes).
Budget and Cost Metrics
Along with time, and your people, your budget is the finite resource you need to track and preserve in order to ensure your project is a success. A project that satisfies the brief, is on time, but over budget is not a truly successful or healthy project.
Budget and Cost Metrics Include:
- Budget Burn Rate: How quickly are project funds being consumed compared to the planned spend timeline. For example, for these completed tasks we had expected to spend this amount, or by this time in the project we had expected to spend this vs. actual spend.
- Cost Performance Index: The ratio of Earned Value divided by Actual Cost
How to Conduct the Health Assessment
Remember what we said about this being like micro-cleaning? The idea is that you don’t need to run a complete and full project health assessment in one fell swoop. Instead, you’ll bit off small Chunks, Spread Out According To
Step One: Identify What You Actually Need To Check
Not every project needs every element checked. Sometimes you’ll already know that particular things are going according to plan, like a budget where the money is already spent and there’s no way to spend more. Sometimes certain elements won’t be relevant, such as resource management if the only “resource” is time that can be rolled into personal checks.
Create your own list of the areas you need to check, and customize as part of kicking off each new project.
Step Two: Build A Schedule
How long is this project expected to last? If it’s a short-term project, maybe you check on one element every day. If it’s longer term, maybe you do one check per week.
Just like with your list, you’ll want to set up a new schedule to reflect each project’s needs at kick off. Consider making each check item a task or milestone item in Jira or Visor to help you stay on top of the plan.

Step Three: Run The Check
You want to go line by line and do an active problem elimination. For each area you’re checking, note what you’re looking for and what counts as falling short of the bar and have a plan to follow up on places where you’re not pleased with the results.
If you’re checking the health of a team’s responsibilities, what is it you’re looking for? Perhaps it’s bandwidth and stress. In this case, you’ll want to offer each team member the opportunity to assess their own bandwidth and report back to you on a standardized scale, such as rating their workload from 1 (too light) to 4 (too heavy). Before sending that assessment, you’d want to know that 2 (light but productive) and 3 (heavy but manageable) are the bars, and have a plan for following up with team members who list a 1 or 4.
Each check will likely need to be done in a different way, which is another benefit of separating them out. Some methods of assessing project health include:
- Questionnaires – A short series of questions that turns conversational data into measurable numbers. These are great for team temp checks, stakeholder involvement, and quantifying qualitative information.
- Meetings – They might be informal, formal, 1:1s, or group workshops. Meetings are ideal for interpersonal information gathering like team stress assessments, but they’re also a good fit for ephemeral line items that cannot be formally measured, such as stakeholder approval.
- Data reviews – Perhaps the most simple method, this involves reviewing existing hard data. Best used for concretes like budget, timelines, and progress metrics.
Keeping in mind that problems are often inter-connected, don’t let yourself get too bogged down. Because you’re only checking one area at a time, you don’t need to set aside problems as they arise in favor of continuing to look for other issues. This method is more agile, because it allows you to tackle one issue at a time, as they arise.
Step Four: Repeat
The beauty of method, and the reason it’s so habit-forming, is that you never truly stop checking.
Thus, in spite of the fact that you aren’t running comprehensive checks, you’re more likely to spot problems, because you won’t treat checks as one-and-done, but as an ongoing, continuous system. You’re also more likely to catch smaller discrepancies earlier, because you’ll notice patterns and changes over time.
Project Portfolio Health Checks
When you’re managing multiple projects simultaneously you’re doing project portfolio management (even if you don’t know it!)
Much of the same principles of project health check and assessments apply, but at a portfolio level you need the ability to take a cohesive view of multiple projects, zooming out to see the big picture, and then zooming in (or drilling down) as required too.
Most project managers use project portfolio management software (PPM) to do this, but these systems are mostly complex, old fashioned, and prohibitively expensive.
Visor is different. It has all the necessary functionality of a PPM system, but is easy to use, affordable for organizations of all sizes, and has a clear, modern, vibrant interface that will make you and your stakeholders engaged when you review how all your projects are performing.
Here’s a dashboard in Visor showing project health metrics across multiple projects in my portfolio:
Visor has two-way integrations with Jira, Asana, Salesforce, and other apps so that you can visualize multiple projects from these apps in better, more cohesive visualizations. You can even combine multiple projects from different apps in the same view.
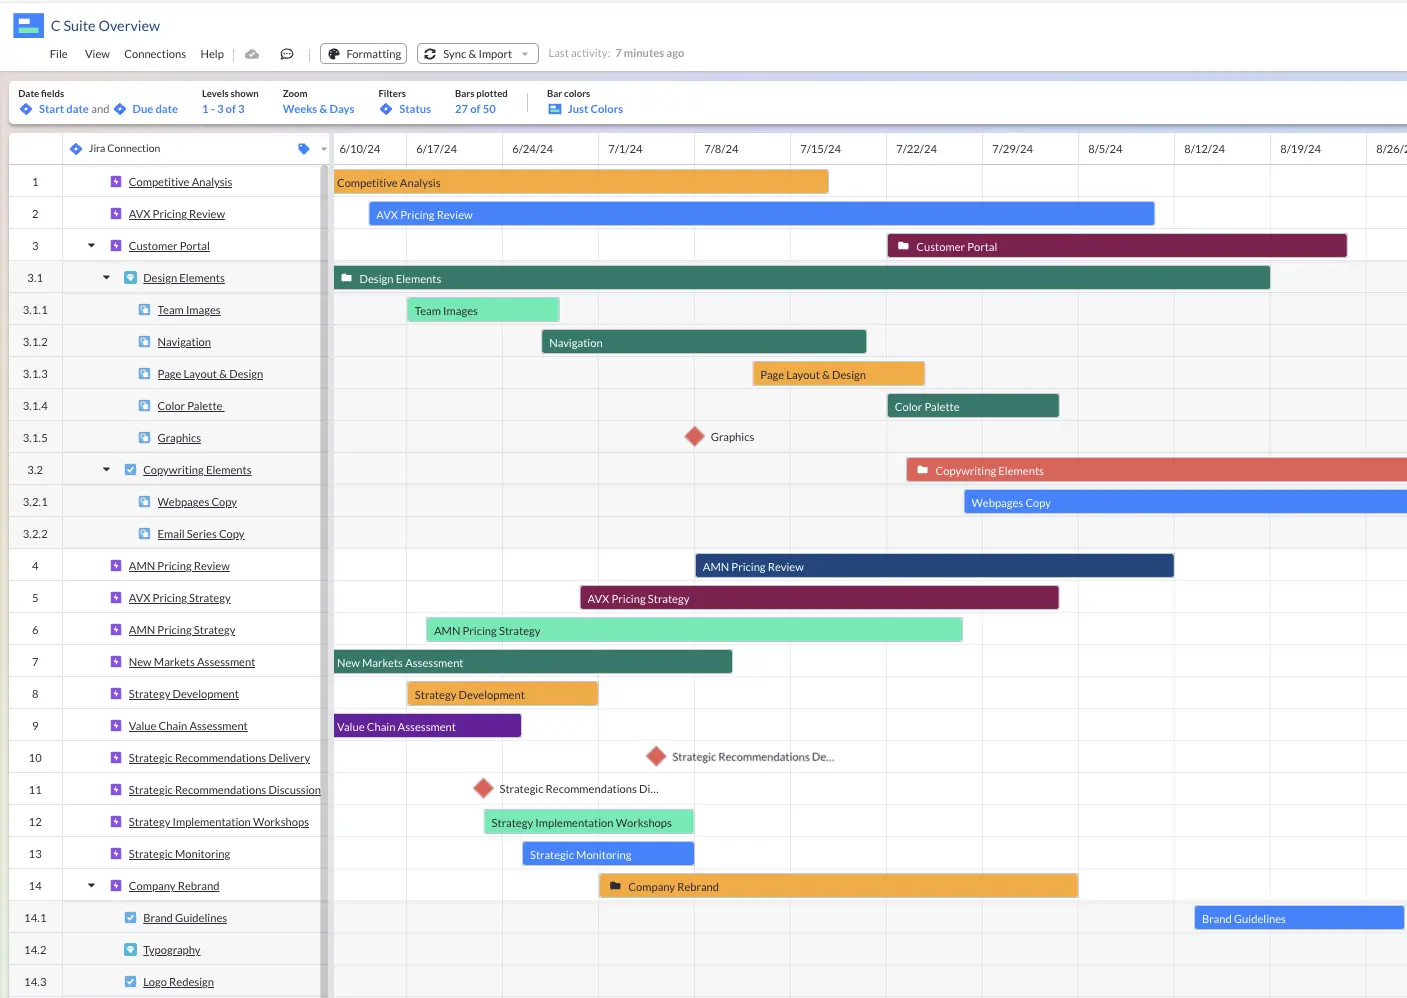
A project portfolio Gantt Chart using Jira data, to provide an overview for the executive team:
Wishing You An Easy, Smooth Project Health Assessment
Less effort, better results? Sounds too good to be true, but it’s just a different way of approaching the problem. Handling a project health assessment this way can speed up your process, reduce stress, and ultimately make health checks a regular part of every project.
If you’re looking to build ground-up project visibility, Visor can help you achieve crystal clear alignment and stop problems before they start. Try today, totally free.


