Beyond Agile Velocity: Next-Gen Metric Tracking
If you’re in project management, you likely already know that agile velocity is an important metric. Agile velocity, at its best, makes planning much easier and more tactical rather than feeling like guesswork.
Of course, to some extent, it’s still guesswork. Velocity can change based on impact from various factors – how complicated the work was, how many people were available, who had something going on outside of work, etc – and these factors are what makes measuring velocity into such a hot topic.
The solve for this is to use velocity alongside a range of other metrics to track true progress towards your team’s goals in a holistic manner.
Visor is a project portfolio management tool that helps you track your projects and measure their success in one crystal clear place. Share custom dashboards, timelines, tables, and more with the stakeholders who need to stay in the know. Get started for free!
What is agile velocity and how can you track it?
In agile methodology, velocity measures the amount of work a team completes in a sprint, and it’s mainly used as a way to estimate the team’s capacity for future sprints.
The velocity of your sprints is also something you can optimize through various different techniques, one of which is being more aware of how it interacts with the other metrics you’re tracking. If you’d like to optimize that way, you’ll want to read on.
Metrics Beyond Agile Velocity
Getting outside of the velocity box can feel like a challenge, largely because of the stakeholder reliance on it as the defining metric of success. Addressing stakeholder concerns is a challenge all its own, but one of the most effective ways to pull back the camera and re-frame success with a series of metrics is by setting up a single set of information that creates one cohesive picture.
Using Visor, you can create a single dashboard to show off multiple metrics at once, offering a snapshot of progress and success that’s customized for the stakeholder in question. If you’re presenting to C-suite, the legal team, finance, a client, or any other single stakeholder, you can build them their own dashboard to explore and investigate.
Visor’s Dashboard View
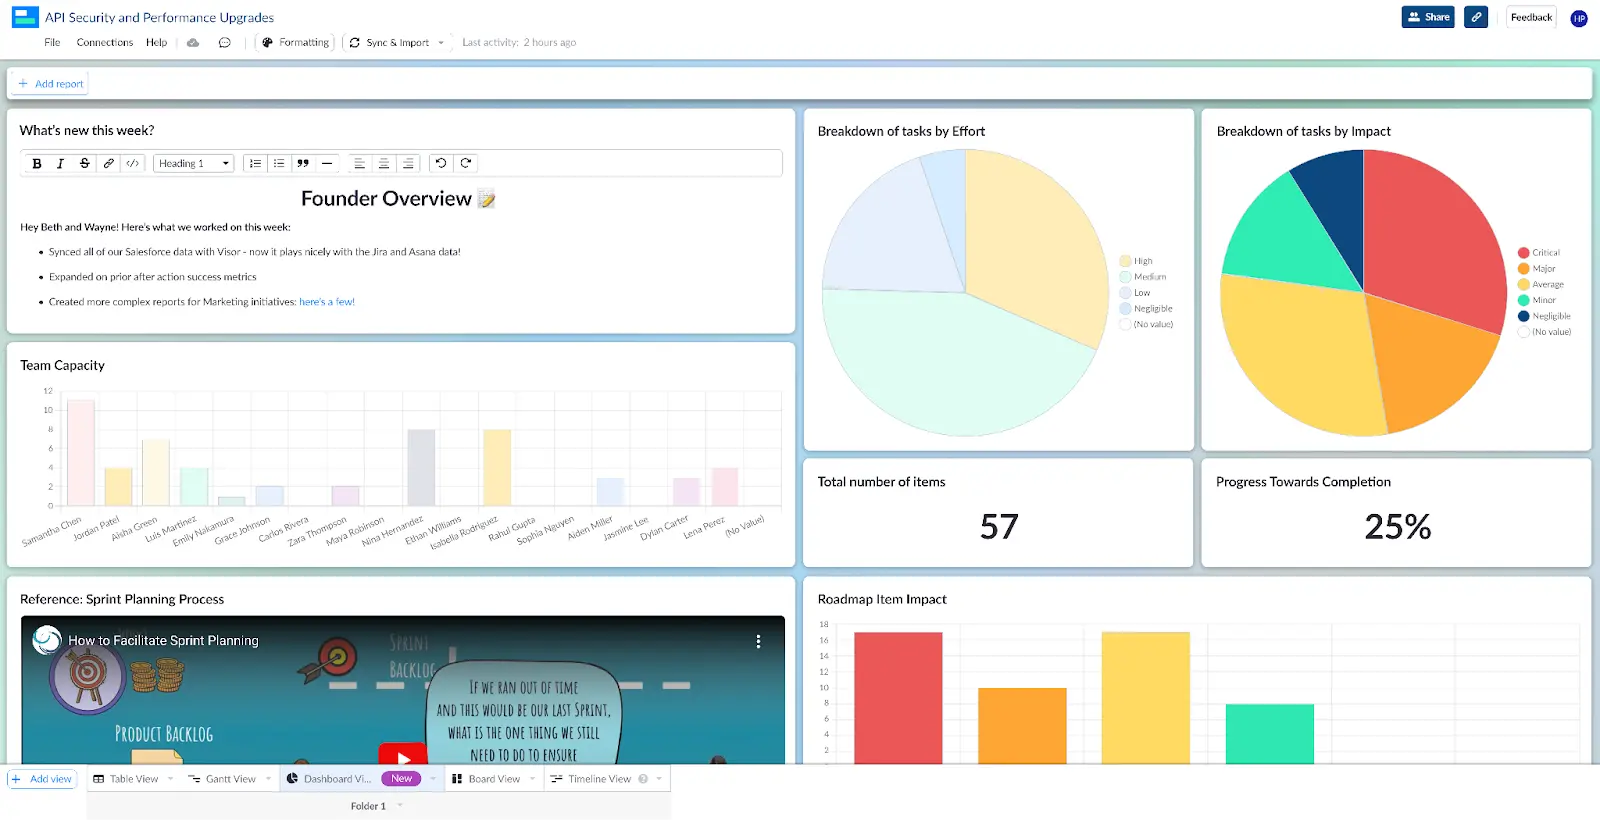
You can also customize your dashboard to include the information you want to see, and skip what doesn’t feel as relevant.
Visor’s Dashboard Options
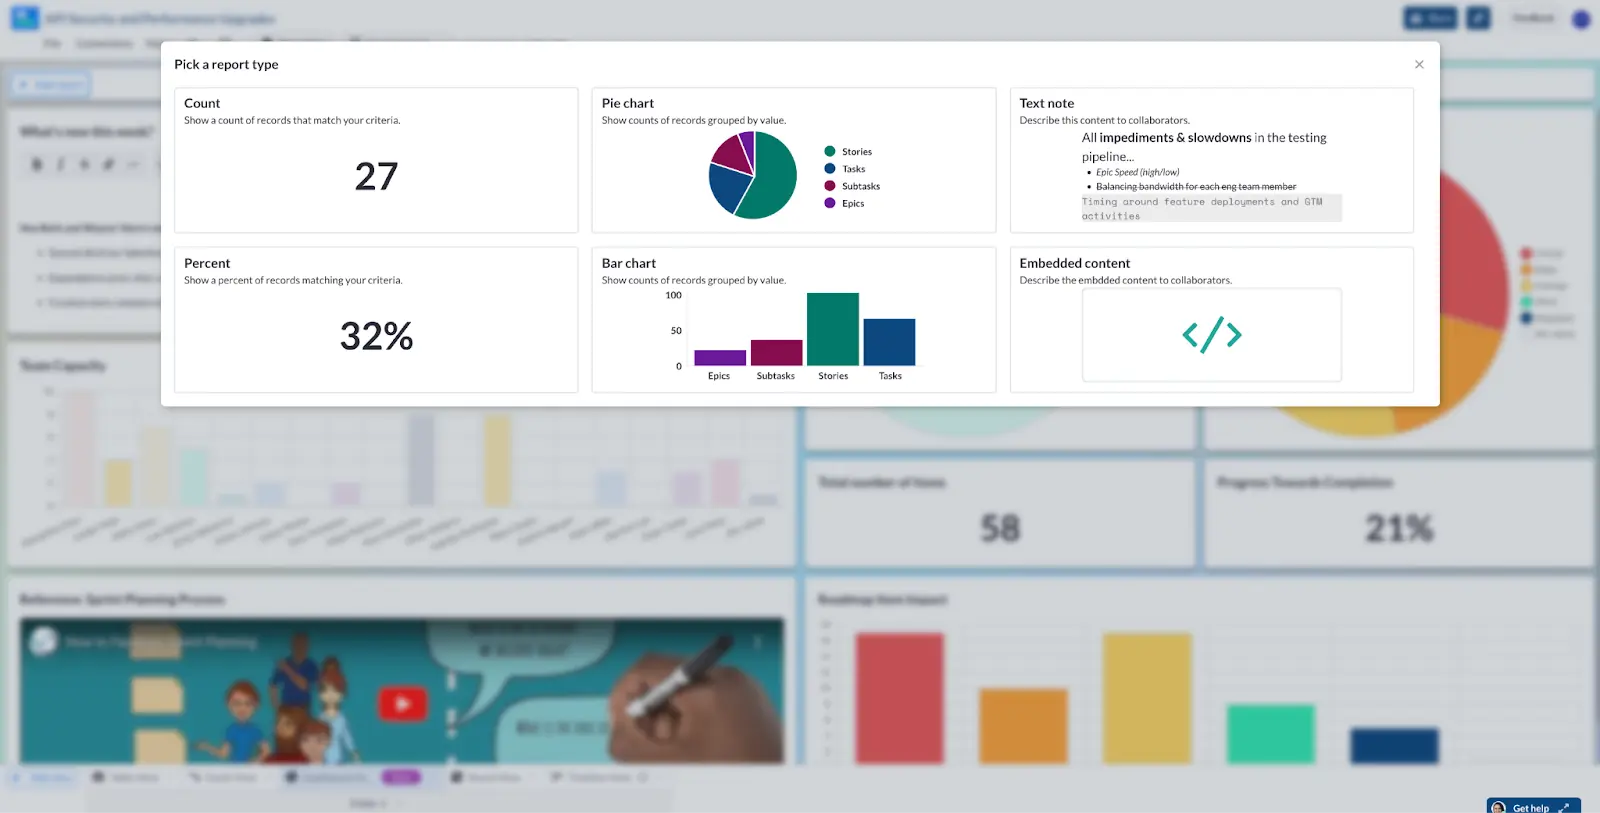
If you’re able to track it in a spreadsheet, it can go into a Visor Dashboard view!
When you do, here’s what metrics we suggest including in your report that go way beyond velocity.
- Customer satisfaction
When the end-user is top of mind, the metrics will reflect it. One of the best ways to take a measure of sprint success is how happy the end user is with the product thus far.
For client-based work, this may mean taking an NPS score regularly, checking in about satisfaction during scheduled meetings, or sending regular between-check-in surveys to determine current performance in the eyes of the client.
Visor Table View
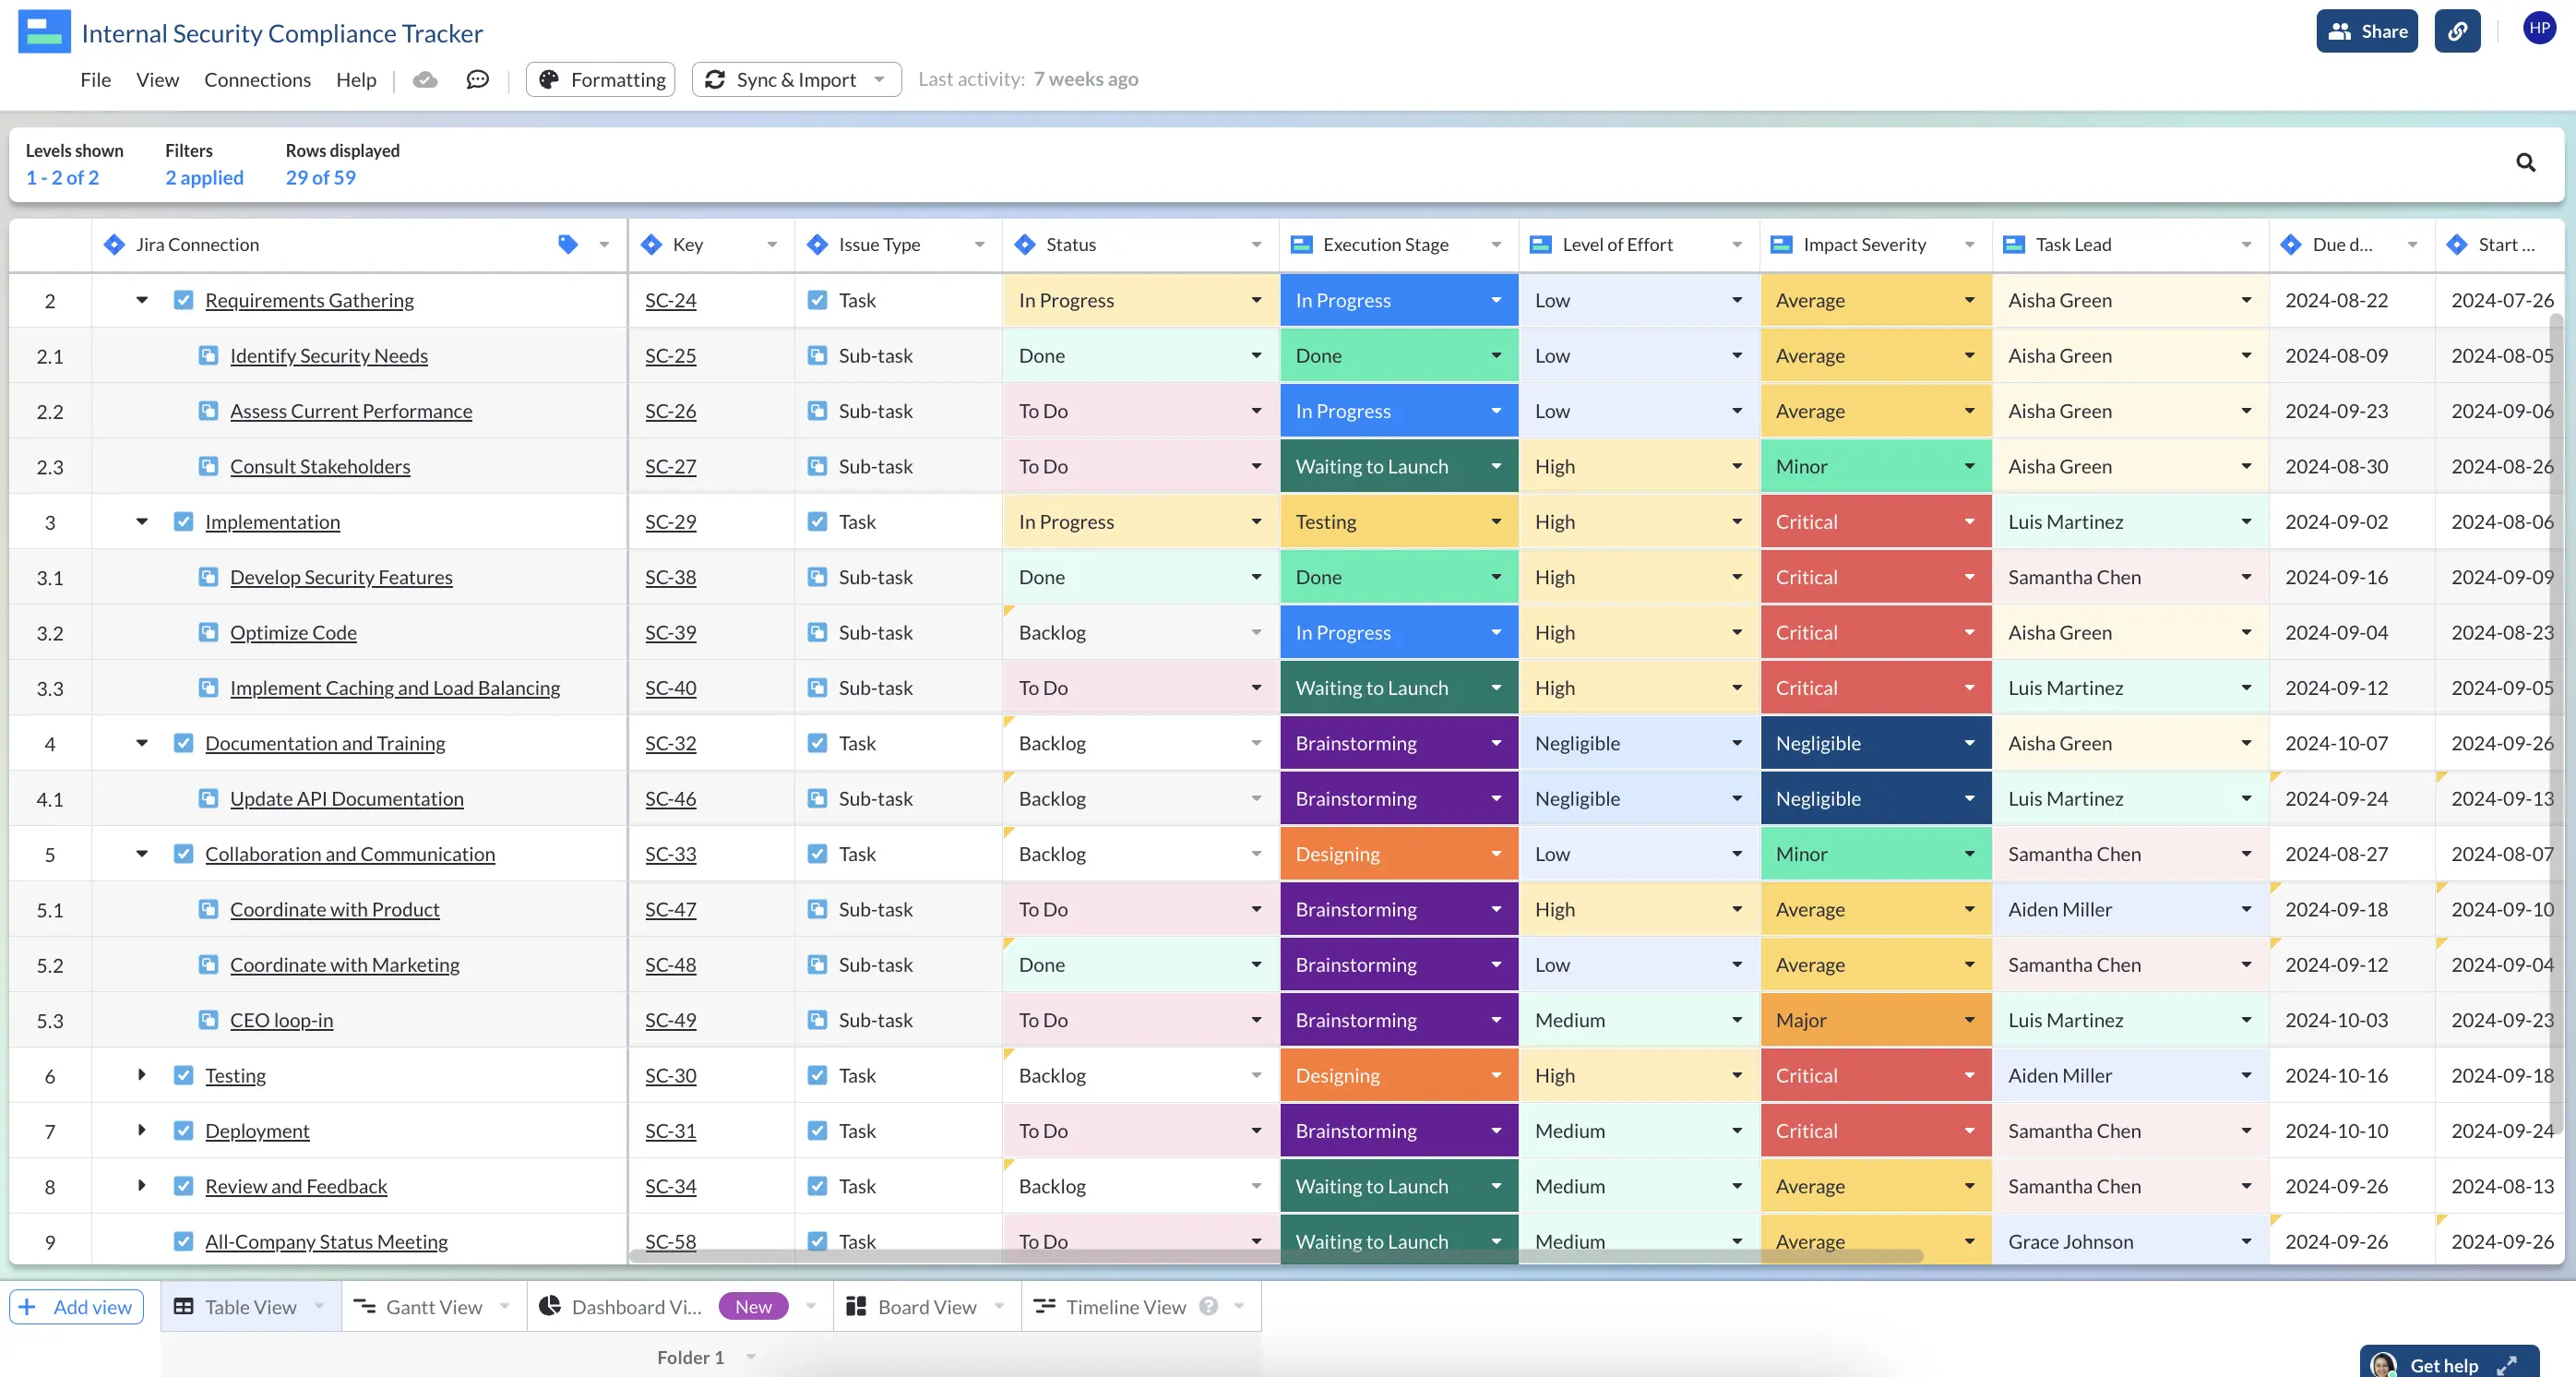
If you’re working on a product that has customers rather than clients, regular updates and feature launches are the better way to determine customer satisfaction. You’ll want to use tools like in-app surveys and customer success team check-ins to determine this score.
This metric doesn’t work as well when you have a product that goes long stretches between updates or releases, or if you’re working on a project where customer and client satisfaction isn’t a factor (like many government organizations or in-house systems engineering teams). But no metric is one size fits all anyway.
- Team satisfaction
At its core, one of the big values of measuring agile velocity is to determine how much work a team can comfortably handle sprint to sprint. If the team is producing, the theory goes, then they’re able to take on that much work or more and be fine. If they’re under-producing, then that’s too much work.
In reality, it’s not always that simple. You need to check in with your team regularly to determine how they’re really feeling. Are they feeling overworked, even if they’re able to hit their deadlines? Is it causing them tons of stress to keep up this pace? If so, you may need to slow down, even if the velocity metric says everything is fine.
Take your team’s NPS or offer weekly anonymous temperature checks. A 1-4 scale is often a great fit here:
- I feel like I don’t have enough work
- I feel like I have just the right amount of work
- I feel like I have a little too much work
- I feel like I have WAY too much work
Tracking these scores can help you offer context to a velocity metric, especially if you give your team space to explain why they feel that way and opt-in to a follow up with you.
- Quality of product
It’s not enough to produce a lot of code, materials, or content if it’s not very good in the first place. Measure quality of product to determine if the current velocity is a good fit for the type of output you’re seeing.
There are as many ways to track quality as there are types of product, so measurements here are deeply subjective. It’s good to do regular spot-checks regardless of what your team is making to make sure that everything is passing the QA bar you want to set.
- Production efficiency
A team might be producing less than usual, but they might still be doing their very best. Looking at production efficiency is a way to reveal how complex tasks really are.
There’s an old project management joke that says, “If it takes someone nine months to have a baby, couldn’t nine people do it in one month?” Nobody wants to be that person. Measure production efficiency by assigning a difficulty and weight to the effort you expect tasks to take, or by having your team describe and measure their complexity as compared to other tasks.
If your team only gets one thing done in a sprint, but it was a very complex and technical task, that might be even better than finishing a dozen projects.
- Lead and cycle time
How much your team is producing may be secondary to how long it takes them to hit those goals. If your team does miracles in the first week of a sprint, but then loses momentum, you may need to look into changing your sprint length.
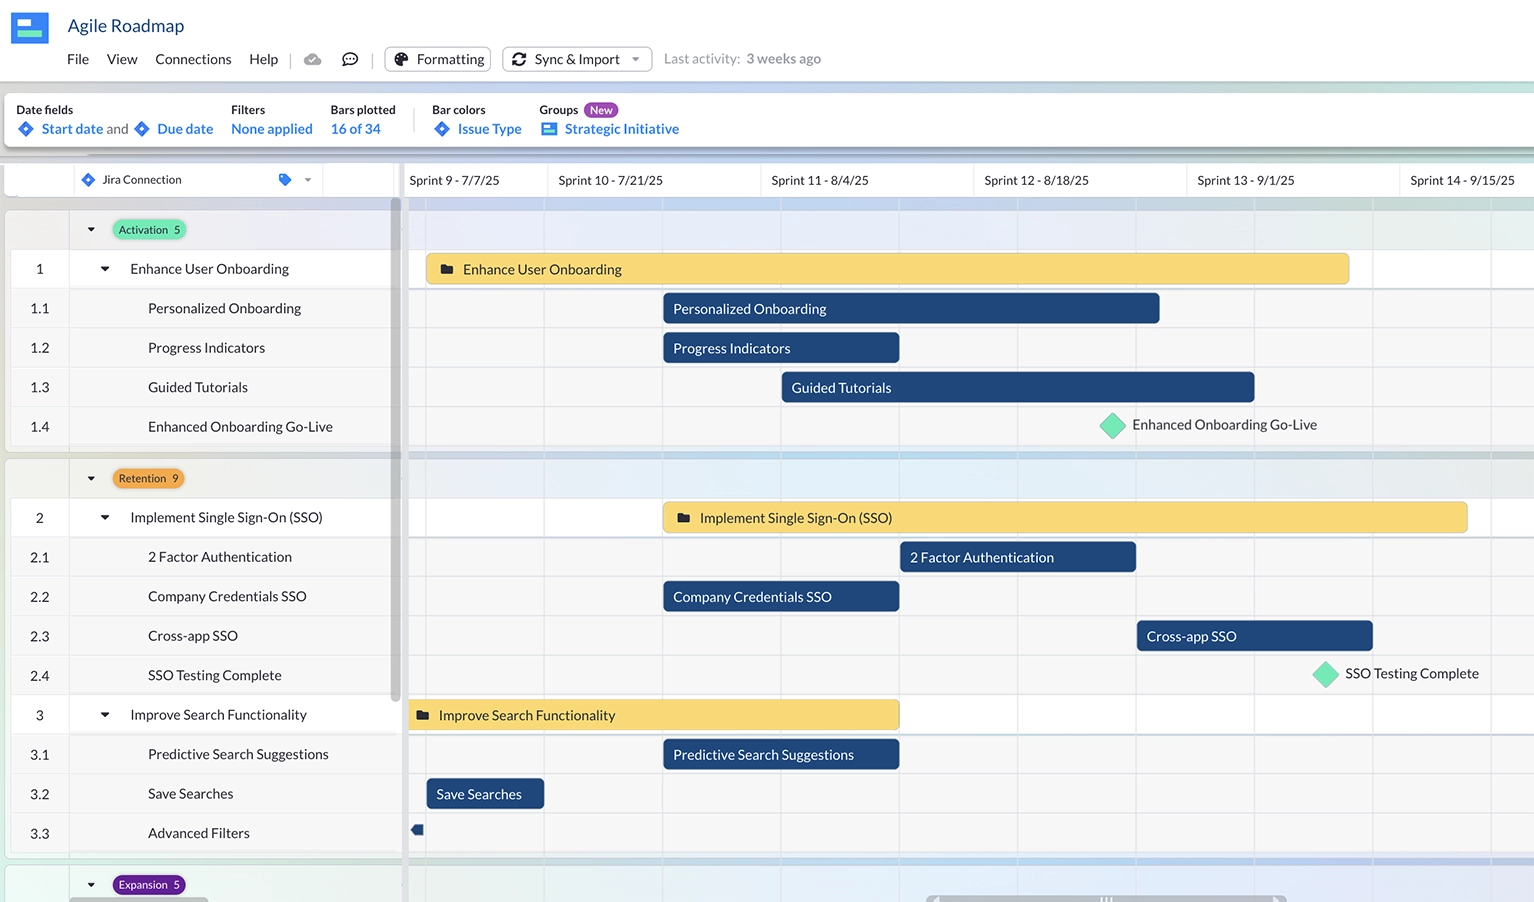
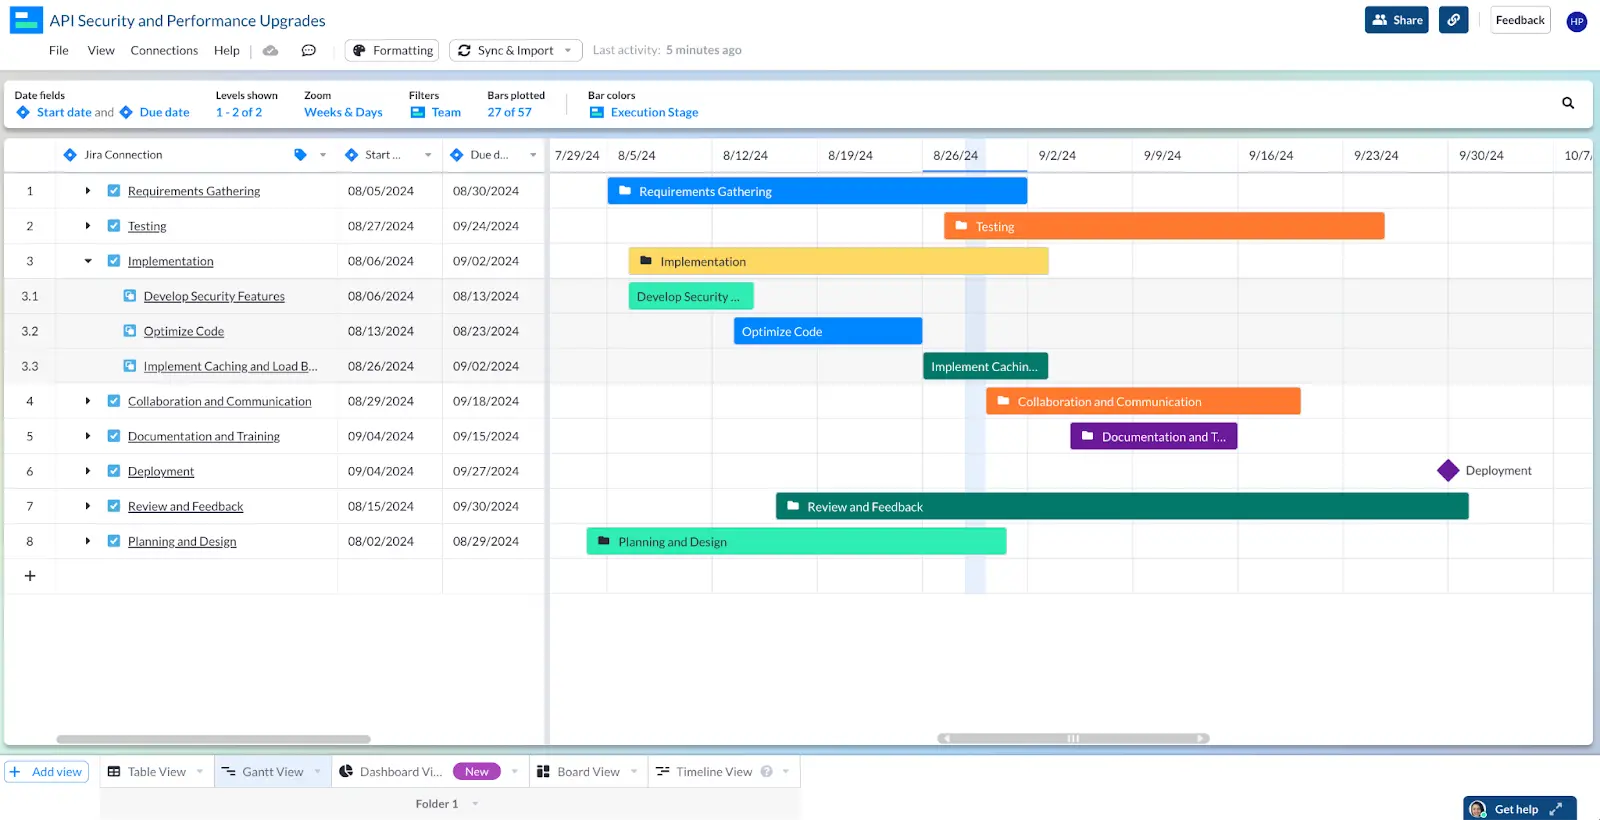
Track project completion over time using a timeline or Gantt chart as a clear way to measure the average length of time it takes your team to complete their tasks.
Visor’s Gantt View
- Backlog health
In spite of your team completing more tasks, is there a backlog that just keeps getting longer and longer? Are you adding on more to do list items than you’re finishing? That might be a sign that your backlog isn’t very healthy.
Visor has plenty of advice on keeping your backlog neatly groomed.
Start tracking which tasks are new to a given sprint and which ones are pulled from your backlog. Make sure to use this metric to determine if you’re adding too many new tasks or if unimportant items are sitting in the backlog gathering dust when they should just be cut from the list instead.
- Roadblocks cleared
On the flip side of the last metric, how often is the team clearing previous roadblocks, and how many are now left in their dust?
If your team takes a little extra time and loses some velocity in the name of taking out an especially gnarly roadblock, that might be worth far more than production speed alone. Make sure to let stakeholder know when that’s the case.
Tip: Velocity is a great metric, but is it telling your team and stakeholders what they really want to know? Context may be key! Make sure the data you share is clear and graphical using dashboarding and reporting tools.
On beyond agile velocity!
If you’re working on planning your next sprint, these metrics should help you develop a more holistic, rich insight into what your team can do and where they need more help.
Need a better tool for the job? Visor can help.
Visor is a project portfolio management tool that integrates with project management tools like Jira and Asana. Visor’s two-way integration that keeps data fresh no matter where you update it, and we offer a ton of agile templates. Whether you need a template to manage your product backlog or an agile roadmap template, Visor has it. Plus, you can always try out Visor for free.
