How To Turn Your Asana Data Into a Dashboard
Asana dashboards can help you, your team, and stakeholders track and analyze projects. But Asana’s native dashboard functionality is limited, as this Reddit question and subsequent discussion shows.
Reddit user Fantastic_Spell7376 was looking for advice on how to turn data from Asana into a dashboard as a way to track overdue tasks, team bandwidth, and overall productivity. You can read the full text in the screenshot below.
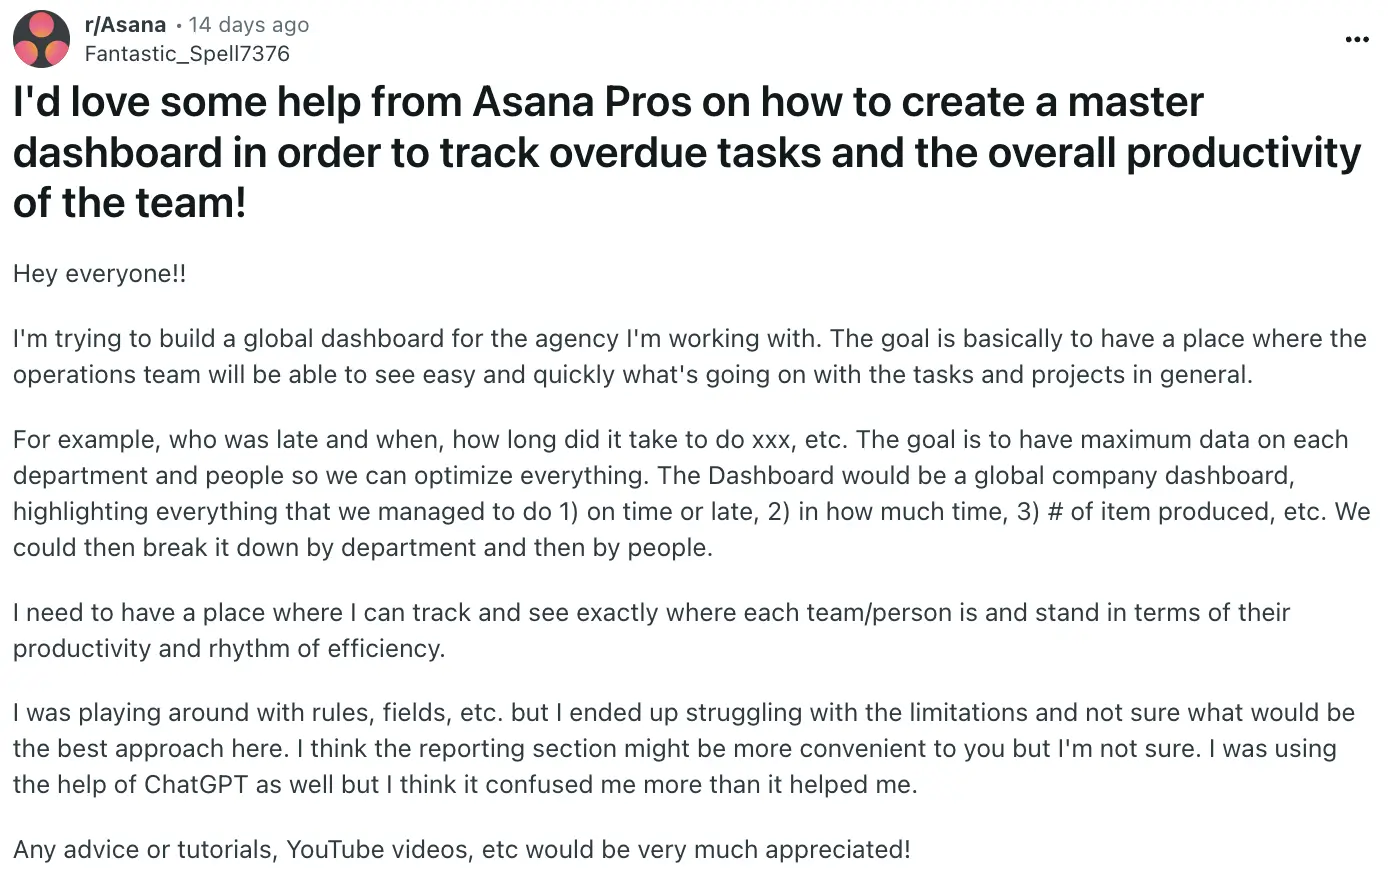
The responses were disappointedly limited. Just one thread saying that this was a difficult task, then offering some limited options.
But we can help, because at Visor this is exactly what we do. Visor is a project management tool that integrates with the tools your team already uses to help get all of your projects into one beautiful, modern portfolio. And we can enable you to create this exact type of dashboard in a few quick steps.
What do we mean by dashboards?
Let’s start with some clear terminology. When we say “Asana dashboard” what do we even mean?
Asana has a dashboard feature built in. It allows you to view some information and get answers to specific questions in a hurry. But it’s limited to a narrow window of detail based on how many projects you have, how many teams you have, and how different each of those projects are.
So you can ask questions like “How many tasks are completed” and get a quick answer, but if you want to know something like “What percentage of mission-critical tasks across all projects were completed by James before September?” you’re going to need to do that math yourself, because Asana’s dashboards just aren’t customizable enough to get that niche and granular with your questions.
That lack of customizability is actually a really serious problem.
Because dashboards are critically important for effective project management of any type.
What’s easier: asking a question and having someone give you the answer? Or asking a question and being told that you’ll have to dig through a library all by yourself to research everything that might give you that information?
You need dashboards because they enable you to understand, at-a-glance, what you’re working with. It’s like asking a question and hearing a concrete, easy, straightforward answer instead of needing to do all the research to uncover it yourself.
And if you don’t have the ability to customize your dashboards, you’re being held back on what types of questions you can even ask in the first place!
So, in this case, we’re going to pull away from Asana’s dashboard feature and instead focus on any dashboard that you can make using your Asana data – even if that means exiting the Asana app to find a better way to handle things.
How do you adapt Asana info into a functional dashboard?
We wanted to tackle this question because this is exactly what Visor does best: helping teams get all of their data into one app to enable them to visualize a full portfolio of work all at once, in a beautiful, intuitive, sleek format. Visor grants true insight and crystal clear visibility into your projects, including projects using Asana!
You can start using Visor for free, and our integrations are default features, not upcharges. You can use our two-way sync with apps like Jira, Salesforce, and Asana from the moment you start using the app.
Visor has two-way syncing with apps like Jira and Asana:
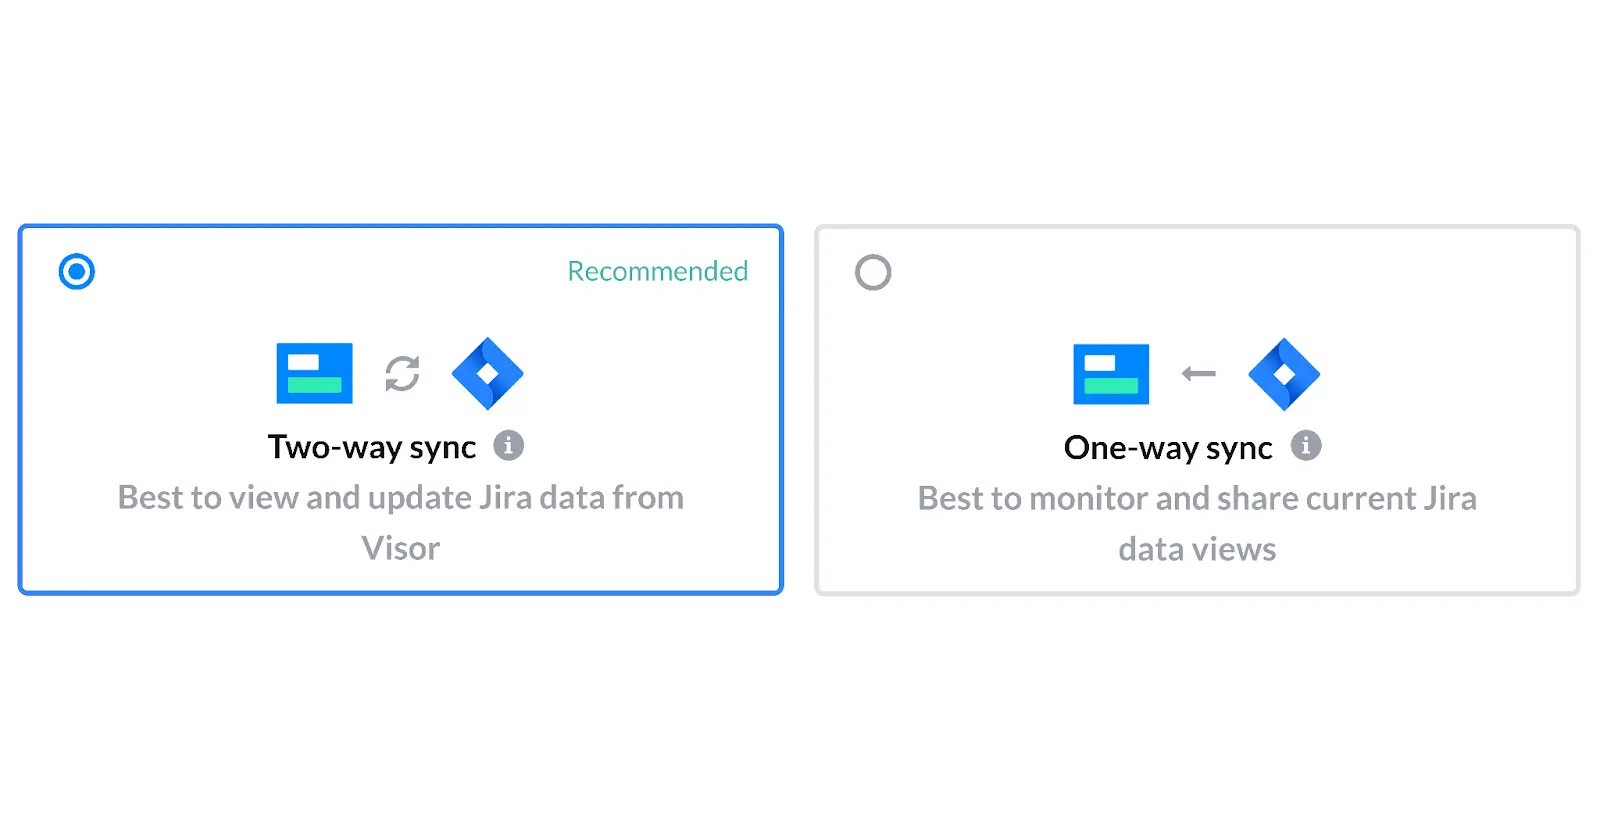
Simply select the app you want to integrate with Visor, what details you want to include or exclude, and our automatic importer will take it from there. In this case, you’ll be bringing in Asana data to create your dashboard.
Asana data in Visor’s Table view:
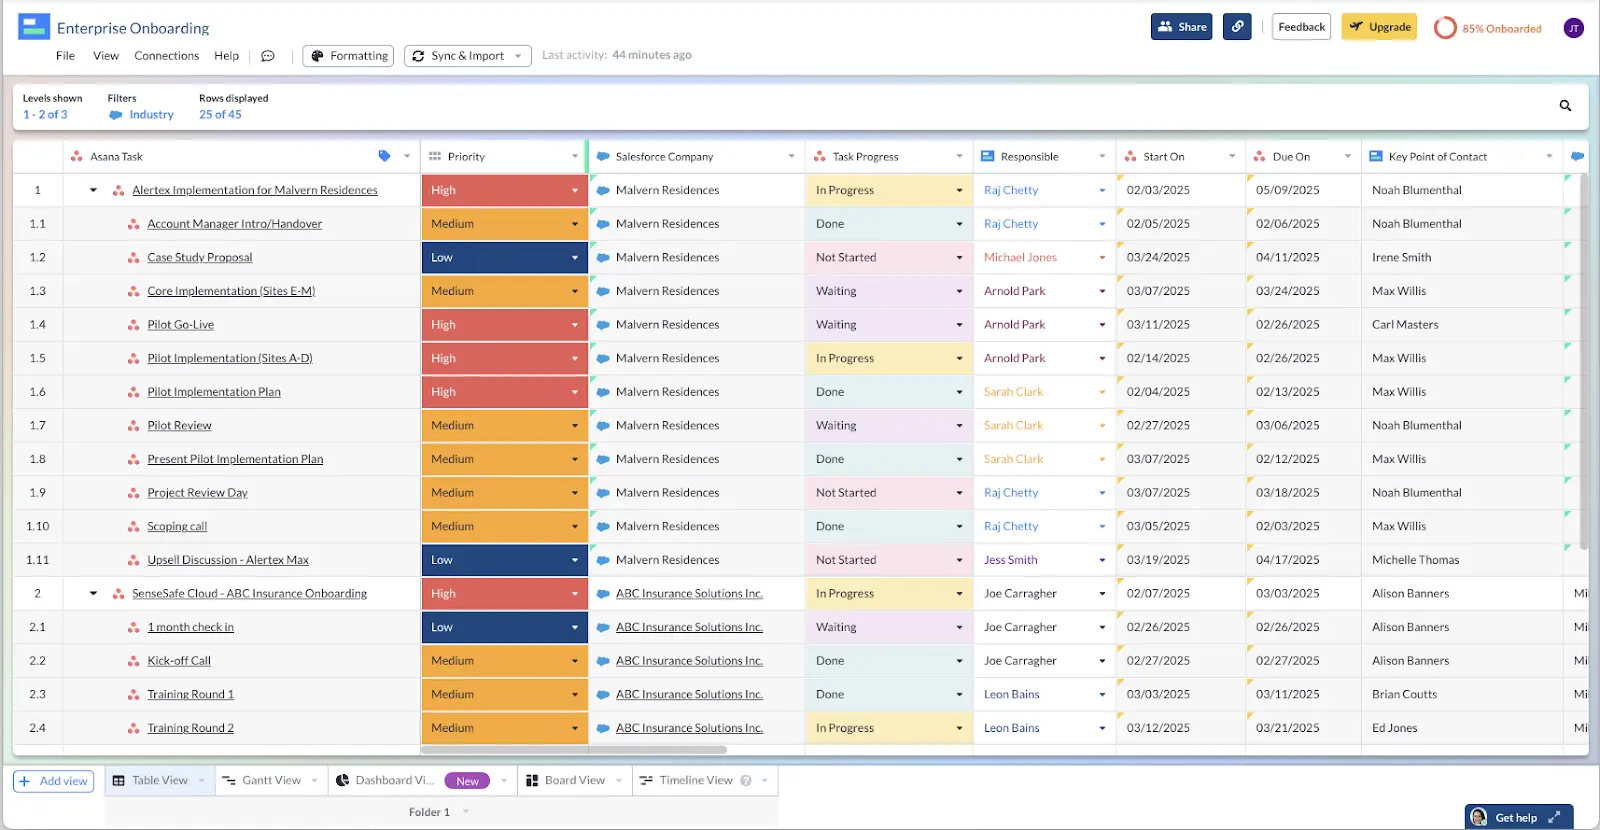
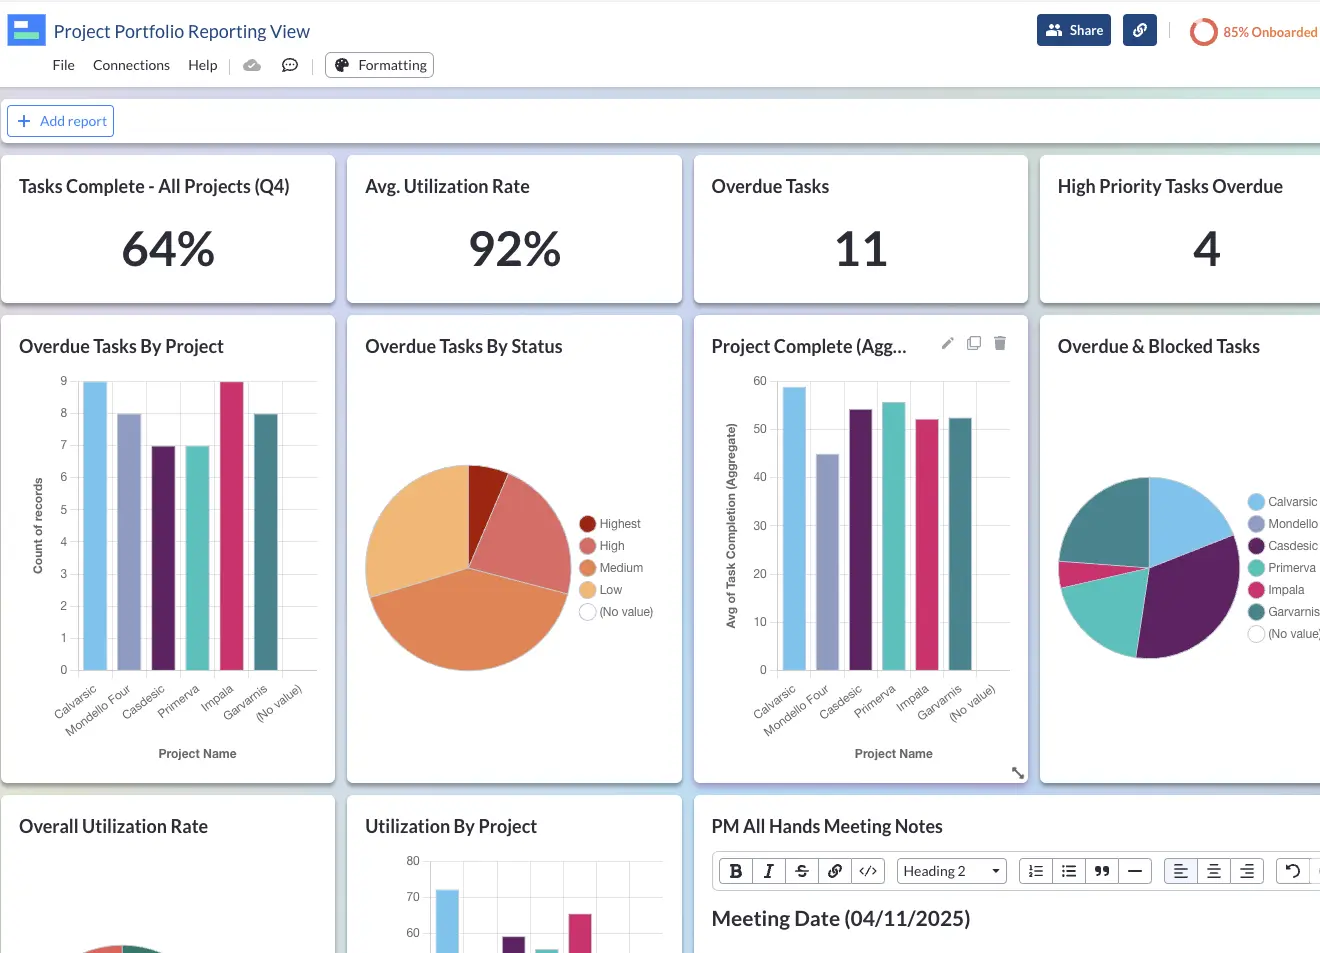
With your Asana records securely in Visor, you’ll be able to turn them into a wide variety of different views, including Dashboard, Table, Gantt chart, Kanban, and more. You can even create portfolio-level views, for example a Gantt chart for multiple projects, to gain a high-level tracking view alongside your dashboard.
Asana data in a Visor Dashboard View:
Asana Gantt chart with imported, live data. Created in Visor:
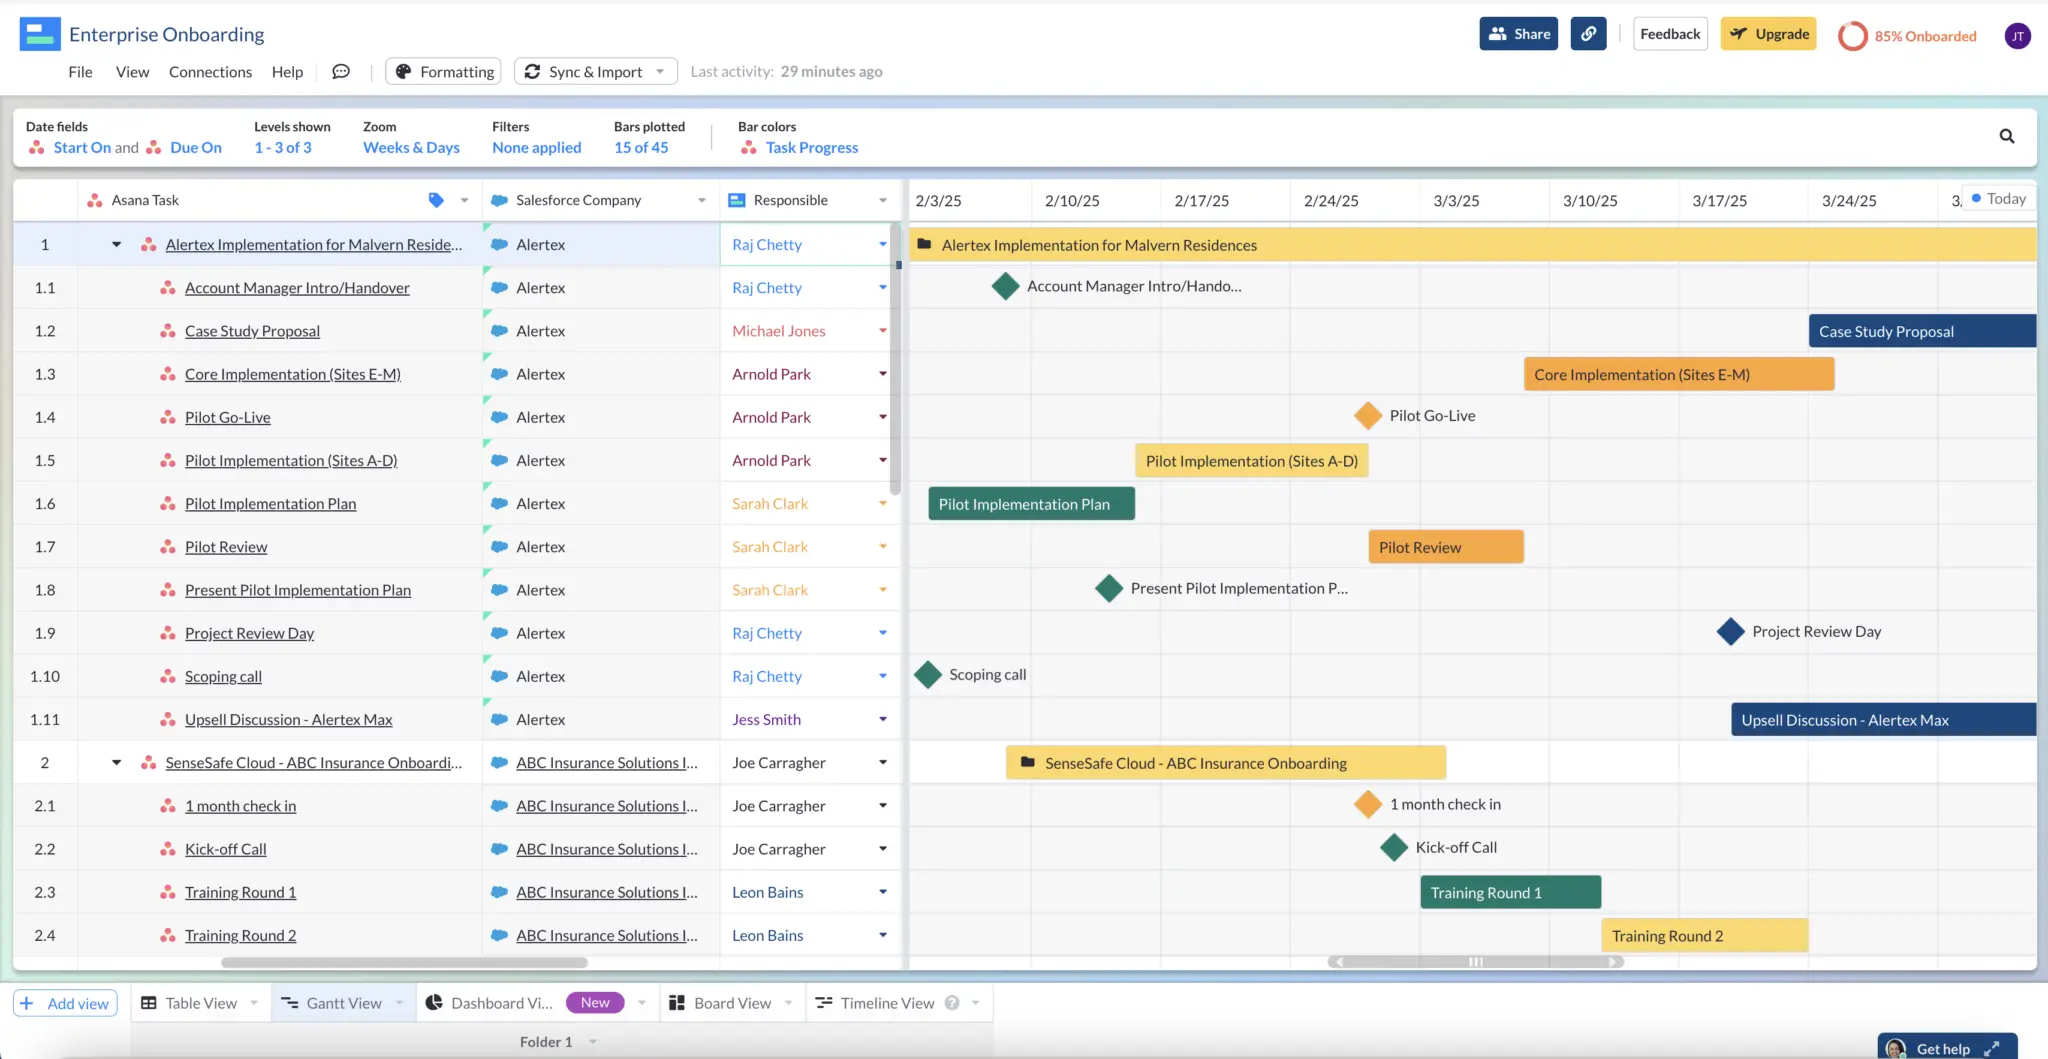
Visor makes it easy to create Asana Gantt charts using our project Gantt template.
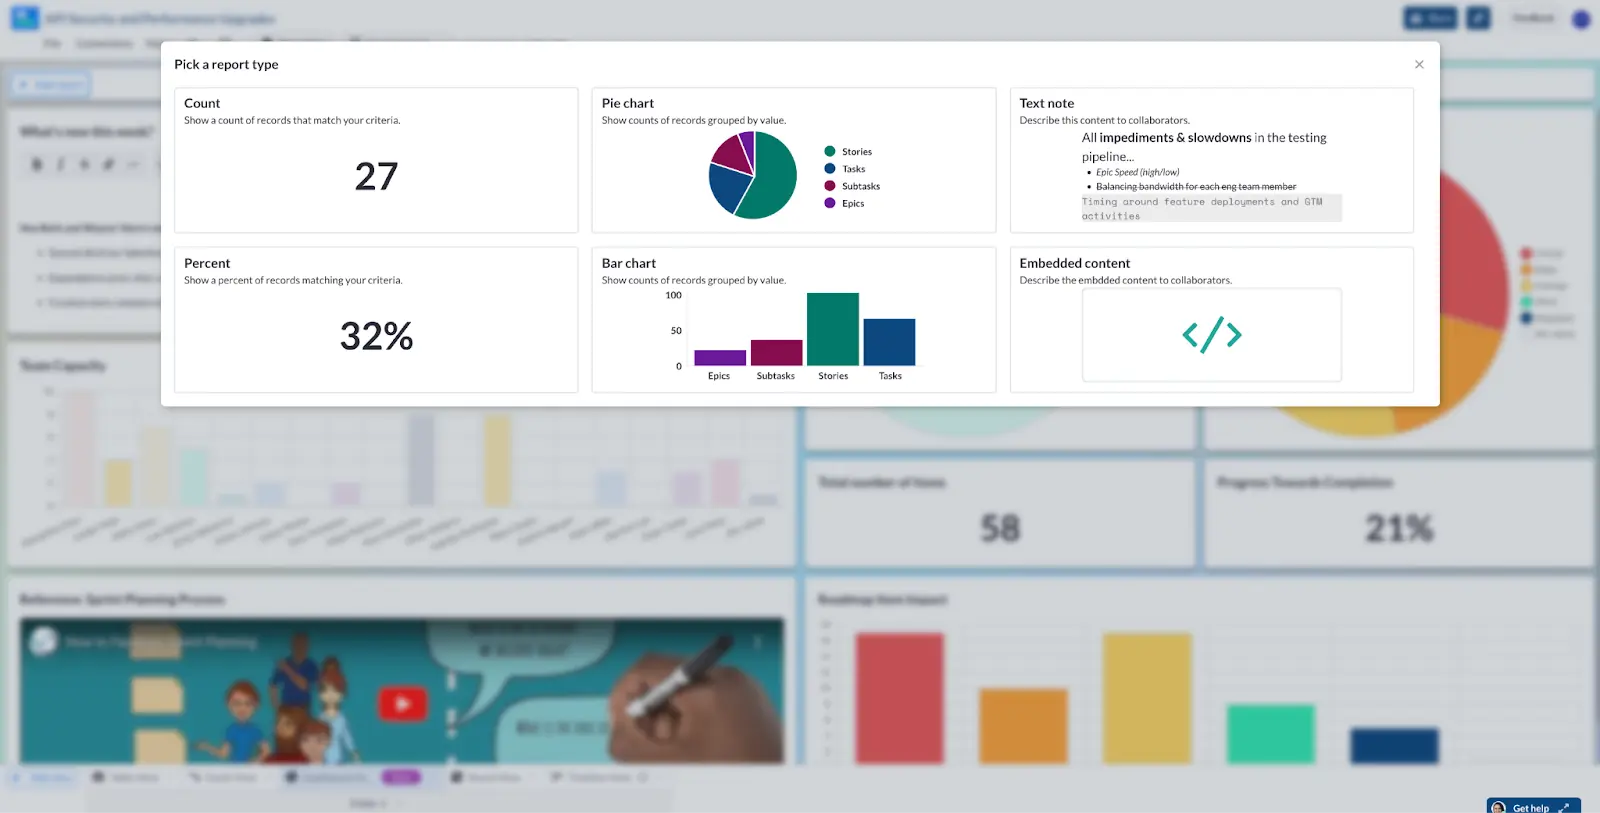
One of those views is, of course, Visor’s Dashboard. We have a wide variety of different options to slice and dice your data in any way you want. It’s all highly customizable, allowing for granular details or high-level overviews of as many projects as you need, all in one place.
Adding new reports in Visor’s Dashboard
You can create a dashboard full of Asana data with more information than you can get with Asana alone. You can even create multiple dashboards to accommodate any project, any team, and any stakeholder.
Visor Dashboard
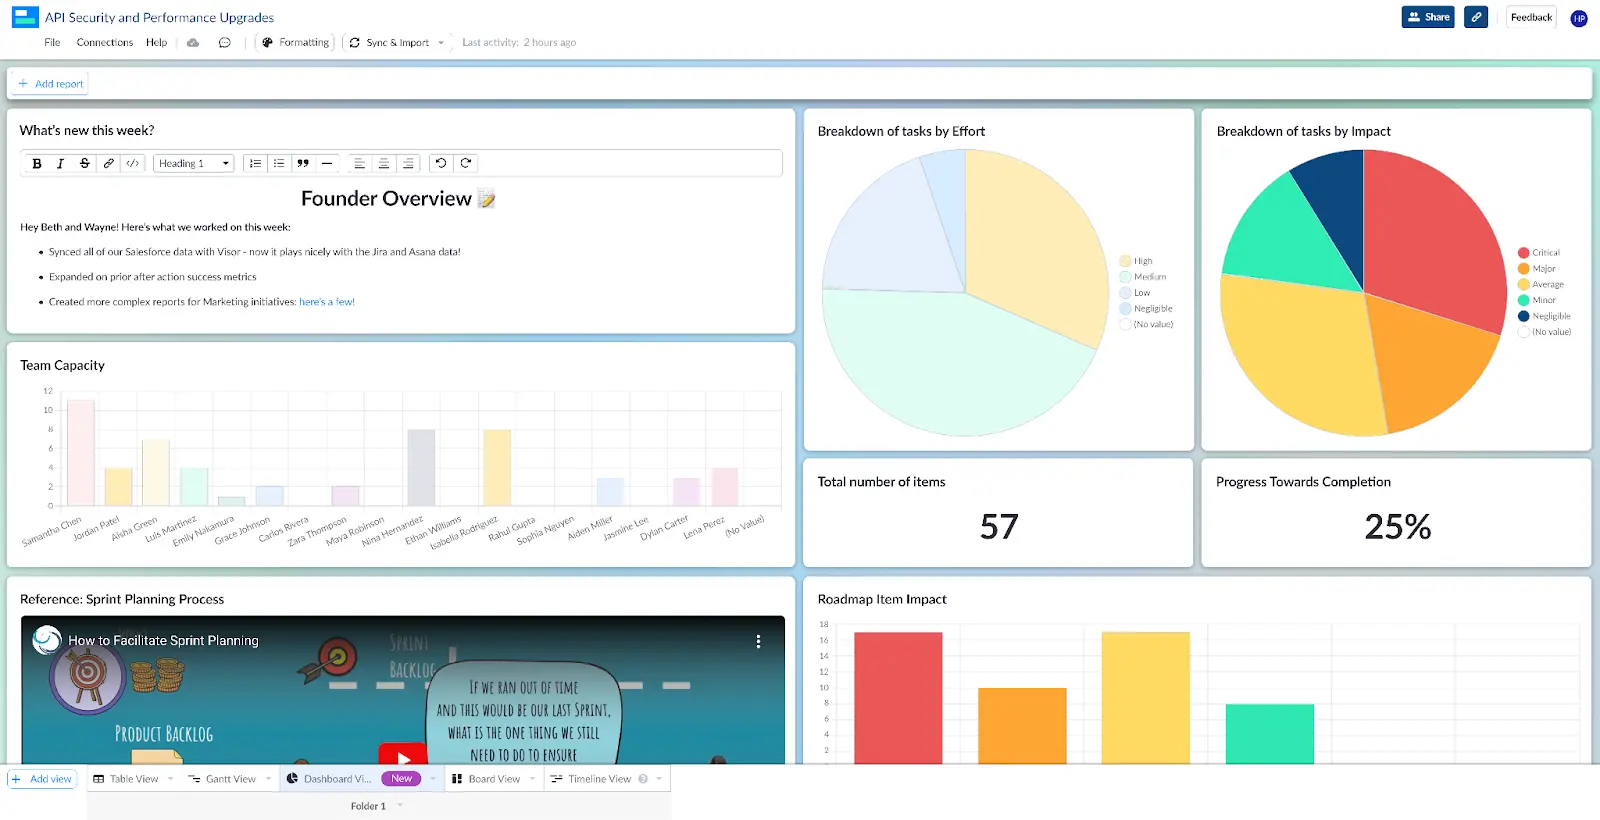
Because of that two-way integration, you can keep track of your project progress in Asana, but keep the information in perfect time within Visor at the press of a button.
If you, like that Redditor, are looking for a way to manage team capacity, we have an article on how to do capacity planning in Asana that can help you take it from here.
Are there other ways to make Asana dashboards?
Yes, but they’re pretty limited and tricky to do, at least if you’re looking for a functional and flexible team productivity tracker. Asana isn’t exactly set up to handle this kind of info, so you should know going in that it’s not going to be the best if you’re trying to pull from multiple projects at once.
Some things, like Portfolios and Goal tracking, are only available at the higher paid tiers of Asana in the first place. So, while they exist, they’re behind paywalls. You’ll need to shell out just shy of $25 per user per month for the privilege.
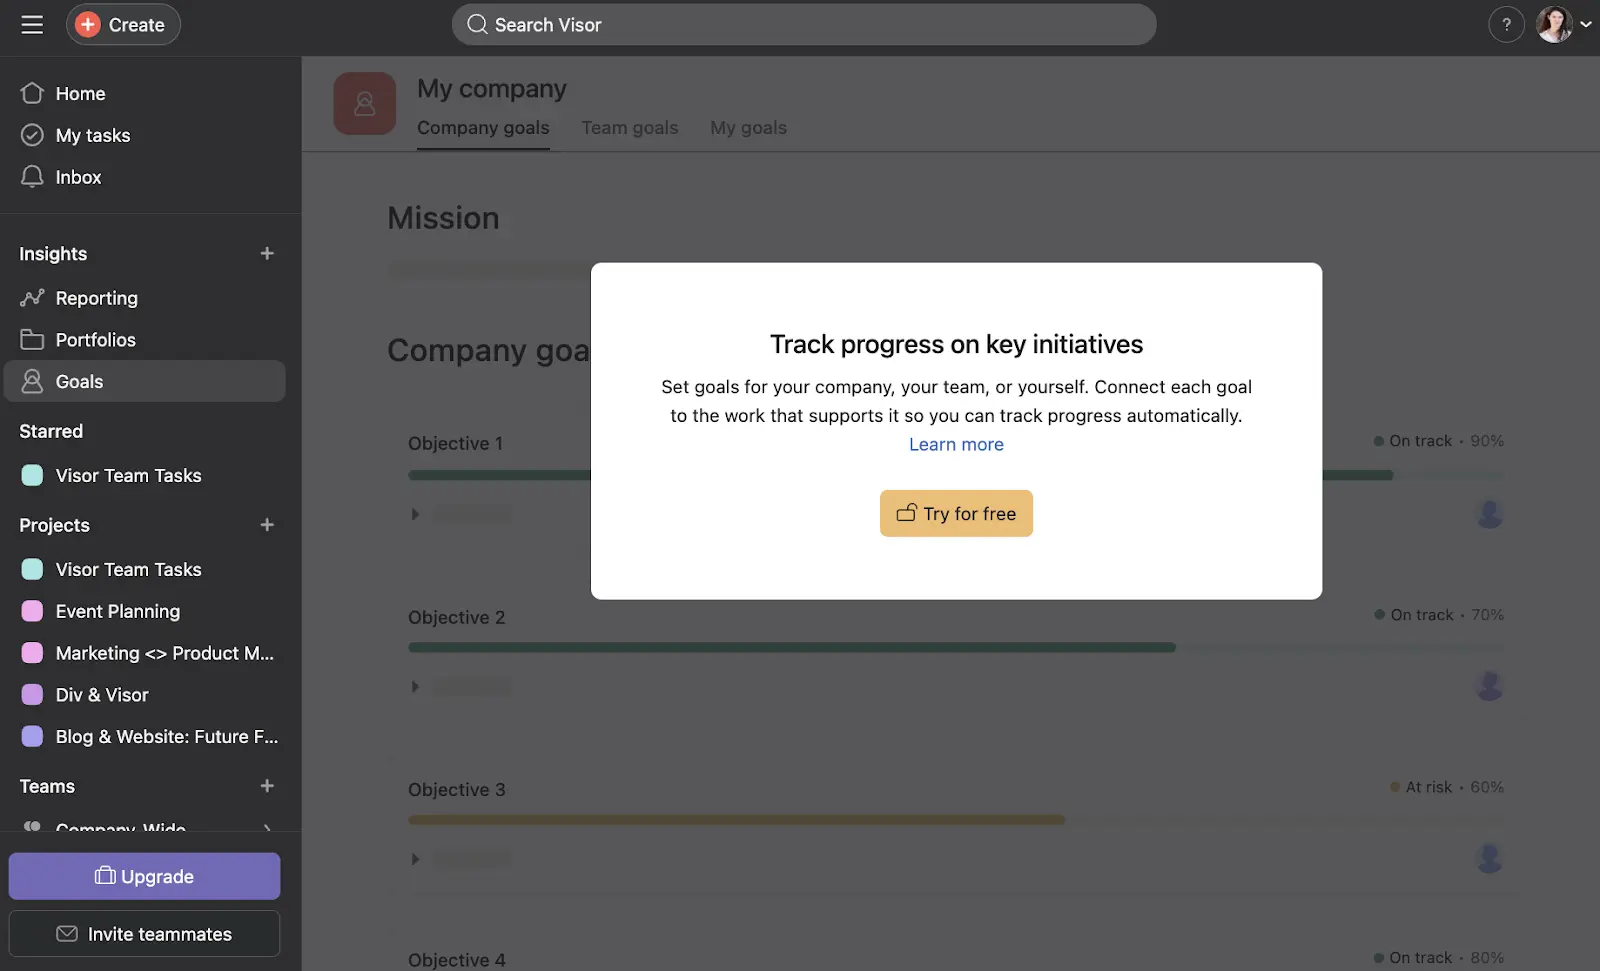
The Starter plan is cheaper, just shy of $11 per user per month, and that will unlock Dashboards for you. However, these dashboards aren’t really set up to handle multiple projects at the same time.
You can get the basics by having an Asana Starter or Advanced plan, then navigating to the sidebar where it says “Dashboards.” From there, create a board and arrange it to show overall tasks. The basic view does permit you to see some large-scale numbers, but it’s not really customizable enough to get into more granular details.
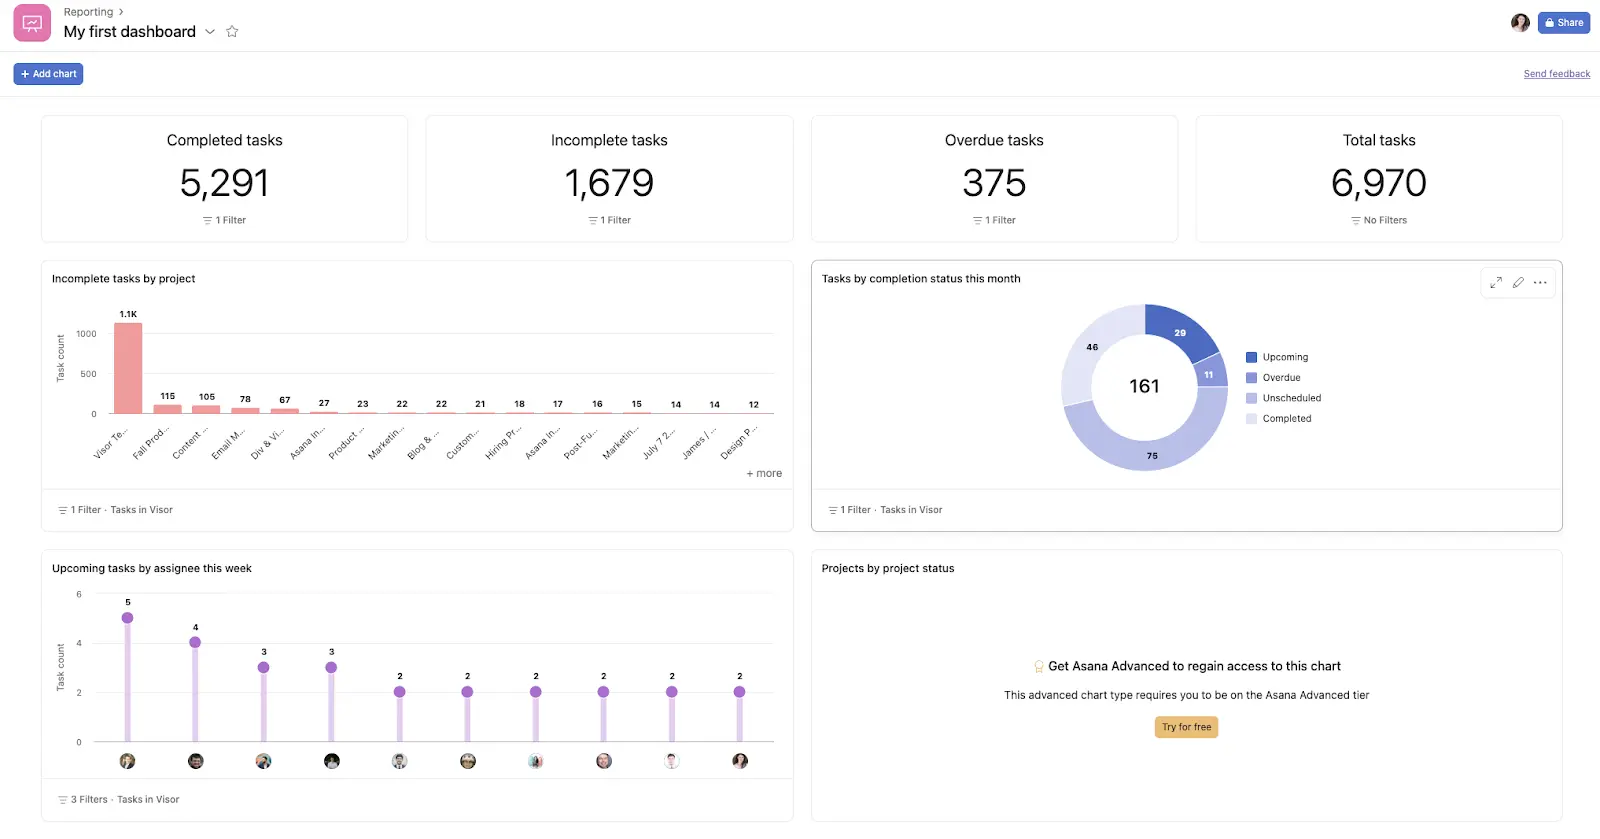
If you want more information reflecting your entire portfolio, you may be able to change how you input your data in order to have it show up better in the dashboard.
You can find templates that will allow you to set up your Asana projects exactly the same way each time, so that the terms you pull from to create Dashboard queries are much easier to standardize and find no matter what projects you’re trying to compare.
If you have multiple projects already, this may not be a great option, as it would require you to overhaul how your projects are set up from the ground up, and who has time for that?
It’s a bit of a workaround, but if you’re determined to remain within Asana and stay on the cheap side, it might be able to work for you! You could also try connecting Asana to Google Sheets, but the dashboard you eventually create will probably lack the professionalism, polish, and stability that you want from a project or portfolio management dashboard.
Creating your Asana Dashboard
Regardless of if you go for the upgrades or the workarounds, it’s entirely possible to solve the problem of wanting a dashboard that reflects workload, productivity, and capacity across multiple projects in Asana.
We have to say again that this is exactly what Visor was built to help you do. Our integration with Asana is free as an out-of-the-box feature, as is our Dashboard view, which you can customize to look like anything you want, so you can report on as many projects as you need.
Try Visor out for free and find out why we’re the top choice for so many PMs.
Visor doesn’t just create Dashboards. We also offer tons of free Asana-friendly templates for things like release roadmaps, along with project Gantt chart templates, and more.
Visor also integrates with Jira, Salesforce, Hubspot, and other apps, so that you can unlock new ways to visualize your data that are not possible in the apps themselves, for example creating a Salesforce Gantt chart to track deals, customer implementations, or other work where a Gantt chart would be extremely helpful.


